Your Ultimate SaaS Return On Investment Template
Download our free return on investment template and learn how to calculate, analyze, and present ROI for any SaaS project, from new features to bug fixes.

A solid return on investment template isn't just a spreadsheet; it's a repeatable, data-driven framework that helps you justify where every dollar and engineering hour goes. It’s how you get your entire team aligned and move decisions away from pure intuition. This structure gives you a clear way to forecast the real-world financial impact of everything from new features and bug fixes to major strategic bets.
Why Gut Feel Is Costing Your SaaS Team Money

In the fast-paced, high-stakes world of SaaS, every development sprint is a bet on the future. Product managers and CTOs are constantly juggling which projects will actually drive growth versus those that will just drain resources with nothing to show for it. Relying on a hunch or simply listening to the "loudest voice in the room" is a recipe for expensive mistakes.
This isn't some abstract risk—it’s a very real, measurable problem. Time and again, companies that skip rigorous financial analysis burn through capital with shocking inefficiency. For example, some reports have found that a staggering 70% of SaaS features deliver zero ROI, often due to poor prioritization. That’s a massive, costly error that a simple template can help you avoid. If you're interested in digging deeper, you can see how ROI calculators are changing the game for product teams at Quadratichq.com.
The True Cost of Guesswork
When you operate without a standard framework for evaluating ideas, you open the door to inconsistency and bias. A charismatic team lead might talk their way into getting funding for a pet project, while a critical—but less exciting—infrastructure update gets pushed to the back of the line indefinitely.
This seat-of-your-pants approach creates a cascade of problems:
- Wasted Engineering Cycles: Your developers' time is one of your most precious resources. Every hour they spend on a low-impact feature is a direct hit to your bottom line.
- Team Misalignment: Without a shared, financial understanding of a project's goals, you can easily have sales, marketing, and product teams all pulling in different directions.
- Inability to Learn: If you don't define what success looks like with clear financial metrics from the start, it's impossible to look back later and know if your bets actually paid off.
An ROI template is so much more than a calculator. It’s a communication tool. It forces you to translate vague feedback and strategic goals into a solid business case that everyone, from a junior engineer to the CEO, can understand and get behind.
Fostering Financial Accountability
Bringing a template into your workflow isn't just about crunching numbers. It's about building a culture of financial accountability where every proposed project is examined for its real business impact. This shift empowers your team to start thinking like owners, constantly asking, "Is this the absolute best use of our limited resources?"
By creating a clear, repeatable process, you strip the emotion out of the equation and replace it with hard data. The conversation shifts from "I think we should build this" to "Here's the data showing this feature could generate $200k in expansion revenue over the next six months."
This data-first mindset is the backbone of effective prioritization, a concept we explore in our guide to AI-powered decision-making. Ultimately, a good template transforms your product roadmap from a wish list into a strategic financial plan designed for one thing: profitable growth.
Building Your Business Case with Realistic Numbers
Any good ROI analysis rests on a solid, defensible foundation. The numbers you plug into your return on investment template aren't just placeholders; they're the very bedrock of your business case. If your stakeholders can poke holes in your inputs, your entire argument loses credibility before the conversation even gets started.
The goal here isn't guesswork. It's about making educated, realistic estimates. You have to map out every conceivable cost—not just the obvious ones. While developer salaries are often the biggest line item, they're far from the only expense. Overlooking the "hidden" costs is a classic mistake that can throw your final ROI calculation way off.
Defining Your Total Investment
To get a credible financial picture, you need to account for the full scope of resources your project will eat up. It's easy to just think about the engineering team, but you need to consider the ripple effect across the entire organization.
A truly comprehensive cost analysis should include:
- Direct Labor Costs: This is the big one—salaries for your engineers, designers, and project managers for the project's full duration. A common oversight is forgetting to factor in dedicated time for quality assurance (QA) and testing.
- Opportunity Costs: This one is crucial. What high-impact project is not getting done because your team is focused on this one? It's a non-financial cost, but it’s absolutely critical to acknowledge when making strategic trade-offs.
- Tooling and Subscriptions: Will this project demand a new software license or an upgrade to a service you already use? These recurring costs need to be baked into your total investment.
- Meeting and Planning Time: All those hours spent in planning sessions, daily stand-ups, and review meetings are real, tangible costs. A project with 10 participants in a one-hour daily meeting for a month quickly balloons to over 200 hours of salaried time.
- Potential Disruptions: Think downstream. Will this new feature require a big training push for the customer support team? Will it cause a temporary slowdown in another department? You have to quantify the cost of that training and any dips in productivity you anticipate.
When you're pulling all this together, using ready-made proposal templates can be a huge help in structuring your financial justifications and making sure you don't miss anything.
Quantifying the Expected Gains
Once you have a firm grip on the costs, it's time to quantify the benefits. This is where you draw a direct line from your project to the metrics that matter: revenue, churn, and operational efficiency. The more specific you can be, the stronger your case.
Don't just say a feature will "improve the user experience." Translate that into dollars and cents. For instance, a streamlined checkout process could be projected to decrease cart abandonment by 5%, which has a direct and measurable impact on revenue.
Let's walk through a few common scenarios:
- New Feature Launch: You need to project the number of new subscriptions or upsells this feature will drive. If you expect 50 existing customers on your Pro plan to upgrade specifically for this feature, the gain is 50 x (New Plan Price - Old Plan Price) x 12 months.
- Critical Bug Fix: What is the bug actually costing you? How many support tickets does it generate each month? If a single bug is responsible for 100 tickets monthly and each ticket costs your team 25 in support time, fixing it saves ****30,000 a year. Simple as that.
- Churn Reduction Initiative: Let's say a UX improvement is projected to reduce churn by 0.5%. To put a number on that, you first have to know the lifetime value (LTV) of your customers. Saving even a handful of high-LTV accounts can deliver a massive return. For a deeper look, check out our guide on calculating customer lifetime value in SaaS.
The most compelling business cases are built on a foundation of realistic, data-backed assumptions. Your goal isn't to be perfect, but to be thoughtful and transparent about how you arrived at your numbers.
Anchoring Your Assumptions in Reality
A projection is only as good as the assumptions it's built on. To make sure your numbers can stand up to scrutiny from stakeholders, you have to anchor them in real-world data, not just wishful thinking. Wildly optimistic guesses will get you shot down in a heartbeat.
Here’s how to ground your estimates in something tangible:
- Use Historical Data: This is your best friend. Look at how past projects performed. How long did a feature of a similar size actually take to build? What was the adoption rate for the last major update you shipped? Your own internal data is always the most valuable resource.
- Lean on Market Benchmarks: If you don't have good internal data yet, look for industry reports or competitor analysis. What's the average customer acquisition cost in your sector? What are typical churn rates for a SaaS company your size?
- Incorporate Qualitative Insights: Never discount the value of customer feedback. If multiple high-value customers have flat-out said they would pay more for a specific feature, that's a powerful data point. You should absolutely include that in your revenue projections. This is where a tool like SigOS shines, by identifying those revenue-driving signals right from your customer conversations.
By weaving these approaches together, you can build a set of assumptions that are more than just numbers on a page. They become a credible forecast of your project's true potential.
Putting the ROI Template to Work: Real-World SaaS Scenarios
This is where theory hits the road. A solid return on investment template is only as good as the numbers you feed it. Let's walk through four common situations every SaaS team faces, applying the core ROI formula—(Gain - Cost) / Cost—to build a business case that actually gets approved.
The whole process really boils down to three things: realistically estimating your costs, finding credible ways to quantify the benefits, and anchoring all your assumptions in real data.
This flow shows how each piece builds on the last to create a projection you can stand behind.
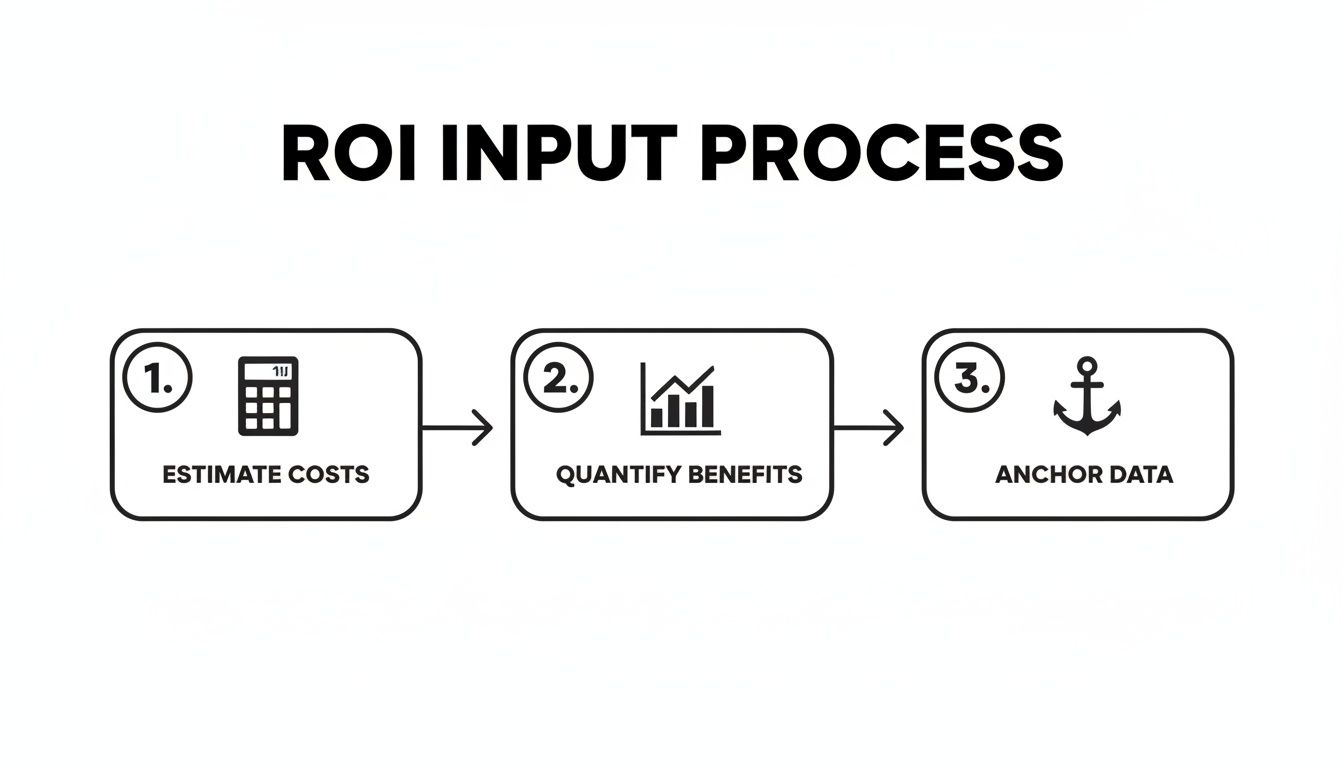
As you can see, it's a logical progression from effort to outcome, helping you build a story that's both ambitious and believable.
Modeling a New Feature Launch
Building a new feature is probably the most common reason you'll pull out an ROI calculator. The goal is simple: connect your team's development time directly to a tangible impact on the bottom line, whether that’s attracting new customers or getting existing ones to spend more.
Let’s say your team wants to build an advanced reporting suite. You've heard this request constantly from mid-market customers stuck on your $99/month Pro plan. You also know competitors are poaching them with better analytics.
First, let's tally up the costs. It’s more than just dev time.
- Development & QA: $60,000 (Two engineers and a QA specialist for two months)
- Design & PM: $15,000 (Factoring in part-time work from a designer and product manager)
- Marketing & Launch: $5,000 (For launch assets and a small promotional budget)
- Total Estimated Cost: $80,000
Now for the fun part—the potential payoff. Based on customer interviews and revenue-impact signals from a tool like SigOS, you feel confident that 100 existing Pro customers will upgrade to the $199/month Business plan within six months. You also predict the new feature will help your sales team close 20 new Business plan deals they would have otherwise lost.
- Expansion Revenue: 100 customers x 100/month increase x 12 months = 120,000
- New Revenue: 20 customers x 199/month x 12 months = 47,760
- Total Estimated Gain: $167,760
The ROI Calculation: (167,760 - 80,000) / $80,000 = 109.7%
Suddenly, that "nice-to-have" feature has a clear financial justification. It's not just a product improvement; it’s a measurable growth driver.
Justifying a Critical Bug Fix
Not every high-impact project adds new revenue. Sometimes, the best returns come from plugging holes that are actively sinking the ship. Calculating the ROI for a bug fix is all about quantifying the cost of doing nothing.
Imagine a nasty bug is corrupting user data. It’s driving up support tickets and starting to poison your reputation. This isn't a quick patch—it requires a major refactor of a core service.
- Total Estimated Cost: $45,000 (One senior engineer dedicated for two months)
To figure out the "gain," you have to look at the pain it's causing. Right now, the bug is responsible for 50 high-priority support tickets a month, and your team’s average cost to resolve a ticket is 75. Even worse, you've traced five churned accounts last quarter directly to this bug. Each of those accounts had an average lifetime value (LTV) of ****5,000.
Here's how the benefit side of the equation comes together:
- Reduced Support Costs: 50 tickets/month x 75/ticket x 12 months = 45,000
- Prevented Churn: You conservatively estimate that fixing the bug will save at least 10 similar accounts from churning in the next year. 10 accounts x 5,000 LTV = 50,000
- Total Estimated Gain: $95,000
The ROI Calculation: (95,000 - 45,000) / $45,000 = 111.1%
This calculation completely reframes the conversation. It’s no longer a thankless maintenance task; it's a strategic investment in customer retention and operational health.
Mapping a Churn Reduction Initiative
Next, let's look at a proactive project to reduce churn. Your data shows a clear pattern: customers who don't complete your onboarding checklist in their first week are 3x more likely to cancel. You want to build a series of in-app guides to fix this.
- Total Estimated Cost: $30,000 (A mix of engineering, design, and content work)
Your goal is to lower monthly churn by a seemingly small 0.2%. But for a company with 500,000 in monthly recurring revenue (MRR), that 0.2% means saving ****1,000 in MRR every single month.
- Annualized Saved Revenue: At first glance, it's 1,000/month x 12 = 12,000 saved in year one.
- The Compounding Impact: But that's not the whole story. The benefit compounds. The customers you save in month one are still paying in month two, and so on. A more accurate calculation shows the true gain is closer to $78,000 in retained revenue over 12 months.
The ROI Calculation: (78,000 - 30,000) / $30,000 = 160%
Assessing a Strategic Expansion
Finally, let's think bigger. What about a major strategic move, like launching a mobile app to complement your web platform? This is a significant bet aimed at capturing a new audience and boosting engagement with your power users.
Product School's ROI calculator provides a classic example: a SaaS team is weighing a 150,000 investment in a new mobile app. Their research projects it will bring in ****600,000 in new subscriptions and upsells within the first year alone. When you plug those numbers into the formula—(Expected Profit – Estimated Cost) / Estimated Cost × 100—you get a massive 200% ROI. For growth teams, this kind of analysis transforms gut feelings into a data-backed roadmap.
If you're looking for more ways to frame these calculations, it's worth checking out a practical guide to calculating ROI for marketing. While the examples are marketing-focused, the core principles of assigning value to costs and benefits are universal and might give you some fresh ideas for your own projects. Each of these scenarios shows how a good ROI template can bring financial clarity to almost any decision, giving you the confidence to build the right things.
Moving Beyond Basic ROI Calculations
A single ROI percentage is a powerful headline, but it’s just the start of the conversation. Experienced stakeholders and finance teams know better than to take one number at face value. They’re going to immediately pressure-test your assumptions, knowing that a single optimistic projection can make a bad investment look like a sure thing.
This is where you graduate from a simple calculation to a sophisticated financial forecast. By bringing in a few more advanced techniques, you can get ahead of those tough questions, show your financial diligence, and build a business case that’s ready for the real world—not just a best-case scenario.
Using Sensitivity Analysis to Prepare for Uncertainty
The first step in building a resilient forecast is running a sensitivity analysis. Think of it as a methodical way of asking, "What if we're wrong?" This technique helps you pinpoint which of your assumptions has the biggest impact on the final ROI.
Instead of locking into one outcome, you model a range of possibilities by tweaking your key variables. For CTOs and analysts, using a return on investment template with a built-in scenario engine is a game-changer. It forces you to check your optimism at the door by showing just how quickly a project’s financial picture can shift.
For example, a project might look great with a healthy Net Present Value (NPV) of 500,000 in your base case. But what happens in a downturn if a higher discount rate is applied? It could plummet to **-**20,000. To run this analysis properly, you'll want to create three versions of your forecast:
- Best-Case Scenario: What if adoption is 20% higher than we think and development wraps up two weeks early?
- Base-Case Scenario: This is your original, most likely forecast based on solid research.
- Worst-Case Scenario: What if it takes twice as long to build and customer adoption is only half of what we projected?
By modeling these outcomes, you aren’t admitting defeat before you start. You’re showing stakeholders that you’ve considered the risks and have a clear-eyed view of the potential volatility.
Calculating the Payback Period
While ROI tells you how profitable an investment will be, it doesn’t tell you when. That’s a job for the Payback Period. This metric calculates the exact time it will take for a project's returns to completely cover the initial investment.
A project with a fantastic 250% ROI might seem like a no-brainer, but it becomes much less attractive if it takes three years to break even. Another project with a 150% ROI that pays for itself in just six months could be the smarter choice, especially when cash flow is tight.
Calculating it is straightforward: just divide the total investment by the net cash flow generated per period (usually monthly or annually). So, for a 60,000 investment that’s projected to bring in ****5,000 in net profit each month, the payback period is 12 months. It’s a simple but absolutely essential piece of the financial puzzle.
Finding the Net Present Value
To get the most accurate picture of long-term profitability, you need to calculate the Net Present Value (NPV). It sounds complicated, but the core idea is simple: money today is worth more than the same amount of money in the future, thanks to inflation and the potential to earn interest on it.
NPV accounts for this by "discounting" all future cash flows back to their present-day value. It answers the critical question, "What is the total value of all future profits from this project, in today's dollars?"
A positive NPV means the project is expected to generate more value than it costs—a green light. A negative NPV suggests the project will actually lose money once you factor in the time value of money. Finance departments love this metric because it provides a much more sober and realistic view of a project's long-term financial health than ROI alone.
Choosing the Right Financial Metric
With several metrics at your disposal, how do you know which one to lead with? Each tells a different part of the story, so choosing the right one depends on what you need to emphasize. This table should help you decide.
| Metric | What It Measures | When to Use It |
|---|---|---|
| ROI | The overall profitability of an investment as a percentage. | For a powerful, high-level summary of efficiency. Great for comparing the relative profitability of different-sized projects. |
| Payback Period | The time required to recoup the initial investment. | When cash flow is a major concern or when you need to assess short-term risk. Essential for businesses with limited capital. |
| NPV | The total value of all future cash flows, discounted to their present value. | For a comprehensive look at long-term value creation. This is the gold standard for capital budgeting and a favorite of finance teams. |
Ultimately, a strong business case doesn't rely on a single number. By presenting ROI, Payback Period, and NPV together, you offer a multi-dimensional view that demonstrates thoroughness and builds confidence with your stakeholders.
Presenting Your ROI to Get Executive Buy-in

You’ve done the hard work. The analysis is complete, the numbers are crunched, and your return on investment template makes a solid case. But now comes the most critical part: turning that spreadsheet into a compelling story that convinces decision-makers to write the check.
Let's be honest, the most brilliant analysis is worthless if it can't get you the green light. This final step is an art. It's about clear communication and framing your project in a way that resonates. You can't just email a data-heavy report to your CEO and hope for the best. You have to shift the conversation from, "Here are the numbers," to, "Here’s how this project will solve a massive business problem and generate $250,000 in new revenue."
Tailor Your Narrative for Your Audience
Not everyone in the room cares about the same things. The CEO, CTO, and Head of Sales all want a positive ROI, but they see it through completely different lenses. A generic, one-size-fits-all pitch will fall flat. You have to customize your story for each person you're trying to win over.
- For the CEO: Keep it strategic and high-level. Connect your project directly to big-picture goals like market share, competitive advantage, and MRR growth. They care about the "why" and the ultimate financial outcome, not the implementation details.
- For the CTO: This is where you can get into the weeds of technical costs and resource allocation. Be ready to talk development timelines, infrastructure needs, and the opportunity cost of pulling engineers away from other initiatives. The CTO needs to see a realistic, well-scoped plan.
- For the Head of Sales/Marketing: Frame everything in terms of customer value and revenue impact. How will this new feature help close more deals? Does it solve a key pain point that causes prospects to churn? Back it up with direct quotes from customers to make their voices heard.
This targeted approach shows you've done your homework and respect each leader's unique priorities.
The Power of Visual Storytelling
Executives are busy. They don't have time to squint at dense tables and try to decipher your calculations. Your job is to make the data effortless to understand, and that means leaning on clean, simple visuals. A single, well-designed chart can make your case more effectively than a wall of text ever could.
Instead of showing a raw spreadsheet, create visuals that scream the key takeaways. Think simple bar charts comparing costs to projected revenue, a line graph illustrating the payback period, or a pie chart breaking down where the gains will come from. You want to guide their eyes straight to the most important conclusions. For more on this, check out our guide on the best practices for data visualization.
The most effective ROI presentations focus on the story behind the numbers. Frame the investment not as a cost, but as a strategic solution to a quantifiable business problem. Connect your project directly to a pain point the entire leadership team already cares about.
Build a One-Page Executive Summary
No matter how deep your full analysis goes, you absolutely need a punchy, one-page executive summary. This document is your secret weapon. It’s what gets forwarded in emails and passed around in meetings you aren’t even in. For a time-crunched executive, it might be the only thing they read.
Your summary has to be concise and hit these key points immediately:
- The Problem: One sentence summarizing the business pain you're solving.
- The Solution: One sentence describing your proposed project.
- The Investment: The total cost, stated clearly and simply.
- The Return: The headline number—ROI percentage, projected revenue, or cost savings.
- The Timeline: Key milestones, including the all-important payback period.
This forces you to boil your argument down to its core, creating a powerful anchor for your entire presentation.
Defend Your Assumptions with Confidence
As soon as you present your numbers, prepare for questions. Stakeholders are going to poke and prod at your assumptions—and that’s a good thing! It means they’re engaged. The key is to be ready. Have an appendix with all your data sources, industry benchmarks, and customer feedback that support your projections.
When someone challenges an assumption, don’t get defensive. Calmly walk them through your logic. Explain how you arrived at your numbers and what data you used to back them up. Acknowledge the uncertainties and show that you’ve already run a sensitivity analysis for best-case and worst-case scenarios. This transparency builds incredible credibility.
Many companies, for instance, use a 2x2 matrix to plot effort versus impact. In the SaaS world, where median feature ROIs can hit 120%, this helps prioritize the highest-return projects. These frameworks are often built on solid benchmarks, like Canva's projection of a 347% three-year ROI for its creative tools. Showing this level of diligence transforms your pitch from a simple request into a well-researched strategic recommendation.
Answering the Tough SaaS ROI Questions
Even with a solid return on investment template in your back pocket, you're bound to run into some tricky questions. Let's be honest, the fast-paced world of SaaS means not every benefit fits perfectly into a spreadsheet cell. Getting ahead of these common hurdles is the key to building a business case that actually holds up under pressure.
When you can anticipate the curveball questions, it shows you've thought beyond the basic formula. It proves you understand the business on a deeper level and builds serious confidence in your final recommendation.
How Do I Calculate ROI for Intangible Benefits?
This is the classic head-scratcher. How do you put a price tag on something like a stronger brand reputation or a boost in team morale? You can't calculate it directly, but you can use proxy metrics to translate those fuzzy benefits into something more concrete.
Take brand perception, for example. A great place to start is your Net Promoter Score (NPS). You can track how NPS changes after a project goes live and then look for correlations between that score and actual customer behavior.
- Tie it to Churn: Have you noticed that a 10-point jump in NPS historically leads to a 2% drop in churn? If you can draw that line, you can calculate the revenue saved based on the lifetime value of the customers you kept.
- Just Ask: Sometimes the most direct route is best. A simple customer survey can ask how a recent improvement might affect their decision to renew, or what a new feature is really worth to their daily workflow.
The whole point is to anchor that intangible benefit to a real-world business metric, even if it takes a thoughtful assumption to get there.
What Is a Good ROI for a SaaS Project?
There's no single magic number. The "right" ROI really depends on your company's stage, your industry, and how much risk everyone is comfortable with. That said, having some general benchmarks helps frame the conversation.
Most SaaS companies I've worked with aim for a minimum 3:1 ROI (or 200%) for new projects. This ensures the initiative is a better use of resources than other potential investments.
Of course, for critical infrastructure upgrades or must-have compliance work, the ROI might be lower—or it might be framed around avoiding costs rather than generating new profit. On the flip side, for ambitious, high-growth features, you might see teams shooting for an ROI of 5:1 or even higher. Your best bet is to look at past projects to set your own internal benchmarks.
How Often Should I Revisit an ROI Analysis?
An ROI calculation isn't a one-and-done deal. For any major project, you should treat your initial analysis as a living document. It's smart to check back in on your projections at key moments.
A good rule of thumb is to revisit your ROI analysis post-launch, again at the 3-month mark, and once more at 6 months. This lets you stack your forecast up against reality, which is gold for making your next business case even sharper.
This regular check-in helps you pivot if things aren't going to plan and creates a powerful feedback loop for your entire product development cycle. It’s how you get better at this over time.
I see this scenario play out all the time. A customer success leader at a scaling tech firm sees support tickets piling up and wonders if a $50,000 investment in a new tool is really worth it. A well-built template can quickly show a 100% ROI in the first year alone, with the investment paying for itself by month seven. Seeing clear numbers like these can make a difficult choice feel obvious, a process you can explore with free ROI templates detailed at Smartsheet.com. It transforms a gut feeling into a confident, data-backed decision.
By turning qualitative feedback into actionable, revenue-driving insights, SigOS helps product teams cut churn, find expansion opportunities, and build features customers will actually pay for. Learn how SigOS can quantify the dollar value of your development efforts.
Keep Reading
More insights from our blog


Ready to find your hidden revenue leaks?
Start analyzing your customer feedback and discover insights that drive revenue.
Start Free Trial →