Mastering Your Revenue Prediction Model: A Guide for SaaS
Build a reliable revenue prediction model for SaaS. Covers data, ML, metrics, and product intelligence for better accuracy.

The meeting usually starts with confidence. Sales has a number. Finance has a different one. Product has already staffed against the higher forecast. Then the questions begin. Why are late-stage deals slipping? Why did expansion come in softer than expected? Why did churn spike in a customer segment that looked healthy a month ago?
That's the moment a revenue prediction model stops being a reporting exercise and becomes a management system. In SaaS, a weak forecast doesn't just create an awkward board slide. It distorts hiring, roadmap decisions, support coverage, infrastructure planning, and cash discipline.
What Is a Revenue Prediction Model
A revenue prediction model is a structured way to estimate future revenue using the signals your business already produces. It combines historical performance, current pipeline, recurring revenue behavior, and operating context to produce a forecast that leadership can use.

The key word is estimate. Good models don't pretend to predict the future with certainty. They produce a disciplined view of likely outcomes, and they make the assumptions visible enough that teams can challenge them.
Why leadership teams need one
A team's primary challenge often isn't technology; it's decision-making. They need to know whether to hire ahead of demand, slow spend, shift focus to expansion, or protect retention. A forecast that arrives late or hides uncertainty is almost as bad as no forecast.
The challenge is bigger than many teams expect. Only 7% of sales organizations consistently achieve forecast accuracy above 90%, while the median accuracy sits between 70% and 79% according to MarketsandMarkets' analysis of revenue intelligence and traditional sales forecasting.
A forecast is useful when it changes decisions before the quarter is over, not when it explains misses after the quarter closes.
What the model actually does
In practice, a revenue prediction model acts like a control tower. It takes in signals from several systems and turns them into one operational view.
That usually includes:
- Historical revenue patterns: Recurring trends, seasonality, and baseline growth.
- Pipeline movement: Deal stage changes, deal age, slippage, and close timing.
- Customer account behavior: Renewals, contractions, expansion potential, and churn risk.
- Business context: Product adoption, support friction, and other signals that explain why numbers are changing.
Teams building this from scratch often benefit from a practical modeling primer such as NILG.AI's guide on predictive models, especially if they need to align executives around what a model can and can't do.
A strong model doesn't replace judgment. It sharpens it. The point isn't to produce one sacred number. The point is to give product, finance, and go-to-market leaders a clearer map of what's likely, what's fragile, and what needs intervention now.
Key Data Sources and Feature Engineering
If the model is the dish, the data is the kitchen. Most failed forecasting efforts don't fail because the algorithm was weak. They fail because the inputs were inconsistent, stale, or too narrow.
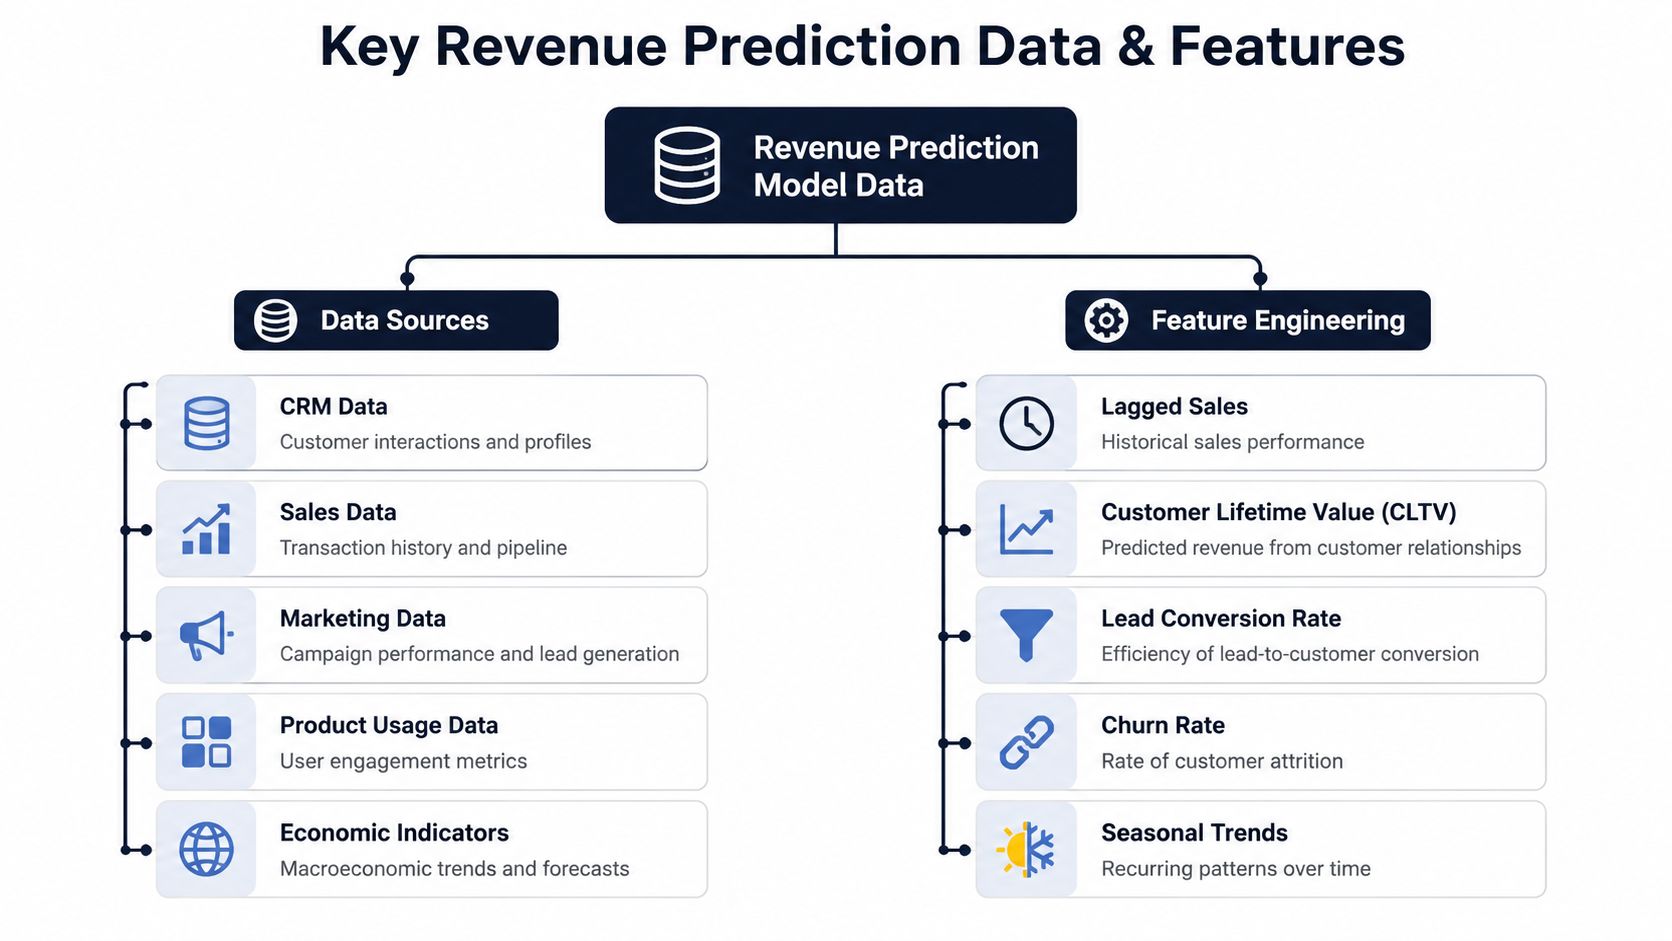
Start with the raw ingredients
A practical revenue prediction model usually pulls from four buckets.
- CRM data: Opportunity stage, pipeline value, rep ownership, close dates, and activity history.
- Billing and financial systems: ARR, MRR, renewals, invoices, churn events, contractions, and expansion revenue.
- Product usage data: Login frequency, feature adoption, seat utilization, support utilization, and account-level engagement shifts.
- Customer communication data: Support tickets, chat transcripts, call notes, bug reports, and feature requests.
Generally, the first two are handled. Fewer treat product and support signals as forecast inputs. That's a mistake, especially in SaaS where churn and expansion are often visible in behavior before they appear in bookings.
Research highlighted by the University of Rochester project found that advanced revenue prediction models can achieve correlation accuracy rates exceeding 87% when trained on continuous behavioral data, including support tickets and usage metrics in this deep learning revenue forecasting work.
Turn messy inputs into usable features
Raw data rarely helps a model on its own. Feature engineering is the preparation step. In kitchen terms, this is the mise en place. You don't throw whole vegetables into the pan and hope for precision. You clean, cut, sort, and label everything first.
That means transforming raw fields into signals the model can learn from, such as:
- Deal momentum: Time in stage, number of stage reversals, and close date pushes.
- Customer health patterns: Drop in usage, repeated support escalations, or declining engagement breadth.
- Expansion readiness: Requests for advanced functionality, multi-team adoption, or sustained high-value usage.
- Retention pressure: Severity of unresolved bugs, repeated complaints, or feature gaps tied to strategic accounts.
For teams tightening their preprocessing workflows, Zilo AI's ML data guide is a useful reference on cleaning and preparing model-ready inputs.
Practical rule: If sales, finance, and product define the same field differently, the model will learn noise.
Behavioral signals are usually the missing feature set
Many forecasting stacks stay too shallow. They capture what happened in the CRM but miss what customers were trying to tell the company before the number moved.
Examples of high-value engineered features include:
- Support intensity by account: Not just ticket count, but recurrence, severity, and topic concentration.
- Revenue at risk from product issues: Accounts affected by the same bug or degraded workflow.
- Expansion intent from customer language: Feature requests tied to larger deployments or broader rollout patterns.
- Trust erosion signals: Repeated unresolved complaints from active but frustrated customers.
If your source systems are full of duplicates, missing timestamps, and conflicting definitions, fix that first. Problems like these show up quickly when teams audit common data quality issues in operational systems.
A simple rule holds up across every forecasting stack I've seen: the model can only be as good as the behavior your systems capture and the discipline used to convert that behavior into features.
Comparing Revenue Modeling Approaches
A leadership team usually asks the same question in three different ways: What will we close, how much of the base is at risk, and where should we intervene now? One modeling approach rarely answers all three well. The choice depends on how your revenue is created and how much signal exists outside the CRM.
The main families of models
Traditional statistical models include linear regression, cohort-based forecasting, and weighted pipeline rollups. They are useful when the revenue engine is stable, definitions are tight, and the main requirement is interpretability. They struggle when conversion depends on combinations of factors such as product adoption, support friction, pricing changes, and deal-specific context.
Time-series models treat revenue as a pattern over time. They work well for recurring revenue baselines, seasonality, and trend shifts in mature subscription businesses. They are less useful when the next quarter will be shaped by events the historical series cannot see, such as a major product issue, sudden usage drop in strategic accounts, or a concentrated renewal cohort with uneven health.
Machine learning and hybrid models handle that messier reality better. They can combine opportunity data, account history, support patterns, usage behavior, and qualitative customer signals. That added flexibility comes with a cost. Teams need cleaner definitions, tighter monitoring, and a clear process for deciding when a model output should trigger action.
Why hybrid usually wins in B2B SaaS
In practice, strong B2B SaaS forecasting usually looks like a layered system, not a single model trying to do everything.
A common setup uses one method for committed recurring revenue, another for new pipeline, and a separate risk adjustment for churn and expansion. That structure matches how finance and GTM teams already think about the business. It also reduces a common failure mode, where one model averages away meaningful differences between renewals, new logos, and account growth.
Significant improvement comes when those churn and expansion adjustments include behavioral evidence from the product and customer interaction layer. CRM fields tell you what stage an account is in. Product intelligence helps explain whether the account is getting healthier, stalling, or approaching contraction. Teams building that layer often borrow ideas from a predictive churn model framework because the same account-level risk signals improve revenue forecasts.
Comparison of revenue prediction model approaches
| Approach | Complexity | Typical Accuracy | Best For |
|---|---|---|---|
| Traditional statistical models | Low to moderate | Reliable for simpler revenue patterns and easier to explain | Stable businesses, baseline planning, highly interpretable forecasts |
| Time-series models | Moderate | Strong when recurring patterns and seasonality hold | Subscription baselines, recurring revenue trend detection, mature businesses |
| Hybrid B2B SaaS models | Higher | Usually stronger than single-method forecasts when revenue comes from multiple motions | SaaS businesses balancing renewals, pipeline, expansion, and churn |
| Machine learning models | Higher | Highly dependent on feature quality, governance, and ongoing maintenance | Complex environments with rich CRM, product, support, and behavioral data |
What works and what breaks
Weighted pipeline models are fine for directional planning. They break quickly when stage hygiene is weak or two reps use the same stage to mean different things.
Time-series models give finance a usable baseline. They miss turning points when a handful of accounts drive a large share of risk or upside.
Machine learning earns its keep when it captures signals that operators already know matter but cannot quantify consistently. Support escalation clusters, declining feature adoption before renewal, and repeated requests tied to rollout delays often explain revenue movement earlier than closed-won and closed-lost labels do. That is the practical gap product intelligence platforms fill, and it is why teams exploring AI capabilities for modern web development are also looking more closely at behavioral data infrastructure and model-ready event streams.
The best model is the one that mirrors the mechanics of your revenue engine and gives teams enough lead time to act.
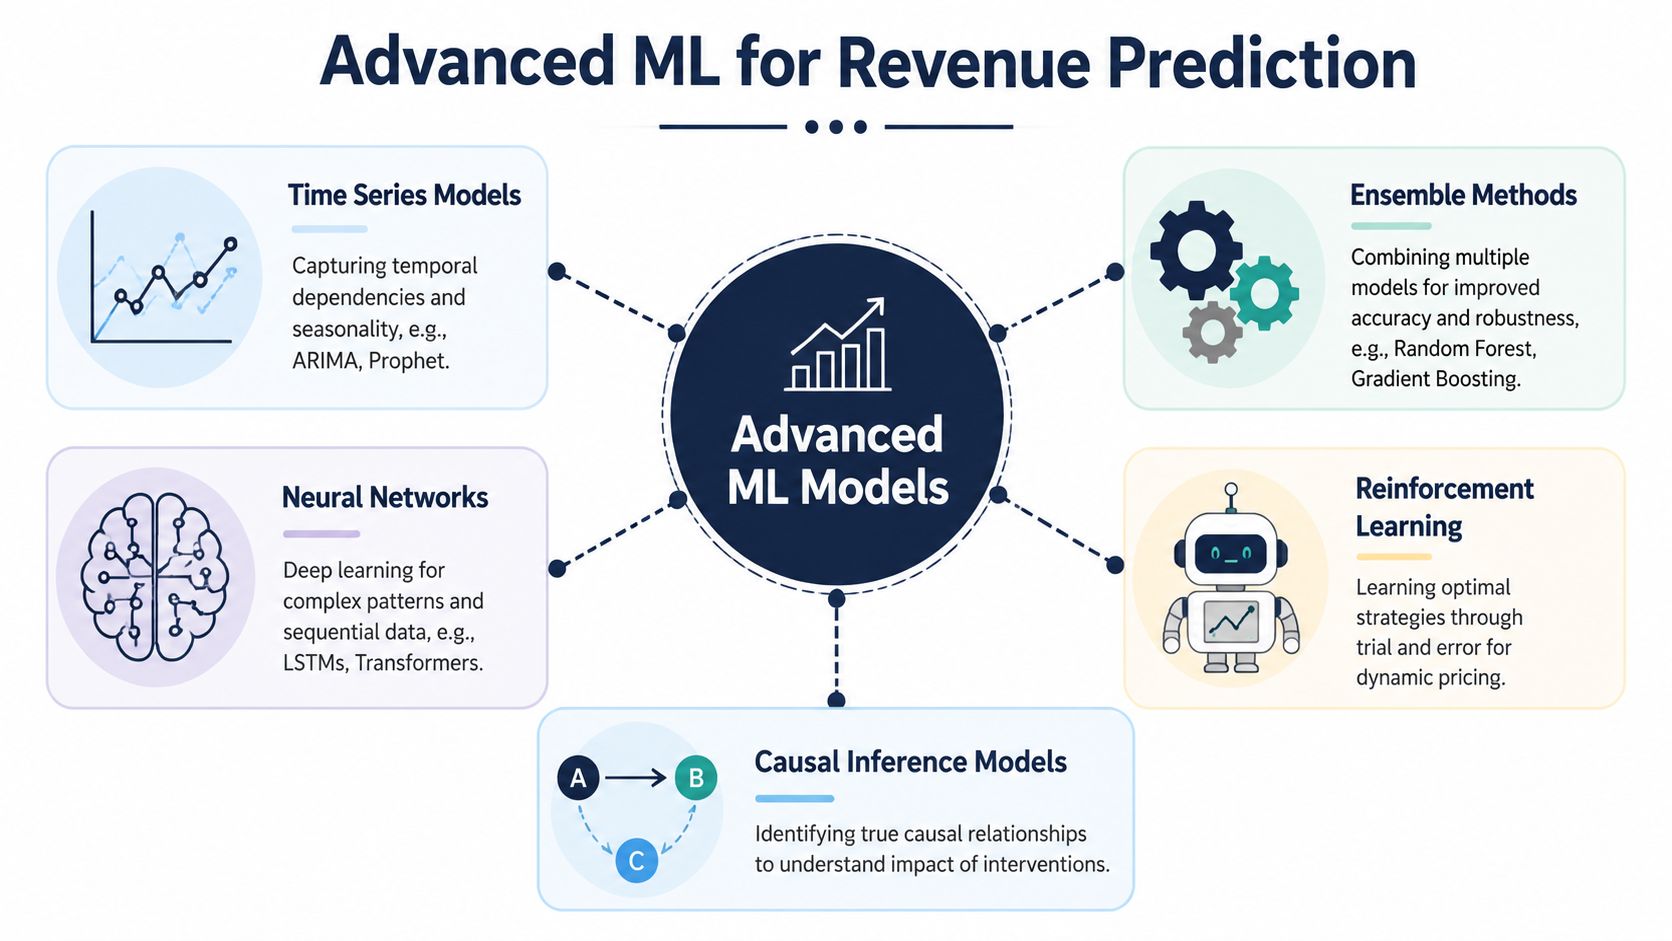
Advanced Machine Learning Techniques
Once the foundations are solid, advanced machine learning can answer questions that simpler models can't. This matters when leadership wants more than a quarter-end estimate. They want to know where risk is building, which accounts are likely to expand, and when intervention has the highest payoff.
Churn-informed forecasting
Most forecasts treat churn as a percentage adjustment at the end. That's too blunt. Advanced models use churn-informed methods to estimate not only whether an account is at risk, but also when the risk is likely to materialize.
That timing matters. An account showing early signs of instability is different from an account that is already exhibiting pre-renewal failure patterns. Product leaders can prioritize fixes differently. Customer success can intervene earlier. Finance gets a forecast that reflects timing rather than generic attrition assumptions.
If you want a practical complement to that idea, this guide to predictive churn models is a helpful framework for thinking about account-level risk signals.
Deep learning for messy SaaS behavior
Deep learning becomes useful when relationships between variables are non-linear and change over time. A model like linear regression assumes fairly stable relationships. SaaS rarely behaves that neatly. Usage, support pressure, feature adoption, and renewal outcomes can interact in ways that shift by segment, product line, or customer maturity.
Time-series deep learning models such as LSTM or Transformer-based approaches are designed for that kind of pattern recognition. They can absorb sequences of account behavior and identify combinations that often precede churn, contraction, or expansion.
There's a business case for the added complexity. AI-driven multivariable analysis forecasting approaches typically improve revenue prediction accuracy by 20% to 30% compared to traditional statistical methods, achieving a typical accuracy range of 75% to 90%, according to Forecastio's analysis of forecasting accuracy and review cadence.
Where advanced ML earns its keep
These approaches are most useful when your team needs to answer questions like:
- Which accounts look healthy in the CRM but show behavioral risk in product and support data?
- Which expansion candidates are emerging before an AE formally opens an opportunity?
- Which forecast assumptions are unstable when pricing, demand, or retention shifts?
Modern engineering teams also care about how these models are operationalized in production systems. That's one reason product leaders increasingly pay attention to broader AI capabilities for modern web development, not just model accuracy in isolation.
Advanced ML isn't magic. It's pattern compression. It helps the business spot weak signals earlier than a human spreadsheet process can.
Integrating Product Intelligence into Your Forecasts
Most revenue forecasts still rely on CRM fields, pipeline stages, and historical bookings. That's useful, but incomplete. It tells you what the organization recorded. It often misses what customers are experiencing right now.
That's why product intelligence matters. Pipeline data is rearview-mirror information. Behavioral signals are the windshield.
The signals most forecasts ignore
A forecast gets stronger when it includes structured representations of customer friction and intent. In SaaS, those signals often live outside the CRM:
- Support tickets that cluster around a broken workflow
- Chat transcripts showing repeated deployment blockers
- Sales call notes tied to missing enterprise features
- Usage patterns that suggest broadening adoption or quiet disengagement
These aren't soft anecdotes. They're inputs that can be converted into features and attached to accounts, segments, or products.
The operational gap is widely recognized. As described in Acuvate's discussion of ML revenue forecasting and behavioral analytics, top-performing SaaS firms are adopting behavioral analytics to predict churn and expansion, and product managers using tools like SigOS see 87% correlation between these behavioral patterns and revenue impact. The practical problem is that most forecasting guides still don't explain how to turn that into a usable model pipeline.
How to operationalize behavioral data
The trick is to stop treating qualitative inputs as free text and start treating them as structured business events.
A useful pattern looks like this:
- Map events to accounts: Connect tickets, calls, and usage anomalies to the account or opportunity level.
- Classify the signal: Is this a bug, adoption blocker, pricing objection, feature request, or reliability concern?
- Estimate business direction: Does it indicate churn risk, delayed expansion, blocked conversion, or stronger expansion potential?
- Create model features: Turn those observations into variables the forecast can consume.
That can produce features such as:
- Accounts affected by a recurring issue
- Opportunities linked to a requested capability
- Support burden concentration by segment
- Behavioral patterns associated with expansion readiness
This is the core advantage. Instead of saying, “customers seem unhappy,” the model receives a measurable signal tied to specific revenue outcomes.
A short walkthrough helps make that concrete:
Why product leaders should care
When forecasts ignore product intelligence, the business systematically underestimates the revenue impact of bugs, missing features, and unresolved friction. Product then gets framed as a cost center rather than a revenue lever.
When forecasts include product intelligence, leadership can answer better questions:
Which unresolved issue is putting renewals at risk right now, and which requested feature is most likely to unlock expansion?
That changes roadmap conversations. It also changes who gets invited into forecast reviews. Product, support, and success stop being downstream consumers of the number. They become contributors to how the number is formed.
How to Measure Model Success and Avoid Pitfalls
A forecast misses the quarter by 12 percent. Finance sees a modeling problem. Sales says execution slipped. Product points to a bug that stalled expansions for a high-value segment. All three can be right, which is why model evaluation has to go beyond a single accuracy number.
A useful revenue prediction model does two jobs. It gets close enough to support planning, and it fails in ways the business can diagnose. If leadership cannot tell whether an error came from pipeline quality, pricing changes, or product friction, the model is not doing enough.
Use metrics that match decisions
Start with forecast accuracy:
Forecast Accuracy = 1 - (|Forecast - Actual| / Actual) × 100
That metric is easy to explain, which matters in executive reviews. It should not be the only measure. A model can post a decent top-line result while missing the accounts, segments, or product lines that matter most.
MAPE, or Mean Absolute Percentage Error, is also common because it shows average percentage miss across predictions. It helps compare model versions over time, especially when revenue scales up or down across periods. Use it carefully when actual revenue is very small, because percentage errors can look worse than the business impact really is.
A practical scorecard usually includes:
- Headline forecast accuracy: Useful for board and executive planning.
- Segment-level accuracy: Shows whether the model is weak in SMB, enterprise, renewals, or a product line.
- Weighted error: Gives more importance to large accounts and major revenue events.
- Calibration by risk band: Checks whether accounts labeled high risk or high upside do behave that way.
For teams building reporting around those measures, good dashboards should explain decisions, not just display model math. A strong example is a metrics and reporting framework for operational visibility.
One more test matters. Compare the model against a simple baseline, such as last-quarter roll-forward, stage-weighted pipeline, or a finance rules model. If the machine learning system cannot beat a simpler alternative consistently, it is adding complexity without adding value.
Common mistakes that reduce forecast reliability
The most expensive mistake is optimizing for precision that the business cannot support. In thin data environments, narrow slices often produce confident-looking outputs built on noise. The model appears smart in development and becomes erratic in live use.
The Revenue Operations Alliance's discussion of forecasting challenges and solutions makes a similar point. Very high statistical accuracy can be unrealistic in volatile, low-volume settings, especially when a few deals can swing the quarter.
These are the failure patterns I see most often:
- Modeling at too fine a grain: Rep-level or micro-segment forecasts can collapse when there are too few comparable examples.
- Ignoring lumpy revenue events: Large expansions, delayed renewals, and one-off enterprise deals break assumptions that work for steadier flows.
- Overfitting to historical patterns: The model learns yesterday's sales motion, then misses changes in packaging, pricing, or product adoption.
- Treating source systems as clean by default: Duplicates, stale stages, missing product usage events, and inconsistent account mapping can skew results.
- Judging success only on aggregate accuracy: A model can look acceptable overall while systematically undercalling churn risk or overstating expansion likelihood in key accounts.
Qualitative and behavioral inputs create a second pitfall. Teams add product intelligence signals, then stop short of validating whether those signals improve forecast quality or just add noise. A spike in support tickets, feature requests, or usage drops can be meaningful. It can also reflect onboarding, a known release issue, or one unusually vocal customer cohort. Those signals need outcome testing, not intuition.
The fix is disciplined evaluation. Check whether product-intelligence features improve segment accuracy, earlier risk detection, or prediction stability across cycles. If they do, keep them. If they do not, revise the feature definition or remove them.
In practice, the best models are rarely the most complicated. They are the ones the business can audit, stress-test, and update when reality changes.
Best Practices for Deployment and Monitoring
The hard part isn't building the first model. The hard part is keeping it relevant after the business changes.
Put the model into production like an operating system
A revenue prediction model should run on a clear cadence. Forecast generation, actuals reconciliation, feature refresh, and model review need named owners. Without that, the forecast turns into a one-off analytics artifact that no one maintains.
A workable deployment checklist looks like this:
- Define ownership: Finance, RevOps, data, product, and success each need clear responsibilities.
- Set review cadence: Monthly or quarterly reviews are essential for spotting drift and correcting assumptions, as noted in the Forecastio source cited earlier.
- Monitor input health: Track schema changes, missing values, delayed syncs, and broken joins across CRM, billing, and product systems.
- Compare forecast versus actual: Every cycle should feed back into model refinement.
- Protect sensitive data: Behavioral and support data often contains customer-sensitive information, so access control and privacy discipline matter from day one.
Expect drift and plan for it
No forecast stays good automatically. Pricing changes. Sales motions shift. Products mature. Customer behavior changes. The model has to be retrained and revalidated often enough to reflect the business you have now, not the one you had two quarters ago.
Teams that do this well treat forecasting as a living system. They don't ask whether the model is finished. They ask whether it's still aligned with reality.
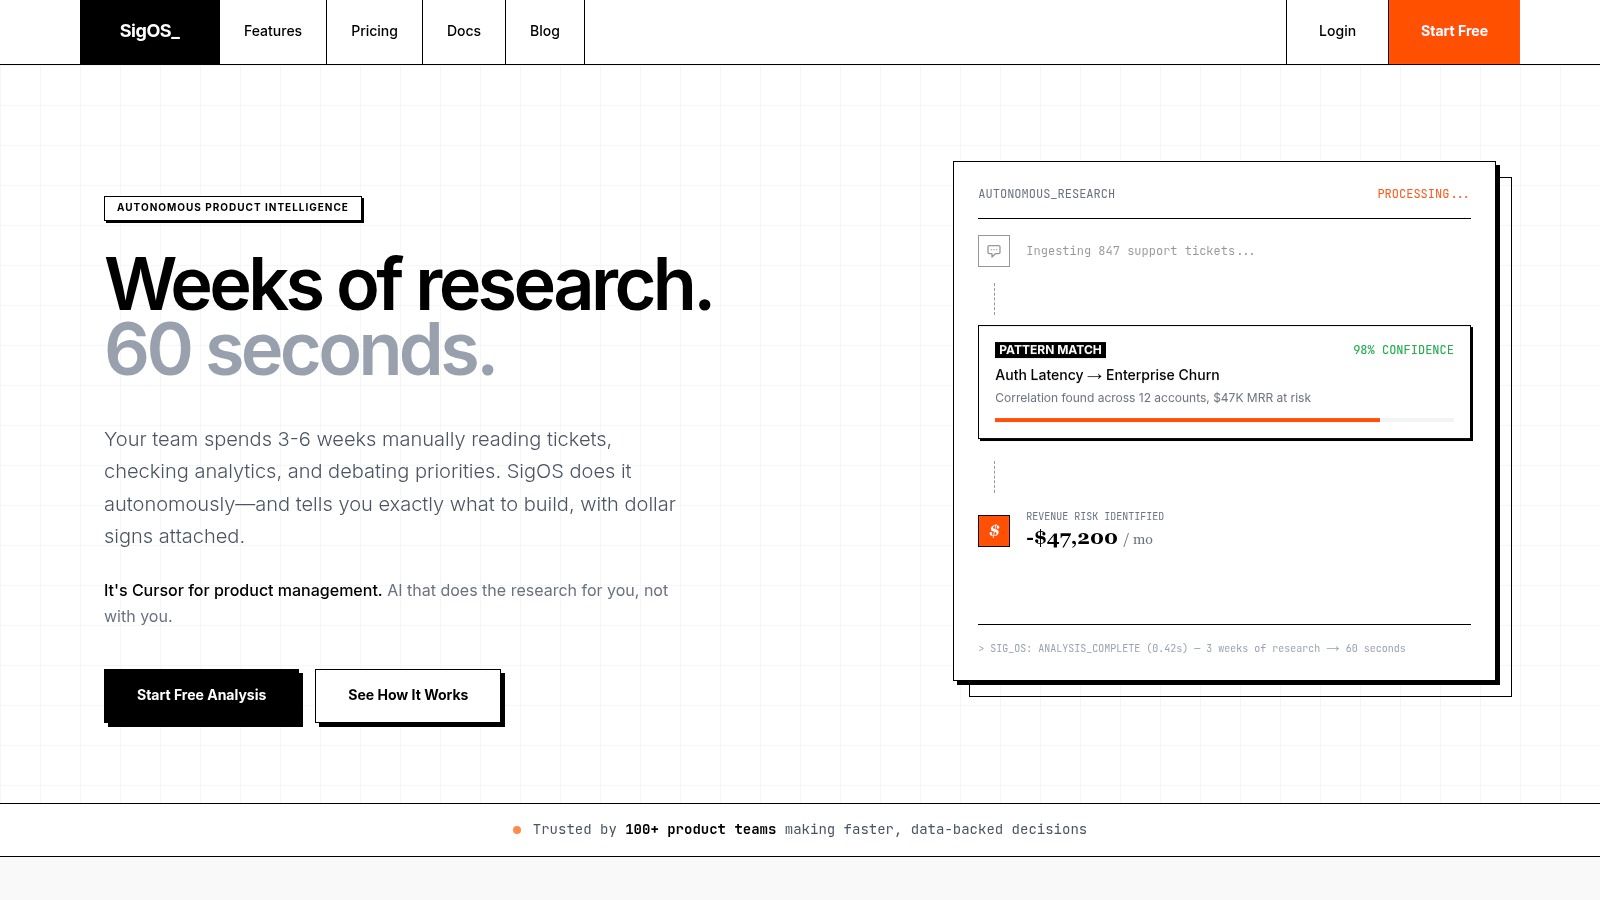
If your team wants to move beyond pipeline-only forecasting and quantify how support issues, product usage, and customer behavior affect churn, expansion, and revenue risk, SigOS is worth a look. It helps product and growth teams turn noisy behavioral data into structured revenue signals that can strengthen forecasting and prioritization.
Keep Reading
More insights from our blog


Ready to find your hidden revenue leaks?
Start analyzing your customer feedback and discover insights that drive revenue.
Start Free Trial →