SaaS Churn Rate Benchmarks You Need to Know
Explore current SaaS churn rate benchmarks. Learn what a good churn rate is, how to calculate it, and proven strategies to improve customer retention.

So, what's a "good" churn rate for a SaaS company? The classic benchmark you'll hear tossed around is 5-7% annually. But honestly, that number is almost meaningless without context.
The reality is, churn looks wildly different depending on who you're selling to. If your customers are small businesses, you might see a **3-7% churn rate **every month. If you’re selling to massive enterprise clients, you should be aiming for less than 1% monthly.
What Is a Good SaaS Churn Rate?

Think of your business like a bucket you're trying to fill with water. Every new customer is more water you're pouring in. Churn is the hole in the bottom of that bucket. A tiny leak? Manageable. A gaping hole? You'll never fill the bucket, no matter how hard you work to bring in new business.
That's why understanding SaaS churn rate benchmarks isn't just a financial exercise—it's a critical health check for your company.
To get the full story, you have to realize that not all churn is the same. You absolutely must track two distinct types to see what's really happening.
- Customer Churn (Logo Churn): This is the straightforward one. It’s simply the percentage of customers who cancel their subscriptions over a certain period. This tells you how many customers you’re losing.
- Revenue Churn (MRR Churn): This one gets to the heart of the financial impact. It measures the percentage of monthly recurring revenue (MRR) you lose from those cancellations. This tells you how much money is walking out the door.
Imagine losing ten small clients who each pay you 50 a month. Now imagine losing one enterprise client who pays you 10,000 a month. In the first case, your customer churn is high, but the MRR hit is only 500. In the second, your customer churn is tiny (just one logo!), but your revenue churn is a painful 10,000. You need to track both to make smart decisions.
Quick Guide to SaaS Churn Rate Benchmarks
So, what numbers should you actually be aiming for? While that 5-7% annual figure is a decent north star, your immediate targets depend entirely on your market. Things like price sensitivity, contract length, and how "sticky" your product is all create different standards for different segments.
The table below offers a quick look at acceptable monthly and annual churn rates, broken down by the typical customer base.
| Company Stage / Customer Type | Acceptable Monthly Churn Rate | Acceptable Annual Churn Rate |
|---|---|---|
| Early-Stage Startups | 3% - 5% | 31% - 46% |
| SMB-Focused SaaS | 3% - 7% | 31% - 58% |
| Mid-Market SaaS | 1% - 2% | 11% - 22% |
| Enterprise SaaS | < 1% | < 12% |
Use these SaaS churn rate benchmarks as a starting point. If your numbers are consistently higher than these ranges, it’s a bright red warning light. That’s your signal to start digging into why customers are leaving and, more importantly, what you can do to convince them to stay.
So, What's a "Normal" Churn Rate Anyway?

While aiming for zero churn is a nice thought, the real world of SaaS is a lot messier. That’s why it’s so helpful to understand the average churn rates across the industry. This gives you a realistic baseline to see how you stack up against the competition. These averages aren't just numbers on a spreadsheet; they're the result of millions of customer decisions and business strategies playing out in real-time.
The good news is, things have been looking up. The average monthly churn for B2B SaaS companies has settled around 3.5% as of 2025, which is a massive improvement from the 7.5% peak we saw back in late 2021. This tells us the industry as a whole is getting better at retention.
Still, that single number hides a ton of variation. A great rule of thumb is that an annual churn rate below 5% is considered a very strong benchmark—it's what most successful companies are shooting for. But to really understand what's going on behind these numbers, you need to break churn down into its two main flavors.
Voluntary vs. Involuntary Churn
Not all churn happens for the same reason. When a customer leaves, it’s either because they chose to or because something prevented them from staying. Knowing the difference is the first step to figuring out your own retention problems.
- Voluntary Churn: This is the one that probably comes to mind first. It’s when a customer actively decides to hit the "cancel" button. Maybe they're unhappy with the product, they found a cheaper competitor, or their business needs have simply changed.
- Involuntary Churn: This kind of churn is sneaky and often accidental. It happens when a customer disappears due to a technical hiccup, almost always a failed payment. Expired credit cards, declined transactions, or outdated billing info are the usual culprits.
Voluntary churn is a red flag about your product or customer experience. Involuntary churn, on the other hand, points to a leaky bucket in your billing and payment systems. You'd be surprised how much revenue slips through these cracks—involuntary churn can account for 20-40% of a company's total churn. That's a lot of lost revenue you could potentially get back.
How Your Target Market Changes Everything
The single biggest factor that shapes SaaS churn rate benchmarks is who you sell to. A generic industry average is practically useless because selling to tiny startups is a completely different ballgame than selling to Fortune 500 companies. Getting a handle on these key customer retention metrics is what separates good analysis from bad.
Enterprise SaaS Companies that land huge enterprise clients almost always have the lowest churn rates, often just 1% to 2% annually. It's not magic; it’s the business model.
- Long-Term Contracts: Enterprise deals are built on annual or multi-year contracts, which creates a huge barrier to leaving.
- Deep Integration: Their software gets woven into the very fabric of the client’s operations, making it a nightmare to rip out and replace.
- High Switching Costs: Just think about the cost of migrating data, retraining thousands of employees, and disrupting workflows. It's a massive headache.
SMB SaaS On the flip side, companies serving small and mid-sized businesses (SMBs) live with much higher churn. Annual rates between 3% and 5% are pretty common. The reasons are a mirror image of the enterprise world.
- Price Sensitivity: SMBs run on tighter budgets and are far more likely to jump ship if prices go up or a cheaper option appears.
- Lower Stickiness: The software might be a "nice-to-have" rather than a "can't-live-without," making it easier to drop.
- Shorter Contracts: Monthly plans are the norm, which means customers can walk away anytime with zero friction.
Because of this, comparing your SMB-focused startup to an enterprise giant like Salesforce is pointless. To get a real sense of how you're doing, you have to benchmark your numbers against companies that fish in the same pond as you do. Context is everything.
Why Do So Many SaaS Companies Miss Churn Benchmarks?
Knowing the ideal SaaS churn rate benchmarks is one thing. Actually hitting them? That’s a whole different ballgame. We all hear about the holy grail of less than 5% annual churn, but the reality is that a huge number of companies, especially those in the thick of growing, are nowhere near that number.
If you're looking at a double-digit churn rate and feeling a little discouraged, you're not alone. This gap between the ideal and the real world isn't a sign of failure. It's usually a reflection of the specific pressures and realities that hit smaller, growing businesses the hardest. The key isn't just to chase an abstract number, but to dig in and understand why your customers are leaving in the first place.
The Sobering Reality for Growing Companies
For businesses still finding their product-market fit or scaling up, high churn is often the default state, not a rare exception. A few key factors tend to converge, creating a perfect storm for customer attrition that makes those low single-digit benchmarks feel like a distant dream.
Research paints a pretty clear picture of this struggle. Somewhere around 60-70% of SaaS companies fail to reach that coveted sub-5% annual churn rate. And we're not talking about a near miss; for many, the gap is substantial. For instance, companies with less than $10 million in ARR often see a median churn rate of 20% annually. That's four times higher than the "healthy" benchmark.
This isn't just a startup problem—it's a small-to-mid-market problem. Early-stage businesses are often selling to customers with smaller budgets, less organizational stability, and lower switching costs. All of those factors make it easier for them to walk away. Some SaaS startups have even reported churn as high as 60%, which really highlights the intense pressure of those early growth phases. If you want to dig deeper into the data, you can explore more insights on SaaS churn benchmarks.
How Your Sales Model Feeds Your Churn Rate
Here’s something that often gets overlooked: how you get customers in the first place has a massive impact on whether they stick around. Your sales model directly shapes your churn rate because it defines the initial customer relationship and sets expectations from day one.
The data shows a clear link between how you sell and how well you retain. Different sales motions attract different kinds of customers and create entirely different onboarding experiences, which naturally leads to different churn profiles.
Here’s a quick breakdown of how common sales models tend to influence churn:
- Channel Sales: Relying on third-party partners and resellers often leads to the highest churn, around 17%. That indirect relationship can easily create a disconnect in customer education and support.
- Internet Sales: A self-serve or low-touch model typically sees churn hovering around 14%. It's fantastic for efficient customer acquisition, but it can lack the guided onboarding needed to make sure users really find value.
- Inside Sales: Remote sales teams see a similar churn rate of 14%. The big challenge here is building a strong rapport and truly understanding customer needs without ever meeting face-to-face.
- Field Sales: The traditional, high-touch approach of meeting clients in person wins out, resulting in the lowest churn at 11.8%. This model naturally fosters stronger relationships and deeper product understanding right from the start.
Getting a handle on these risk factors—from your company’s size to your sales strategy—is the first real step toward building a more resilient business. It helps normalize the struggle and shifts your focus from chasing an arbitrary number to methodically fixing the real reasons your customers are leaving.
How To Accurately Calculate And Analyze Your Churn
Knowing the industry SaaS churn rate benchmarks is one thing, but it’s completely useless if you can’t trust your own numbers. Getting your churn calculation right is the first step toward actually fixing the problem.
Garbage in, garbage out. If your calculations are off, you'll make bad decisions based on faulty data, potentially masking a serious revenue leak. Let's make sure you're using the right formulas and looking at your data from the right angles.
Customer Churn vs Revenue Churn Calculation
You need to track two core types of churn: customer churn (often called logo churn) and revenue churn (MRR churn). They tell you two very different, but equally important, stories about the health of your business. Looking at just one gives you a massive blind spot.
Here’s a quick breakdown of how they differ and what each one really tells you.
| Metric | Formula | What It Tells You | Common Pitfall |
|---|---|---|---|
| Customer (Logo) Churn | (Customers Lost / Total Customers at Start) x 100 | The percentage of customers who canceled. This is your high-level indicator of product-market fit and customer satisfaction. | Ignoring the value of lost customers. Losing 10 small accounts is very different from losing one enterprise client. |
| MRR (Revenue) Churn | (MRR Lost from Churned Customers / Total MRR at Start) x 100 | The percentage of monthly revenue lost from canceled accounts. This measures the direct financial impact on your bottom line. | Forgetting to include revenue lost from downgrades. A customer moving to a cheaper plan still represents revenue churn. |
It's clear why you need both. High logo churn but low MRR churn might just mean you’re shedding low-value, high-maintenance customers—which isn't always a bad thing. But the reverse? Low logo churn with high MRR churn is a five-alarm fire. It means your most valuable customers are walking out the door.
Avoiding The Common Calculation Traps
The formulas look simple, but it’s surprisingly easy to get them wrong. The most common mistake I see is including new customers you signed during the measurement period in your starting total. This bloats the denominator and makes your churn rate look artificially low.
Another big trap is failing to account for revenue changes from downgrades. When a customer switches to a cheaper plan, you haven't lost their logo, but you've absolutely lost monthly revenue. This revenue contraction needs to be tracked alongside outright cancellations to see the full financial picture. And, of course, a solid grasp of your customer retention rate calculation gives you the other side of the coin for a complete view.
This gap between perception and reality is often wider than founders think.
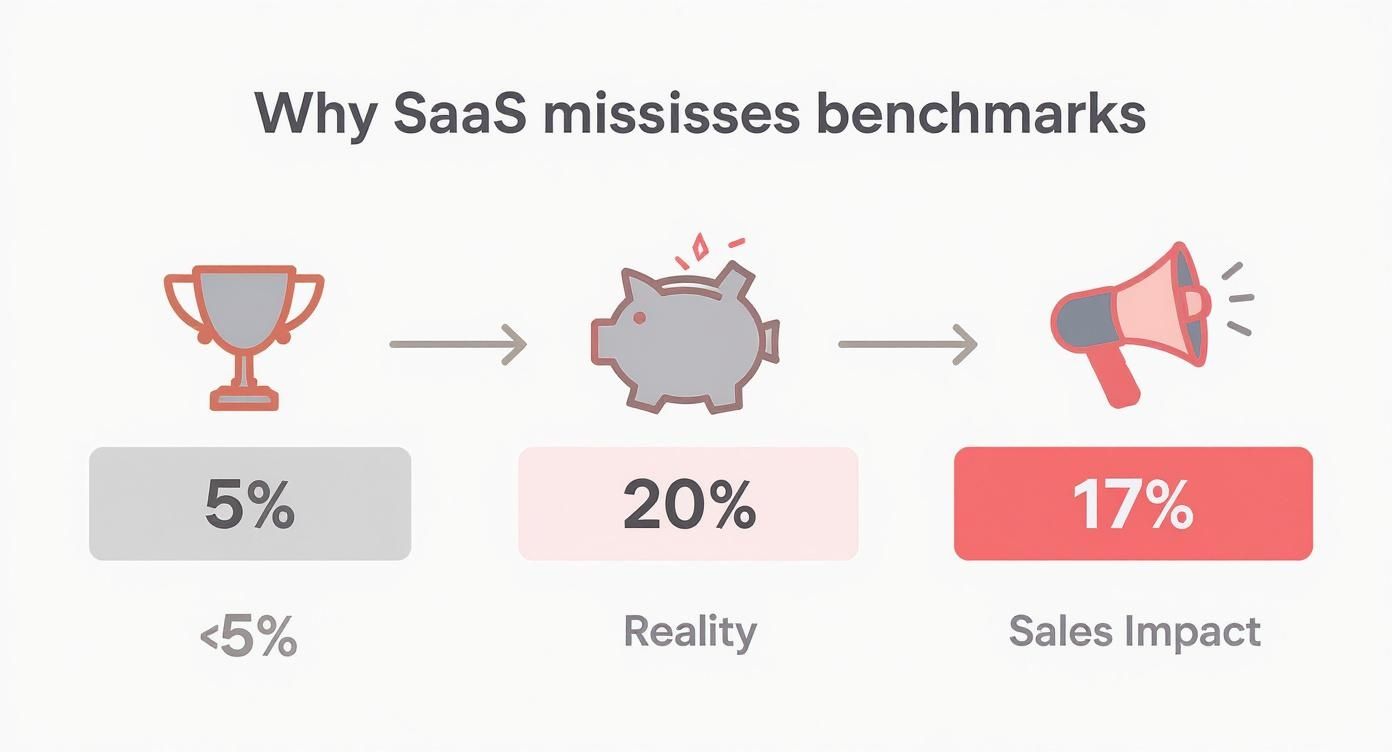
As you can see, a company might be aiming for a <5% churn rate, but in reality, they're hitting 20%. A big chunk of that, maybe 17%, could be coming from a specific sales channel or customer segment that was never a good fit to begin with.
Go Deeper With Cohort Analysis
Your overall churn rate is just a starting point. Think of it like a single vital sign—it tells you if your company has a fever, but it doesn't tell you why. For a real diagnosis, you need cohort analysis.
This is your most powerful tool for finding the root cause of your churn.
A cohort is just a group of customers who share a common trait, usually their sign-up month. So, you’d lump all the customers who joined in January into one group, everyone from February into another, and so on.
By tracking how these groups behave over time, you can spot some game-changing patterns:
- Weak Onboarding: Do customers who joined in March churn at an alarming rate within their first 30 days? That’s a huge red flag for your onboarding process.
- Product Gaps: Does every cohort start dropping off around the six-month mark? Maybe they’re hitting a feature wall or outgrowing what your product can do.
- Impact of Changes: Did the May cohort, who got access to that new feature you launched, stick around longer than the April cohort? Now you have solid data on the ROI of your product updates.
This level of detail is where the magic happens. For a deeper dive into these techniques, our complete guide on churn rate analysis walks you through how to uncover these hidden trends. When you move beyond a single, company-wide number, you stop reacting to churn and start proactively preventing it.
Actionable Strategies to Reduce Your Churn Rate

Knowing your churn rate is like getting a diagnosis. It tells you there's a problem, but it doesn't write the prescription. Hitting your industry's SaaS churn rate benchmarks isn't the finish line. The real work starts now—turning that data into a concrete plan to keep the customers you fought so hard to win.
To do this, we need to shift from putting out fires to proactively building a fireproof customer experience. It’s about making your product so indispensable that leaving feels like a genuine step backward for your customers. Let's get into some proven, practical strategies that tackle the real reasons customers leave.
Redesign Onboarding for a Faster Time-to-Value
Those first few interactions a new customer has with your product? They're everything. A clunky or confusing onboarding is one of the fastest ways to lose a customer before they've even started. People don't sign up to learn your software; they sign up to solve their problem. Your job is to guide them to that "aha!" moment as quickly as possible.
Scrap the generic product tour that shows off every single button. Instead, build a value-driven onboarding flow. Figure out the one or two core actions a new user must take to see why they signed up. Is it creating their first report? Inviting a colleague? Connecting an integration? Steer them directly to that win.
Implement Proactive Customer Success Check-Ins
Waiting for customers to complain is a losing game. By the time someone reaches out with an issue, their frustration has already been simmering. Top-tier customer success teams don't just react; they get ahead of problems before they even start.
Set up a system of smart, strategic check-ins based on where a customer is in their journey. This could look like:
- Post-Onboarding Follow-Up: Check in around the 30-day mark to make sure they've gotten the hang of key features.
- Usage-Based Triggers: Automate an email or a call if you notice a drop in their login frequency or use of important features.
- Quarterly Business Reviews: For high-value accounts, schedule a dedicated meeting to review their goals and show them how your product helps them win.
These aren't sales calls. They are genuine opportunities to offer help, gather feedback, and show that you're invested in their success. This proactive mindset turns customer success from a cost center into a powerful retention engine.
Build a Product Roadmap Fueled by Customer Feedback
Your customers are telling you exactly what they need to stick around—you just have to listen. Building a tight feedback loop is the key to aligning your product with what users actually need. When customers see their suggestions become real features, they transform from users into invested partners.
This goes way beyond a simple suggestion box. Create structured ways for people to share their thoughts:
- In-app surveys to capture feedback right when they're using a feature.
- A dedicated feedback portal where users can submit and upvote ideas.
- Deep analysis of support tickets and sales calls to spot recurring frustrations.
Most importantly, close the loop. When you release a feature that came from customer feedback, announce it and personally thank the people who suggested it. This small act shows you're listening and makes customers feel heard. For more on this, our guide on how to reduce customer churn has more tactical advice.
Use Behavioral Analytics to Predict Churn
The best way to fight churn is to see it coming. Modern product intelligence platforms like SigOS help you look past lagging indicators (like cancellation surveys) and focus on leading indicators—the subtle shifts in behavior that signal a customer is at risk.
These warning signs often show up long before a customer hits the cancel button:
- A slow but steady decline in daily or weekly active users.
- They stop using key "sticky" features that correlate with long-term value.
- They're no longer inviting new team members.
- Support tickets about core functionality start piling up.
By constantly analyzing this user behavior, you can develop health scores for every account. For a deeper dive, you can explore techniques like predictive churn modeling to get even more precise. This data-driven approach allows your success team to stop guessing and start focusing their energy on at-risk accounts with targeted, helpful interventions to get them back on track.
Common Questions About SaaS Churn
Once you start digging into SaaS churn rate benchmarks, a lot of questions pop up. It's one thing to understand the theory, but applying it to your own business is where the rubber meets the road. Let's tackle some of the most common questions we hear.
The idea here is to clear up any lingering confusion and help you confidently start measuring and improving your own customer retention.
What Is Negative Churn and Is It Realistic?
Negative churn is the holy grail for any subscription business. It happens when the revenue you gain from your existing customers—through upgrades, add-ons, or expanded use—is greater than the revenue you lose from customers who cancel or downgrade.
Picture a bucket of water representing your customer base. Churn is a few small leaks. But the customers still in the bucket are so happy with your product that they're adding more water (expansion revenue) than what's leaking out. The result? Your total revenue from existing customers actually goes up, even before you sign a single new one.
It’s tough to achieve, but it's absolutely realistic. We see it most often with companies that have usage-based or tiered pricing models. Hitting negative churn is a powerful signal that you have strong product-market fit and your customers are finding more and more value over time.
How Often Should I Calculate My Churn Rate?
Consistency is key here, but you need a good cadence to catch problems before they spiral.
Here’s a practical breakdown:
- Monthly: This is the standard for a reason. Calculating churn every month gives you a real-time pulse on customer health and lets you react quickly to any worrying spikes. It’s also detailed enough to connect churn to specific events, like a recent product update or a marketing campaign.
- Quarterly: Looking at churn quarterly helps smooth out the natural ups and downs you might see from month to month. This broader view is perfect for strategic planning and board meetings because it gives a more stable picture of your retention trends.
The best approach? Do both. Track churn monthly for your day-to-day operations and review it quarterly to guide your long-term strategy.
Your overall churn rate is a lagging indicator—it tells you what already happened. To get ahead, you need to track leading indicators of churn, such as declining product usage, a drop in feature adoption, or an increase in support tickets from a specific account.
Should I Focus More on Customer Churn or Revenue Churn?
Honestly, you need to track both. But if you have to pick one to prioritize for the financial health of your business, it’s revenue churn (MRR churn). Why? Because it measures the direct dollar impact, which is what ultimately drives forecasting and growth.
Think about it this way: losing ten small customers paying 20 a month is a 200 problem. Losing one enterprise client paying $5,000 a month is a crisis.
Customer churn (or logo churn) would make the first scenario look worse (10 logos lost vs. 1). But revenue churn immediately shows you where the real danger is. So, track customer churn to gauge overall satisfaction and product stickiness, but watch revenue churn to protect your bottom line.
Understanding churn is the first step, but proactively preventing it is how you win. SigOS connects directly to your customer communication and product usage data, using AI to identify the behavioral signals that predict churn. Our platform surfaces the most urgent product issues and feature requests, prioritizing them by their direct impact on revenue so you can fix what matters most. Stop guessing and start making data-driven decisions to protect your bottom line. Discover how SigOS can reduce your churn.
Keep Reading
More insights from our blog


Ready to find your hidden revenue leaks?
Start analyzing your customer feedback and discover insights that drive revenue.
Start Free Trial →