A Complete Guide to Self Serve Analytics for SaaS Teams
Unlock your data's potential with this guide to self serve analytics. Learn how to empower SaaS teams to make faster, revenue-driven decisions without IT.

Self-serve analytics is really just a way to let business users—think product, support, and growth teams—dig into data and find answers for themselves. It cuts out the middleman, breaking the old habit of relying on specialized data analysts for every single question. This gives teams the power to make quicker, data-backed decisions on their own.
Why Self Serve Analytics Matters Now
Imagine your product team has a fully-stocked kitchen, ready to cook up insights whenever they get a craving for data. That's the core idea behind self-serve analytics.
Instead of everyone waiting in a long line for a single chef (the data analyst) to prepare every meal (a report), team members can grab the ingredients they need and whip up their own analyses. This isn't just a minor convenience; it's a fundamental shift that makes the entire company more agile.
This model directly tackles one of the most common headaches in growing SaaS companies: the dreaded data request queue. When every question has to be filed as a ticket for the data team, decision-making grinds to a halt. Self-serve platforms shatter that dependency, creating a culture where curiosity is rewarded with immediate answers, not a spot in a backlog.
To put it in perspective, let's look at how things used to be versus how they can be now.
Traditional Analytics vs Self Serve Analytics
This table offers a quick comparison, highlighting the key differences in process, speed, and user empowerment between the old IT-led model and a modern self-serve approach.
| Aspect | Traditional Analytics | Self Serve Analytics |
|---|---|---|
| Who Accesses Data | Specialized data teams (analysts, scientists) | Business users (product managers, marketers, support leads) |
| Process | Submit a ticket, wait in a queue, receive a static report | Explore data directly using an intuitive interface |
| Speed to Insight | Days or weeks | Minutes or hours |
| Flexibility | Rigid; follow-up questions require a new ticket | High; users can ask follow-up questions and pivot in real-time |
| Data Team's Role | Fulfilling ad-hoc report requests (gatekeepers) | Building and maintaining the data platform (enablers) |
| Outcome | Data is a bottleneck | Data is a shared resource that accelerates decisions |
As you can see, the shift is from a service-desk model to an empowerment model, which has a massive impact across the business.
The Business Impact of Data Democratization
Giving teams direct access to data creates a powerful ripple effect. It’s not just about moving faster; it's about fostering a sense of ownership and a much deeper understanding of the product and its users. The benefits are real and substantial:
- Accelerated Decision-Making: A product manager can test a hypothesis in minutes, not days.
- Reduced Operational Bottlenecks: Data analysts are freed from an endless stream of routine queries to focus on more strategic, complex challenges.
- Increased Data Literacy: When people work with data every day, their confidence and skills naturally improve, leading them to ask smarter, more sophisticated questions over time.
The goal of self-serve analytics is to move your organization away from a state where you need an army of "English-to-SQL translators." Instead, you build a system that increases the operating leverage of your data team, allowing them to serve more people with greater impact.
The market is clearly moving in this direction. The self-service analytics market is on track to hit a staggering USD 61.66 billion by 2033, with companies adopting it to cut down IT bottlenecks by up to 50%. You can dig deeper into these trends and the self-service analytics market growth on marketsizeandtrends.com.
In today's fast-moving environment, this evolution often involves bringing in new innovations. Exploring product analytics tools that integrate AI for better insights is a great next step for uncovering even deeper truths hidden within your data.
Building Your Self-Serve Analytics Foundation
Getting started with self-serve analytics isn't about buying the shiniest new software. It's about building a solid data ecosystem from the ground up. Think of it like building a house—you don't start with the paint and furniture. You have to pour a solid foundation first, one that can support everything you'll eventually build on top of it.
In the world of analytics, that foundation rests on three crucial pillars: integrated data, smart governance, and the right tools for your team. If you cut corners on any of these, the whole structure gets wobbly, leading to bad insights and frustrated people. The aim here is to create something that’s not just powerful, but genuinely usable.
Integrating Diverse Data Sources
The very first step is getting all your data under one roof. Your product usage data tells you what users are doing inside your app, but that's only part of the story. CRM data from a platform like Salesforce can tell you who these users are, and support tickets from Zendesk or Jira reveal why they're running into trouble.
You need to combine these streams to get the full picture. This usually means building solid connections between these systems. If you want a deeper dive into the technical side, our guide on how to build data pipelines walks through how to connect these different sources. The end goal is a central data warehouse that becomes your company’s single source of truth, making sure everyone is working from the same information.
This hierarchy shows how a central data hub is the launchpad for empowering your teams and speeding up decisions.
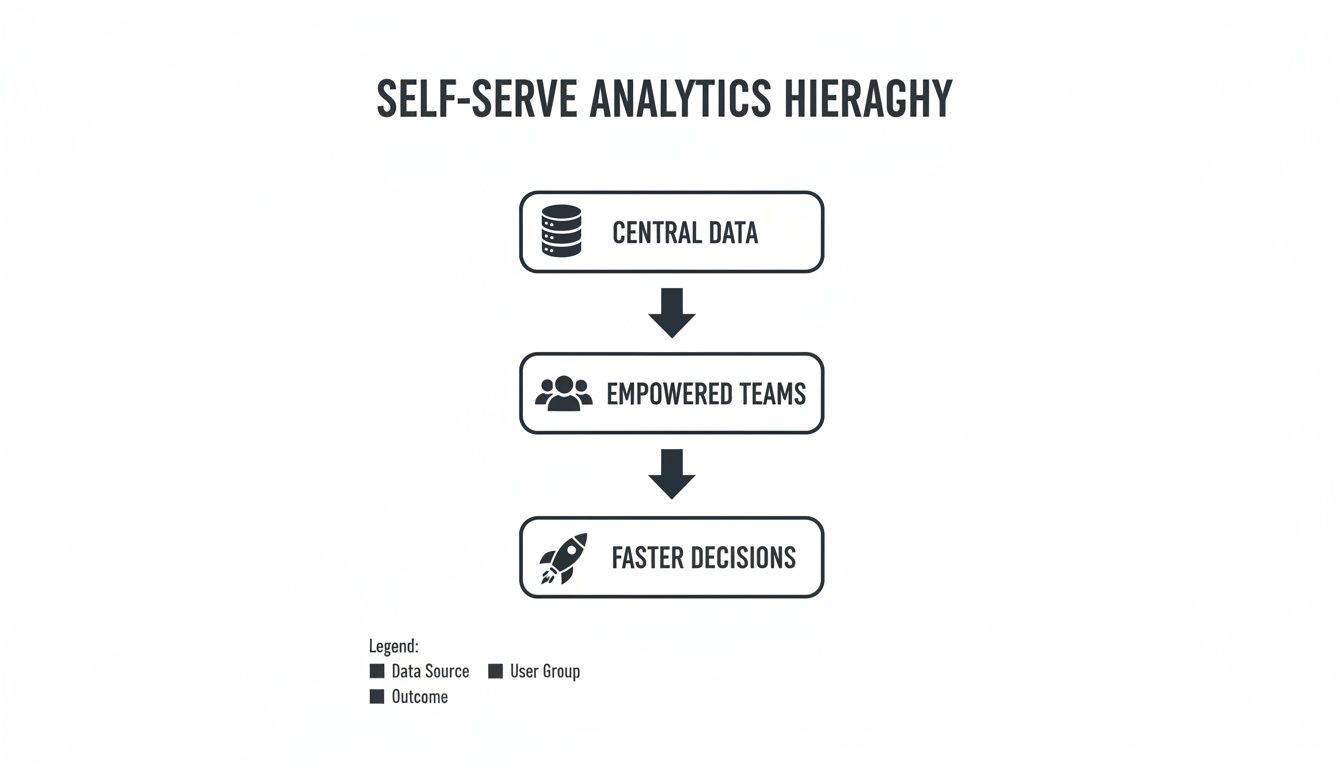
As the visual makes clear, it all starts with well-organized, centralized data. That’s what enables teams to find their own answers and make smarter choices, faster.
Governance and Tool Selection
Once your data is in one place, the next challenge is making sure it's clean, consistent, and trustworthy. That’s where strong data governance comes in. This isn't about locking data down; it’s about making it reliable so people actually use it.
Key governance practices include:
- A Shared Data Dictionary: You need to define key metrics like “Active User” or “Churn Rate” so that when someone from Marketing talks to someone from Product, they're speaking the same language.
- Clear Access Controls: Set up permissions so team members only see the data they need to do their jobs. This is crucial for protecting sensitive customer or company information.
- Certified Datasets: Have your data team create and bless "golden" datasets. These are pre-cleaned, verified sources of truth that anyone in the company can use with confidence.
Finally, the tools you pick have to be intuitive enough for non-technical folks to use without a six-week training course. The trend is overwhelmingly toward cloud-based solutions. In fact, cloud platforms are expected to make up over 55% of the self-service market by 2026. Companies that go this route report 40% faster decision-making because they can connect tools easily and let people run analyses without waiting on IT. You can dig into these trends and the impact of cloud-based self-service solutions on fortunebusinessinsights.com.
Bringing together smart data integration, clear governance, and user-friendly tools creates a scalable system where curiosity can truly thrive.
How to Drive Adoption and Foster a Data Culture

Rolling out a powerful self serve analytics platform is just the first step. The most impressive tools are just expensive shelfware if nobody actually uses them. Getting teams on board isn't about sending a mass email with a login link; it’s about fundamentally shifting how your entire organization interacts with data.
The real goal is to get your teams comfortable enough to fish for their own insights instead of waiting for the data team to hand them a report. This takes a thoughtful, human-centric approach that builds confidence and curiosity, turning people from passive data consumers into active explorers.
Design Targeted Onboarding Programs
A generic, one-size-fits-all training session is a recipe for failure. Every team has different questions, workflows, and priorities, and your onboarding needs to speak their language.
- For Product Teams: Your training should center on analyzing user behavior, tracking feature adoption, and testing product hypotheses. Show them exactly how to build a funnel or segment users to finally understand why engagement is dropping.
- For Support Teams: Teach them how to connect the dots between support ticket trends and actual product usage data. This gives them the power to find the root cause of customer frustrations, shifting from reactive problem-solving to proactive improvements.
- For Growth Teams: Focus the training on what they care about most: campaign performance, conversion rate optimization, and customer lifetime value. Give them the skills to draw a straight line from their marketing efforts to revenue.
To make sure your new users get the hang of these tools, especially in a SaaS environment, it's smart to follow some established guidelines. These SaaS Onboarding Best Practices offer a great starting point.
The secret to adoption is simple: make the tool solve a real, immediate pain point for each team. When a product manager can answer a question in five minutes that used to take five days, they're hooked.
Start Small and Identify Champions
Forget the big, splashy company-wide launch. Instead, kick things off with a small pilot program. Pick one motivated team and a single, well-defined business problem to solve. This controlled setting lets you iron out any wrinkles, gather honest feedback, and—most critically—score an early win.
Once that pilot team achieves a measurable result, they instantly become your internal champions. Their success story is the best marketing you could ask for. They'll share their experience, help train their colleagues, and show everyone the practical value of self-serve analytics. This creates a natural, organic buzz. Of course, presenting those wins clearly is part of the magic; following some best practices for data visualization can make their insights that much more powerful. This strategy builds momentum from the ground up, turning skepticism into genuine demand across the company.
Common Self-Serve Analytics Pitfalls and How to Avoid Them
Rolling out a self-serve analytics program is a fantastic goal, but it’s not without its landmines. Just dropping a new BI tool into the mix without a solid game plan is like giving everyone the keys to a race car but forgetting the driving lessons. You're more likely to end up with chaos and confusion than with insightful analysis.
But don't worry—with a little foresight, you can sidestep these common traps. The trick is to think ahead and build a resilient data culture from the start, rather than waiting for problems to pop up and damage your team's confidence in the data.
The Dueling Dashboards Dilemma
One of the most common—and corrosive—problems is what I call "dueling dashboards." It’s that painful meeting moment when Marketing reports 1,500 new sign-ups, but the Product team’s dashboard shows 1,250. Suddenly, the entire conversation grinds to a halt. Instead of talking strategy, everyone’s arguing about whose number is right.
This mess almost always points back to a lack of shared rules. Without a central playbook, every team starts defining core metrics like "active user" or "churn rate" in their own way. This leads to conflicting reports, erodes trust, and pretty soon, nobody believes any of the data. Once that trust is gone, your whole self-serve initiative is dead in the water.
To get ahead of this, you need to establish a single source of truth from the very beginning.
- Build a Shared Data Dictionary: This isn't just a "nice-to-have." Document and get everyone to agree on the precise definitions for every important business metric. It ensures everyone is speaking the same language.
- Form a Governance Team: Put together a small, cross-functional group to be the guardians of data quality. They're responsible for approving any changes to metric definitions and keeping things consistent.
- Certify Your Datasets: Have your data team prep and officially "certify" key datasets. Think of it as a seal of approval that tells business users, "This data is clean, vetted, and ready for analysis."
An inconvenient truth of self-service is that executives don't want "dashboard homework." They won't sift through 30 filters to find the right answer. If the data isn't trustworthy and immediately clear, they will revert to asking an analyst, defeating the entire purpose of the system.
Picking a Tool That Gathers Dust
Another classic mistake is choosing a tool that's way too complex for the people who are supposed to use it. Some platforms are incredibly powerful, but they demand a serious understanding of data modeling or even a special query language. Dropping a tool like that on a marketing or customer support team is just a recipe for frustration and zero adoption.
The entire point is to empower people, not make them feel like they need a data science degree to answer a simple question. The right tool should feel intuitive. If your team has to spend hours learning complex functions just to figure out a basic trend, you’ve picked the wrong solution.
The sweet spot is a tool that meets your team where they are. Look for a platform with a clean, drag-and-drop interface that gets most of your team up and running quickly. At the same time, it should have more advanced features tucked away for your power users. This approach delivers immediate wins and gets more people on board from day one.
Table: Common Pitfalls and Proactive Solutions
Navigating the path to a successful self-serve analytics culture means being aware of the common hurdles. This table summarizes the key challenges we've discussed, their potential impact on your business, and the practical steps you can take to avoid them.
| Pitfall | Potential Impact | Solution |
|---|---|---|
| Dueling Dashboards | Erodes trust in all data; meetings devolve into arguments over numbers instead of strategy. | Establish a single source of truth with a shared data dictionary, a governance council, and certified datasets. |
| Tool is Too Complex | Low adoption rates; users revert to old habits (like asking analysts), and the tool investment is wasted. | Choose a tool that matches user skill levels, prioritizing a simple UI with options for power users. |
| Lack of User Onboarding | Users feel overwhelmed and unsupported; they fail to see the tool's value and abandon it. | Develop a structured onboarding program with hands-on training, clear documentation, and dedicated office hours. |
| No Clear Goals or Metrics | The initiative lacks direction; it's impossible to measure success or prove ROI to leadership. | Define specific, measurable Key Performance Indicators (KPIs) for the program itself, such as adoption rate and time-to-insight. |
| Ignoring Data Governance | Data quality degrades over time, leading to inaccurate insights and poor business decisions. | Implement automated data quality checks, regular audits, and clear processes for data maintenance. |
By proactively addressing these issues, you can build a system that not only works but thrives, turning data curiosity into a real competitive advantage for your entire organization.
Moving Beyond Dashboards with Product Intelligence
Self-serve analytics is fantastic at answering one critical question: what is happening inside your product? Your dashboards can clearly show a dip in user engagement or a sudden spike in churn. But that's often where the story ends. You're left staring at a chart, knowing something's wrong, but with no clear path to understanding the root cause or its real cost to the business.
This is where the real work begins, and it's also where traditional tools start to show their limits. They're great at crunching the numbers—the quantitative stuff—but they often can't make sense of the messy, unstructured data from actual customer conversations. Think about all the gold hidden in support tickets, sales call transcripts, and in-app feedback. That's the qualitative data, the stuff that tells you why things are happening.

We've all been there, looking at a dashboard just like this one. The challenge isn't the data itself; it's connecting those neat charts and graphs to the specific user complaints or buried feature requests that are actually driving the numbers.
From Data Points to Dollar Signs
Let's make this real. Imagine a product manager sees a dashboard flagging a 5% increase in churn for a key user segment. With a standard self-serve analytics tool, what happens next is a painful, manual investigation. They start digging through Zendesk tickets, sifting through customer surveys, and trying to piece together clues. It’s slow, tedious, and often inconclusive.
This is the problem an AI-driven product intelligence platform like SigOS is built to solve. It doesn't just look at one type of data; it ingests both quantitative usage stats and qualitative customer feedback, then uses AI to find the signal in all that noise.
A product intelligence platform won't just tell you churn is up. It will tell you that a specific bug in the checkout flow is the culprit, and it's costing you exactly $50,000 a month in lost revenue. Suddenly, a vague problem becomes an actionable, high-priority business case with a clear ROI.
This shift is more than just a nice-to-have. We're seeing small and medium-sized businesses achieve 20-30% gains in customer retention simply by getting a better handle on user behavior. The entire analytics market is moving in this direction, with AI-augmented platforms that can detect patterns with incredible accuracy. These tools can turn qualitative feedback into quantifiable revenue impact scores and even create automated Jira tickets. If you want to dig deeper, you can explore the trends in the self-service analytics market on grandviewresearch.com.
How Product Intelligence Augments Your Teams
Product intelligence doesn't replace self-serve analytics—it makes it exponentially more powerful by adding a crucial layer of context. It's about giving your teams a more complete toolkit.
- Product Teams can finally stop guessing. They can prioritize their roadmap based on the issues and features that have the biggest proven impact on revenue.
- Support Teams can graduate from just closing tickets to identifying systemic problems. Fixing the root cause means reducing ticket volume for good.
- Growth Teams can uncover the silent killers in the user journey—those subtle points of friction that are tanking conversion rates without anyone noticing.
When you bridge the gap between what your users do and what they say, you create a powerful feedback loop for continuous improvement. For any organization that's serious about making data-driven decisions, understanding what a true product intelligence platform can do is the natural next step.
Implementing Your Future-Proof Data Strategy
Building a truly data-driven culture doesn't happen overnight. It’s a journey, and the first step is always getting a solid foundation for self-serve analytics in place. This is about breaking free from the old, reactive model of data requests and empowering your teams to find their own answers in clean, reliable data.
But answering what happened is only half the battle. The real competitive edge comes from understanding the why behind the numbers. This is where you layer AI-powered product intelligence on top of your self-serve setup. It’s the key to automatically connecting a dip in a KPI to the actual customer feedback—the support tickets, sales calls, and survey responses that explain it all.
From Analysis to Automated Action
The ultimate goal is to close the gap between insight and action until it disappears entirely. Imagine a world where your teams aren't spending their days digging through dashboards. Instead, you have automated systems that proactively surface the most urgent, revenue-impacting signals for you.
The future of analytics is one where the line between analysis and action disappears. Automated platforms will become essential partners, not just tools, in identifying and capturing revenue-critical opportunities before they escalate or slip away.
Adopting this forward-thinking approach changes everything. It turns leaders into champions for a smarter way of working, where decisions are backed not just by charts, but by a deep, unified understanding of the customer's voice.
Your roadmap to get there involves a few key steps:
- Assess Your Data Maturity: Be honest about where you stand. Are you still buried in reporting queues, or do your teams have the tools they need to explore data freely?
- Champion Early Wins: Kick things off with a small pilot project. Show everyone the immediate value of connecting the dots between your quantitative product data and qualitative customer feedback.
- Invest in Intelligence: Look into platforms that can automate the heavy lifting of analyzing unstructured feedback. You need a system that can cut through the noise and deliver clear, actionable signals that push the business forward.
Common Questions About Self-Serve Analytics
As you dive into self-serve analytics, you're bound to run into a few practical questions. Let's tackle some of the most common ones that teams face when getting started.
How Can We Get Started with a Small Team and a Tight Budget?
You don't need a huge team or a massive budget to make this work. The trick is to start small and focus on a single, high-impact win.
Find a user-friendly, cloud-based tool that offers a flexible pricing plan—something that can grow with you. Forget trying to connect every single data source from day one. Instead, pick just one or two reliable sources, like your product usage data or support tickets from Zendesk. Your goal is to prove value, fast. One clear, tangible win is the best way to get the buy-in you need to expand your efforts.
What’s the Real Difference Between Self-Serve Analytics and Business Intelligence?
Think of self-serve analytics as the natural evolution of traditional Business Intelligence (BI). They both aim to use data to make better decisions, but how they get there is completely different.
- Traditional BI has always been a centralized function. If a business user needed a report, they'd put in a ticket with a technical team, wait in a queue, and eventually get a static dashboard. It was a classic gatekeeper model.
- Self-serve analytics blows that model up. It puts intuitive tools and direct data access right into the hands of the business users themselves. They can explore hunches, ask follow-up questions, and create their own insights without waiting on anyone.
This shift fundamentally changes the role of your data experts. They stop being report builders and become platform enablers, empowering the rest of the company to find their own answers.
How Do You Handle Data Quality and Governance?
Governance is what keeps self-serve analytics from turning into the Wild West. Without it, you’ll end up with a mess of conflicting reports and a total loss of trust in your data.
Effective governance isn’t about locking data down. It’s about making the data so reliable and consistent that people feel confident enough to bet their decisions on it every single day.
Here’s how you build that foundational trust:
- Create a Shared Data Dictionary: Everyone needs to be speaking the same language. Document and agree on official definitions for your most important business metrics.
- Set Up Tiered Permissions: Use role-based access so team members only see the data that's relevant to their job. This keeps things clean and secure.
- Certify 'Golden' Dashboards: Your data team should create and maintain a set of official dashboards for company-wide KPIs. These become the undisputed source of truth for everyone.
Ready to go beyond dashboards and find the revenue opportunities hiding in your customer feedback? SigOS uses AI to connect your qualitative data to business KPIs, shining a light on the signals that truly matter. Learn how SigOS can future-proof your data strategy.
Keep Reading
More insights from our blog


Ready to find your hidden revenue leaks?
Start analyzing your customer feedback and discover insights that drive revenue.
Start Free Trial →