What Is a Data User? a Practical Guide for SaaS Teams
Wondering what is a data user? Our guide defines the role, explores key types from analyst to PM, and shows how they drive growth in a modern SaaS company.

Your team is probably already using data. The friction starts when everyone means something different by that word.
In one product meeting, a support lead says the data shows customers are blocked by onboarding. A product manager points to feature adoption. Finance wants cleaner revenue attribution. An engineer asks whether anyone trusts the event schema. Everyone is trying to be data-driven, but they're talking about different data, different levels of access, and different standards of proof.
That's where the term data user becomes useful. It gives you a practical way to describe how a person interacts with data, what decisions they're trying to make, and what support they need to do that well. It's less about title and more about role in the value chain.
Data-Driven Means Different Things to Different People
A SaaS company can have dozens of people who use data every week without any of them doing the same kind of work.
A customer success manager opens a dashboard before a renewal call. A product manager reviews feedback themes before grooming. A revenue leader checks account expansion signals. A data analyst writes a query to reconcile usage with billing. All of them are data users, but their needs are nowhere near identical.
That distinction matters more now because the volume of data keeps climbing. Global data creation reached about 120 zettabytes in 2023 and is projected to reach roughly 181 zettabytes by 2025, according to WGU's summary of widely cited industry estimates. More data hasn't made alignment easier. It has made role clarity more important.
The meeting where everyone is right
In practice, the confusion usually looks like this:
- Product says: “We need behavior data to prioritize the roadmap.”
- Support says: “We already know the top pain points from ticket volume.”
- Sales says: “That's not enough. We need to know which requests affect deals.”
- Engineering says: “Before any of that, define the source of truth.”
Nobody is wrong. They're just operating as different data users with different thresholds for trust, speed, and detail.
A team doesn't become data-driven when everyone sees the same dashboard. It happens when each person can use the right level of data for the decision in front of them.
Why this term is operationally useful
When I onboard teams to a stronger data culture, I don't start with tools. I start with questions:
- What decision is this person trying to make?
- What form of data do they need?
- How much context or governance has to sit around that access?
Those questions cut through a lot of fake alignment.
If you're asking what is a data user, the simplest practical answer is this. It's any person who turns data into action. Sometimes that action is a roadmap choice. Sometimes it's a pricing call, a support escalation, a forecast adjustment, or a board-level decision. The useful part isn't the label itself. It's the discipline of mapping data use to business value.
Defining the Data User Spectrum
A clean way to think about data users is to treat your company like a kitchen.
Some people prepare ingredients. Some combine them into meals. Some taste and adjust. Some only need the finished plate to decide whether it works. If you give every person in that kitchen the same tools, same ingredients, and same permissions, you don't get productivity. You get waste and confusion.
Statistics Canada describes a data user as the person or organization that consumes raw data or statistical information to answer questions, make decisions, or build analysis, while distinguishing raw data from organized statistical output designed to communicate a story to information users in its explanation of data and statistics. That maps well to how SaaS teams operate.
Here's the visual model I use with teams:
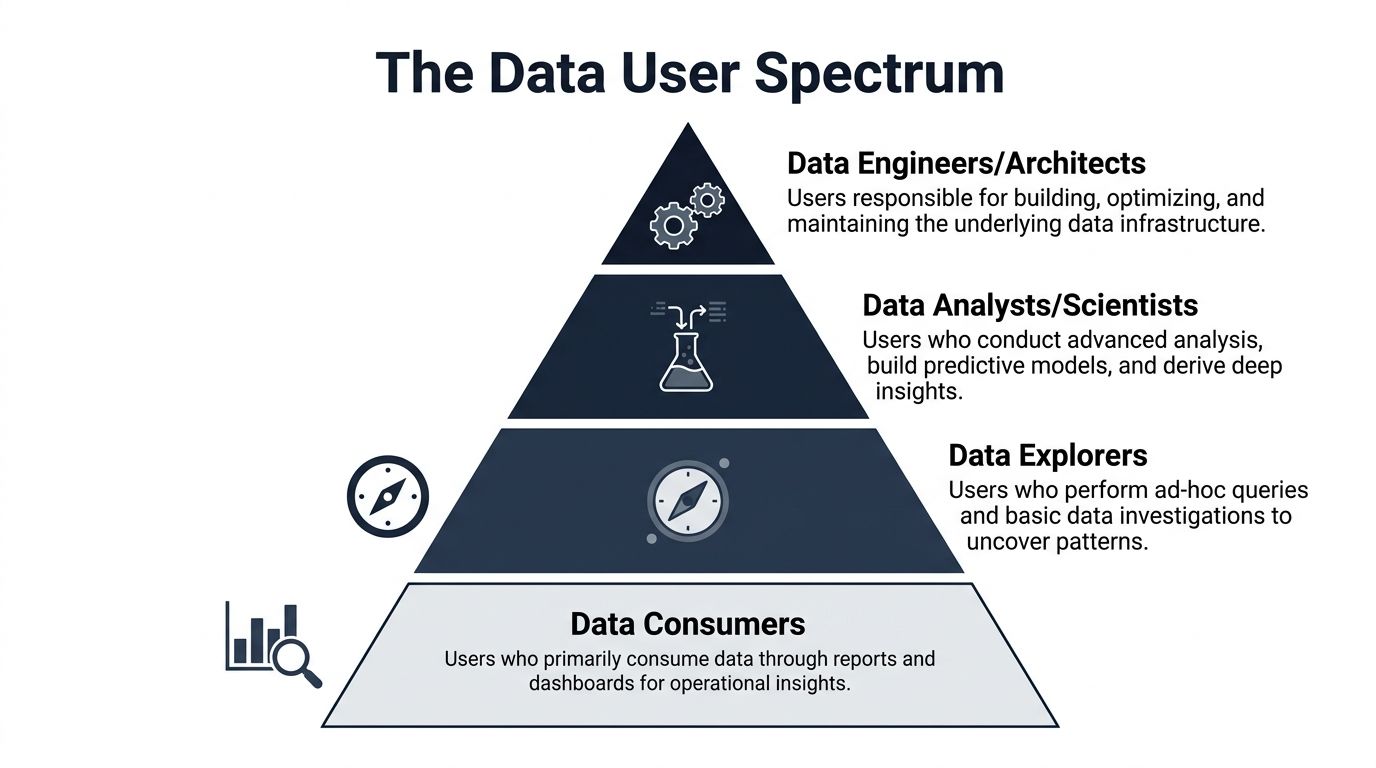
The broad base of everyday users
Most companies have a large group of people who don't need raw tables or complex models. They need reliable outputs.
These are your casual users or data consumers. Think support managers, account executives, CX leads, or operations staff. They live in dashboards, recurring reports, and workflow tools. Their questions are direct:
- Which accounts need attention today?
- What issue category is rising?
- Which segment is underperforming?
- What changed since last week?
They need clarity, not complexity.
Above them are data explorers. In many SaaS teams, this includes product managers, growth managers, and business operations leads. They don't want to become analysts, but they do want to investigate. They filter data, compare cohorts, and validate hypotheses. A strong power user often emerges from this layer because they know the business context well enough to ask sharper questions than a generic dashboard can answer.
The specialist layer
Then you reach the people who work directly with more technical forms of data.
Business analysts sit in the middle. They bridge business ambiguity and technical structure. They define metrics, write queries, investigate anomalies, and explain findings in plain English. If a churn number looks off, they usually find out why.
Data scientists and advanced analysts go deeper. They work with event streams, experiments, feature engineering, model inputs, and pattern detection. They care about data quality, reproducibility, and whether a signal is predictive or just interesting.
Technical stakeholders include data engineers, analytics engineers, and architects. Some teams don't call them data users because they build the system rather than consume the output. That's too narrow. They are data users too. They rely on metadata, schemas, lineage, and infrastructure telemetry to make sound decisions about the platform.
The executive layer
Executives use the least raw data and carry the highest consequence decisions.
A CEO, CRO, or VP of Product rarely needs unit-level records in a spreadsheet. They need trusted synthesis. Their job isn't to inspect every row. Their job is to decide where capital, people, and attention go next.
Practical rule: Define data users by the decisions they make, not by how technical they sound.
That framing prevents two common mistakes. First, treating everyone as a dashboard viewer. Second, assuming the only “real” data users are analysts. In a healthy SaaS company, the spectrum is wide, and each layer creates value differently.
Workflows and Examples in a SaaS Environment
Titles can hide the actual work. Workflows make it visible.
In a SaaS company, data becomes valuable when it helps someone move from signal to action without losing context. The easiest way to understand what a data user is, is to watch what each type of person does during a normal week.
Product and growth users
A product manager usually starts with a business question, not a dataset. Why are trial users dropping after setup? Why are enterprise prospects asking for the same integration? Why did feature adoption stall even though launch metrics looked healthy?
That person often works across product analytics, support feedback, CRM notes, and release data. In teams using platforms like Amplitude, Mixpanel, Linear, and customer feedback systems, the PM is piecing together fragmented evidence. In a product intelligence workflow, a platform like SigOS can connect support conversations, sales feedback, usage signals, and revenue context so the PM can prioritize issues based on business impact rather than loudest internal opinion.
The output isn't a model. It's usually one of these:
- A roadmap trade-off: fix onboarding friction before shipping another reporting feature
- A spec change: break one feature into smaller deliverables because the pain point is narrower than expected
- A launch decision: hold release until account-level blockers are understood
Analysts and technical users
A business analyst's day looks different. They're often asked to resolve disputes nobody else can settle.
Sales says churn is concentrated in one segment. Product says that segment isn't adopting the core workflow. Finance says revenue classification changed. The analyst pulls the relevant records, checks definitions, validates joins, and turns disagreement into an answer the room can use.
A data scientist goes deeper into raw event data, model features, experimentation logs, and behavioral patterns. Their work is less about monitoring and more about inference. They ask whether a pattern generalizes, whether a variable is stable, and whether the business can trust the model enough to operationalize it.
For teams that need examples of how this work gets documented, a good reference is this sample of a data analysis report, which shows the kind of structure that turns technical investigation into something decision-makers can use.
Operational and executive users
Customer success and support leaders are often underestimated as data users because they may not touch SQL. That misses the point.
They use data every day to triage accounts, prepare escalations, identify repeat defects, and understand which problems are noise versus systemic issues. Their job is operational interpretation. They need timely, reliable outputs tied to customers and workflows, not abstract metrics floating in isolation.
Executives use compressed views of the same reality. They care about trend direction, concentration of risk, and where intervention amplifies results.
Here's a simple comparison that helps teams align expectations.
| Data User Personas at a Glance | |||
|---|---|---|---|
| Persona | Primary Question | Typical Tools | Data Granularity |
| Casual User | What needs attention right now? | Dashboards, CRM, support tools | Aggregated |
| Product or Growth Explorer | What behavior or feedback pattern should change priority? | Product analytics, feedback platforms, spreadsheets | Mixed |
| Business Analyst | What is actually happening, and why? | SQL, BI tools, warehouse interfaces | Detailed |
| Data Scientist | What patterns can support prediction or experimentation? | Python, notebooks, model tooling, event data systems | Raw or modeled |
| Executive | Where should the business act next? | KPI dashboards, board reporting, planning tools | Summarized |
If a person can't turn the output into a decision, they don't need more data. They need a better workflow.
That's the practical test. Don't ask whether someone is “technical enough” to count as a data user. Ask what decision they own, what evidence they need, and what format lets them act without delay.
Managing Access Permissions and Data Governance
The fastest way to destroy trust in a data program is to confuse access with enablement.
When teams first push for broader data access, they often swing too far. They hand out direct access to everything, assume transparency will solve alignment, and then spend months cleaning up conflicting analyses, privacy concerns, and accidental misuse. Good governance doesn't slow teams down. It keeps them usable at scale.
Match access to role and purpose
Different data users need different levels of exposure.
A support manager may need issue trends by account and product area. A product analyst may need event-level behavior. A data scientist may need integrated records in a controlled environment. An executive often needs only approved metrics and decision-ready narratives.
The practical principles are straightforward:
- Least privilege: give people the minimum access needed to do their job well
- Role-based access: assign permissions by role, not by one-off exceptions whenever possible
- Purpose limitation: connect access to a business use case, not personal curiosity
- Review cycles: revisit permissions as teams, responsibilities, and tools change
This also applies to infrastructure details around credentials and service connections. If your stack includes pipelines, warehouse roles, embedded analytics, or app integrations, teams need disciplined handling of secrets and tokens. A practical primer on secure API secrets management is useful here because governance breaks down quickly when access control at the data layer isn't matched by access control at the configuration layer.
The legal meaning of data user
In some environments, “data user” isn't just a broad operational label. It has legal force.
The Hong Kong Privacy Commissioner defines a data user as the entity that determines the purposes and means of processing personal data, with specific compliance obligations attached to that role in its guidance on data protection and related practices. That distinction matters because many teams casually use the term as if it only means “person looking at a dashboard.”

If your company processes customer data, user behavior, support transcripts, or account records, governance has to answer more than who can click into a report. It has to answer:
- Who determines the use case for the data
- What data should be collected for that purpose
- How long that data should remain available
- Which teams can work with raw records versus derived outputs
What works and what fails
What works is boring in a good way. Clear roles. Approved definitions. Auditable access. Shared ownership between data, product, engineering, and legal.
What fails is also predictable:
- Open access without context: people pull data they don't understand and create conflicting narratives
- Over-centralized gatekeeping: every request queues behind one analyst, so teams stop using data for daily decisions
- Policy without workflow fit: rules exist on paper but don't map to tools people use
Governance should feel like lane markings, not barricades. If people know what data they can use, why they can use it, and what obligations come with that access, adoption gets easier and risk drops.
The Modern Tech Stack for Empowering Data Users
A mature data stack doesn't exist to impress architects. It exists to help different data users do good work at the right level of abstraction.
That's why one of the most useful distinctions in modern analytics is between users who can access integrated datasets at the raw, unit-record level for research and users who consume only aggregated outputs and dashboards, as described by the Australian Bureau of Statistics in its explanation of data-user roles. The stack should support both without forcing either group into the wrong workflow.
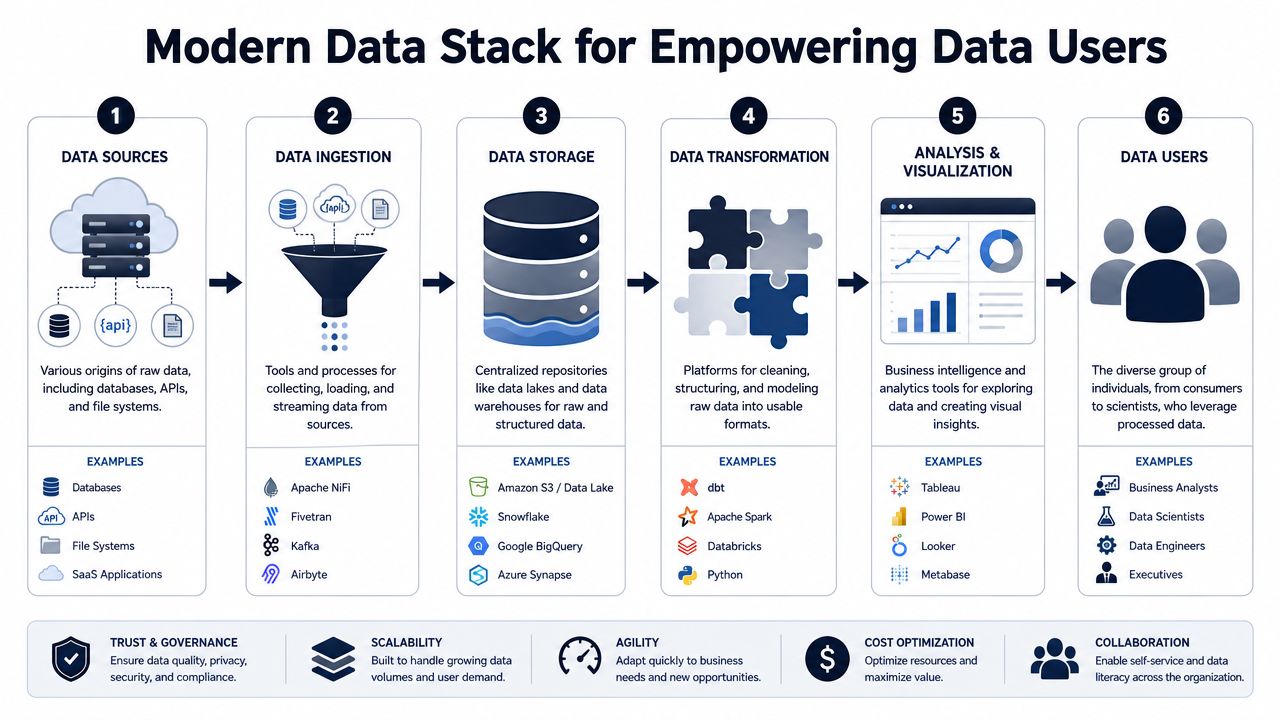
The stack by job to be done
Most SaaS environments have some version of these layers:
- Data sources: app databases, event streams, CRM, support platforms, billing tools, call transcripts, CSV exports
- Ingestion and movement: ETL or ELT tools, connectors, reverse ETL, streaming pipelines
- Storage: a data warehouse or lake where teams can centralize structured records
- Transformation: modeling layers that clean, join, and standardize business logic
- Analysis and delivery: BI tools, notebook environments, product analytics, and operational dashboards
The mistake is assuming one tool can serve every layer equally well.
A warehouse supports analysts and engineers. Tableau, Looker, or Power BI support business reporting. Product analytics platforms support behavioral exploration. Notebook workflows support experimental and statistical work. Product intelligence platforms sit closer to the operating decisions of product, support, and revenue teams because they tie qualitative and behavioral signals together.
If you're evaluating the warehouse layer for AI-heavy workflows, Zephony's insights on enterprise data for AI are useful because they focus on how centralized enterprise data supports downstream analysis and model use, which is often where SaaS teams start feeling architectural strain.
Self-serve without self-confusion
Self-serve analytics is useful only when the surrounding structure is strong enough to prevent everyone from inventing their own version of the truth.
That usually means:
- A trusted semantic layer: so “active customer,” “churn risk,” or “qualified expansion” don't shift from team to team
- Discoverable datasets: users can find what they need without asking three people in Slack
- Workflow-native delivery: insights show up where decisions happen, not just inside a BI tool
- Guardrails for exploration: enough freedom to ask questions, enough structure to keep answers consistent
Teams that want broader access without losing control should think carefully about self-serve analytics as an operating model, not just a dashboard rollout.
The best stack reduces the distance between a business question and a trusted answer.
How to judge whether the stack is helping
You don't need a giant scorecard to tell if the stack is working. Watch for operational signals.
If users can answer common questions without waiting on a specialist, your stack is doing its job. If analysts spend less time reconciling definitions and more time solving decision problems, the modeling layer is doing its job. If product and revenue teams can connect feedback, usage, and account impact in one workflow, the delivery layer is doing its job.
A strong stack serves the full spectrum. It doesn't force executives into raw data, and it doesn't trap analysts inside static dashboards.
How to Build a True Data-User Culture
Most companies don't have a tooling problem first. They have a behavioral one.
They buy warehouse capacity, BI licenses, and analytics platforms, then wonder why decisions still default to hierarchy or anecdote. The answer is usually simple. Access exists, but shared interpretation doesn't. That's why building a real data-user culture starts with operating habits, not software.
Democratize insight, not raw complexity
More access isn't automatically better. What teams need is a reliable path from evidence to action.
That means giving each user persona the right output for their role. Casual users need decision-ready views. Explorers need flexible slicing. Analysts need trustworthy source data. Leaders need a compact view of trade-offs with enough depth to challenge assumptions.
A data dictionary is one of the most effective tools here. Splunk describes it as a shared description of a dataset's meaning, relationships, origin, usage, and format in its overview of data dictionaries. In practice, that shared context prevents the quiet failure where sales, product, and finance all use the same metric name but mean different things.
Habits that actually change behavior
The teams that get this right usually do a few things consistently:
- Define ownership clearly: every important metric and dataset has someone responsible for quality and meaning
- Publish decision context: reports explain what a metric is for, not just how it moved
- Close the loop: product, support, revenue, and data teams review the same signals and decide what action follows
- Train by scenario: show people how to answer real business questions, not how to click around a tool
- Reward evidence use: recognize teams for making better decisions with data, not for producing more dashboards
What mature data culture feels like
In a healthy environment, people don't ask, “Who owns the numbers?” every meeting.
They know where trusted definitions live. They know which tool to use for which question. They know when they need raw detail and when they need a curated output. Above all, they know what action is expected once the evidence is clear.
That's the answer to what is a data user. It's not just someone who consumes information. It's someone equipped to turn data into a decision that improves the business.
If your team is trying to connect customer feedback, behavioral data, and revenue impact in one operating workflow, SigOS is worth a look. It's an AI-driven product intelligence platform that helps product, support, and growth teams turn fragmented customer signals into prioritized actions, so data users across the business can work from the same evidence instead of competing anecdotes.
Keep Reading
More insights from our blog


Ready to find your hidden revenue leaks?
Start analyzing your customer feedback and discover insights that drive revenue.
Start Free Trial →