SaaS Analytics Platform: Drive Product Growth
Discover how a SaaS analytics platform drives product insights, from behavior to revenue. See capabilities, ROI, selection, & best practices.
On Monday morning, the product manager has three tabs open before the first meeting starts. Mixpanel shows a drop in activation. Zendesk is full of tickets about a confusing workflow. Finance wants to know whether the issue is big enough to justify moving an item to the top of the roadmap. Nobody can answer the one question that matters most: what is this problem worth in lost or protected revenue?
That's where a SaaS analytics platform changes the conversation. Instead of treating usage data, customer feedback, and revenue metrics as separate worlds, it helps teams connect them. The hard part isn't collecting more data. Most SaaS teams already have plenty. The hard part is translating scattered signals into decisions the product, support, success, and revenue teams can act on together.
Introduction and Market Trends
A lot of teams still work with disconnected systems. Product looks at feature usage. Support reads complaint trends. Revenue teams track expansion and churn in a different tool. The result is familiar: everyone sees part of the story, but nobody owns the full picture.
That gap matters more now because SaaS companies are building in a market that keeps getting more data-heavy and more cloud-native. The global SaaS-based Business Analytics market was valued at USD 16.26 billion in 2024 and is projected to reach USD 18.53 billion in 2025, growing at a 13.94% CAGR, according to 360iResearch's SaaS-based business analytics analysis. That growth reflects a simple reality: companies want analytics that more people can use without waiting on a central data team.
A modern platform doesn't just report what happened. It helps teams ask better questions. Which complaint pattern appears before churn? Which feature request tends to show up in accounts that later expand? Which customer segment hits friction during onboarding?
For teams exploring how customer data gets unified across product and support workflows, this guide to customer insights platforms is a useful companion. If your stack also depends on stronger discovery across growing data estates, Surnex AI search solutions offer another helpful reference point for how SaaS teams make information easier to find and act on.
The biggest analytics problem in SaaS usually isn't missing dashboards. It's missing context between behavior, feedback, and money.
Understanding Core Capabilities of SaaS Analytics
A good SaaS analytics platform does three jobs at once. It watches what users do, measures how often and how extensively they use the product, and absorbs what they say in tickets, chats, surveys, and calls.
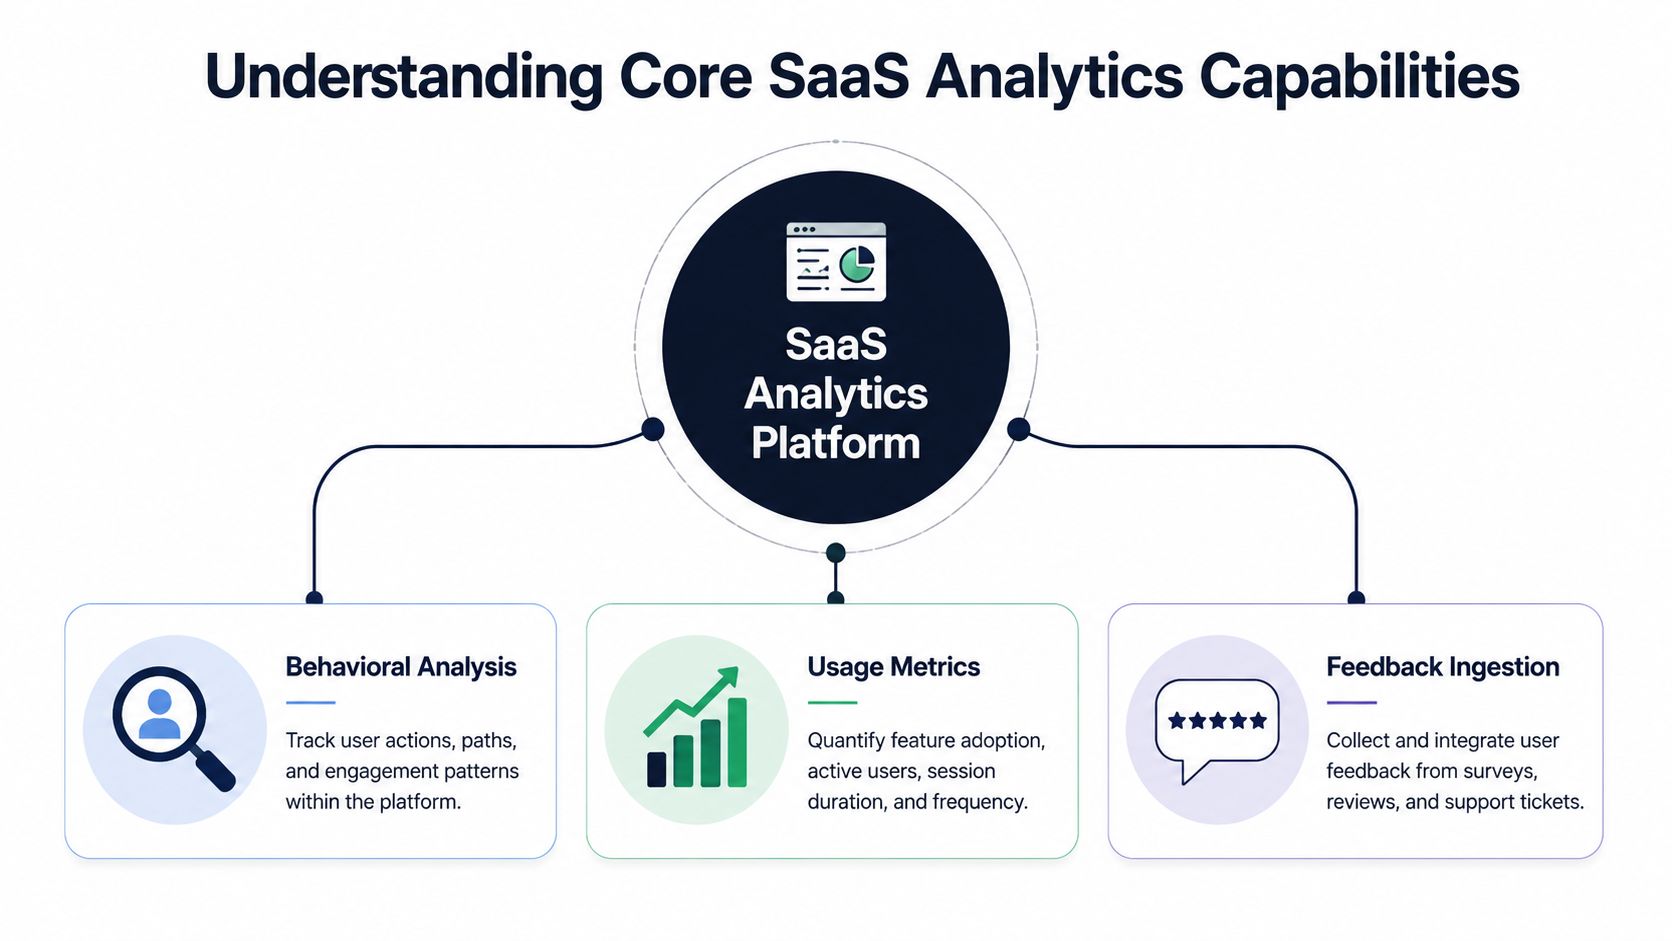
Behavioral Analysis
Behavioral analysis is the “path” view. Imagine watching shoppers move through a store. You're not only checking whether they bought something. You're watching where they paused, what aisle they skipped, and where they turned around and left.
In SaaS, that means looking at flows such as signup, onboarding, activation, upgrade, and renewal-related activity. If users consistently abandon a setup step, that's not just a UX issue. It may be an early warning sign for lower retention.
Behavioral data is especially useful when teams want to answer questions like:
- Where users stall: Which step in onboarding causes accounts to drop off.
- What drives stickiness: Which sequence of actions shows that a team has adopted the product.
- How friction spreads: Whether repeated failed actions cluster around one feature or customer segment.
Usage Metrics
Usage metrics are the “volume and frequency” view. If behavioral analysis shows the route, usage metrics show the intensity. How often are customers logging in? Which features are used repeatedly? Which ones get touched once and then ignored?
These metrics help teams avoid a common mistake. A feature can look impressive in a release note and still have weak real-world adoption. Conversely, a quiet utility feature can be central to retention because customers use it every day.
A practical way to think about usage metrics is to separate them into layers:
| Metric layer | What it tells you | Example question |
|---|---|---|
| Activity | Whether people are showing up | Are target accounts returning regularly? |
| Feature adoption | Which capabilities matter | Did customers actually use the new workflow? |
| Depth | How embedded the product is | Are users doing one action, or building habits? |
If your team is still maturing from dashboard consumption toward broader exploration, this primer on self-serve analytics can help frame what non-technical teams need from reporting tools. And if speed matters because your workflows depend on immediate reactions rather than end-of-day reports, this overview of real-time analytics for SaaS is worth reading.
Feedback Ingestion
Feedback ingestion is where many platforms get shallow. They'll collect survey answers or ticket tags, but they won't help you connect those comments to actual outcomes.
That's a problem because the most revealing information in SaaS often sits in messy text. A support ticket might describe a billing confusion that never appears in a product event log. A sales call might reveal a missing capability that blocks expansion. A chat transcript might show frustration long before an account churns.
Practical rule: If your analytics tool can't ingest qualitative feedback alongside usage and account context, it can't tell you which complaints are expensive.
When feedback ingestion works well, teams can group themes across tools like Zendesk, Intercom, CRM notes, and call transcripts. Then they can compare those themes against behavior and account outcomes. That's how a platform moves from “people mention this issue often” to “this issue appears in accounts that later downgrade, cancel, or expand.”
Measuring Business Value and ROI
Most ROI conversations about analytics are too vague. Leaders ask whether the platform “helps decision-making,” and the answer becomes a feature tour. A better approach is to tie the platform to avoided loss, achieved growth, and saved team effort.
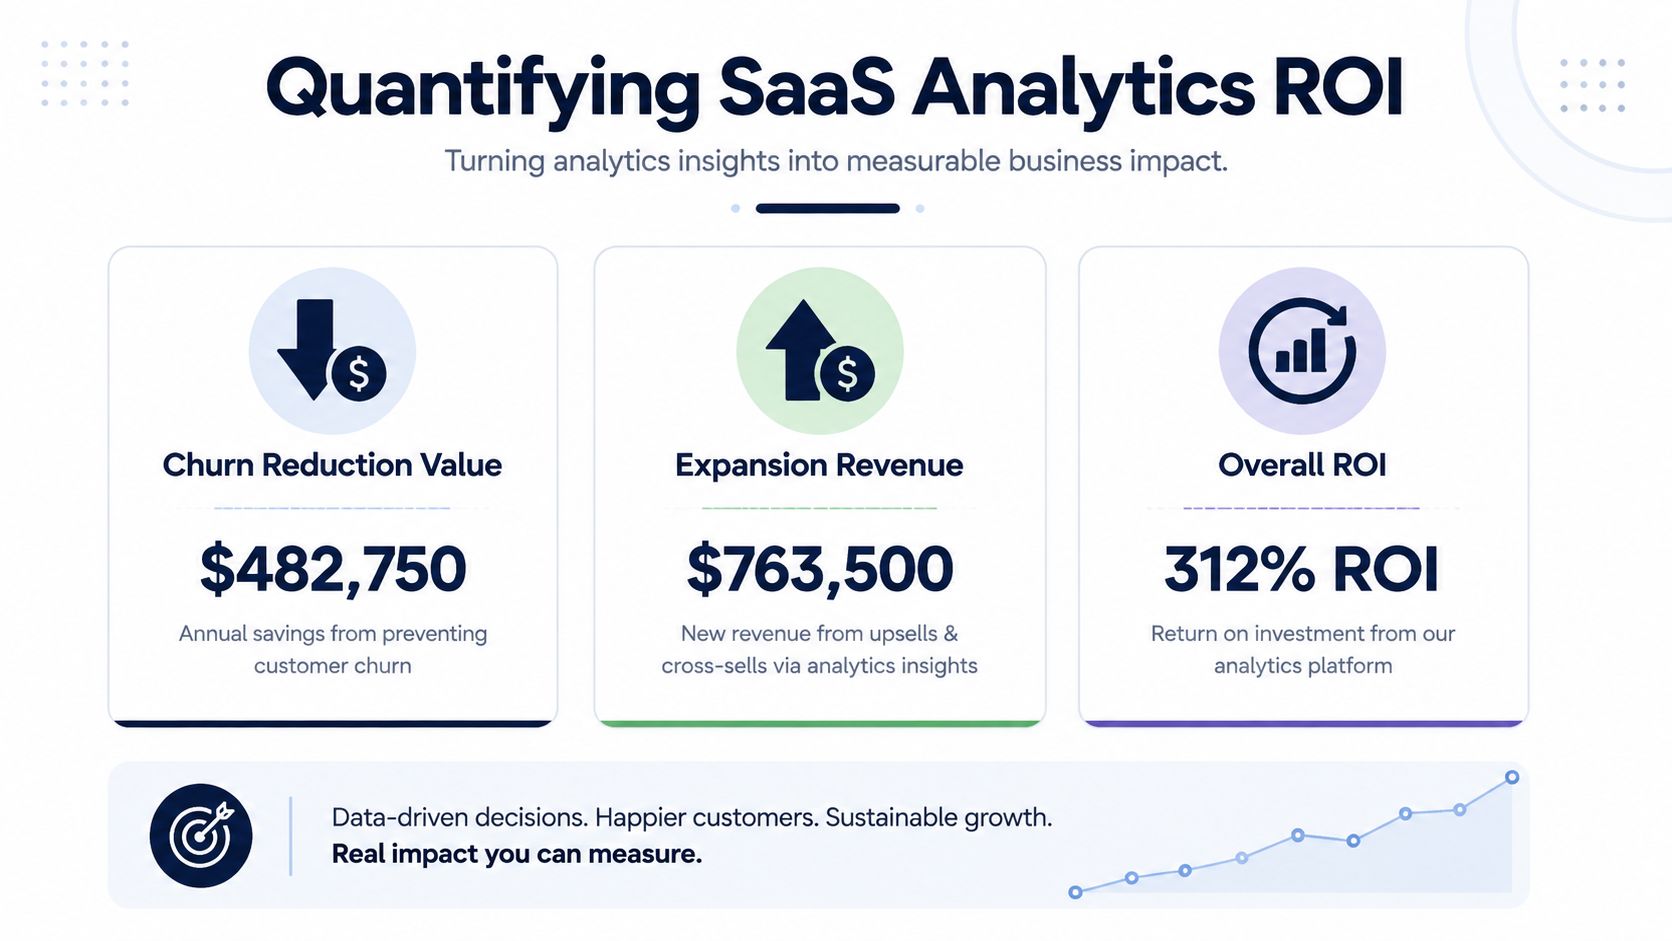
The sharpest reason this matters is that 87% of product teams struggle to prioritize features based on revenue impact rather than volume of requests, according to UseDaymark's review of SaaS data analysis tools. That means many teams still choose roadmap work by noise level instead of business value.
A Simple ROI Lens
Start with three buckets:
- Revenue protectedValue preserved when you identify churn risk early enough to intervene.
- Revenue expandedValue created when analytics surfaces requests or usage patterns tied to upsell, cross-sell, or plan growth.
- Operational efficiencyTime saved when teams stop manually stitching together support data, product data, and account context.
If you need a structured way to model those assumptions for stakeholder review, this return on investment template gives a practical format.
How Teams Can Estimate Impact
You don't need invented benchmark numbers to build a useful model. You need a disciplined process.
Use a worksheet like this:
- List the issue theme: For example, onboarding confusion, export errors, or billing friction.
- Identify affected accounts: Pull the customers connected to that issue through support logs, product events, or CRM notes.
- Check outcome patterns: Did those accounts churn, shrink, renew slowly, or request capabilities tied to expansion?
- Estimate decision value: Ask what would change if your team could act on that issue sooner and with more confidence.
A product team might discover that a feature request appears mostly in high-value sales conversations, not in broad survey volume. A customer success team might find that a certain ticket cluster repeatedly appears before renewal concerns. A support leader might notice that one bug generates heavy internal triage work and repeated customer frustration.
Mini Scenarios That Clarify ROI
Consider three plain-language examples.
Scenario one. Support sees recurring complaints about permissions. Product initially treats them as edge cases because the request count is modest. Once those tickets are tied to account health and renewal notes, the issue looks less like a UX nuisance and more like retained revenue.
Scenario two. Sales keeps hearing a request for a reporting feature. Product avoids it because only a handful of deals mention it. But when the team links those conversations to pipeline quality and expansion potential, the request earns a different priority.
Scenario three. Engineering receives scattered bug reports from multiple channels. Individually, each report looks small. Grouped together with usage context, the bug affects an important workflow that active accounts rely on.
Revenue-centric analytics doesn't replace product judgment. It gives product judgment a financial frame.
How to Choose the Right SaaS Analytics Platform
Buying a SaaS analytics platform isn't only about dashboards. It's about whether the tool can connect the systems your team already uses and whether it stays affordable once implementation work begins.
The broader SaaS market reached USD 315.68 billion in 2025 and is projected to grow to USD 1,482.44 billion by 2034, while the analytics niche is growing at a 19% CAGR, according to Fortune Business Insights on the SaaS market. In a market moving that fast, buyers need a sharper rubric than “has good charts.”
The Evaluation Rubric
Focus on the criteria that determine whether the platform can bridge qualitative feedback to revenue outcomes.
| Criteria | Weight | SigOS Score |
|---|---|---|
| Integration with product, billing, CRM, and support data | High | Strong |
| Qualitative feedback ingestion | High | Strong |
| Revenue correlation across feedback and behavior | High | Strong |
| Real-time or near-real-time alerting | Medium | Strong |
| Explainability of AI outputs | High | Moderate to strong |
| Security controls and privacy posture | High | Strong |
| Dashboard usability for non-technical teams | Medium | Strong |
| Total cost of ownership beyond license price | High | Evaluate carefully |
A few notes matter more than the score labels.
What Buyers Often Miss
First, check whether the platform can handle both structured and unstructured data. Many tools are solid at event tracking but weak at support tickets, call summaries, and free-text feedback.
Second, ask how the vendor ties insights to revenue. “AI-powered” is too vague. You want to know whether the system summarizes comments or helps connect themes to churn, expansion, or account value.
Third, test workflow fit. Can insights flow into Jira, GitHub, Linear, Slack, CRM tasks, or customer success playbooks without manual copy-paste?
For teams comparing adjacent categories, HuntingAlice's platform buyer's guide offers a useful example of how to think rigorously about vendor evaluation rather than relying on marketing pages alone.
Where SigOS Fits
One option in this category is SigOS, which combines behavioral analysis, support and conversation ingestion, and revenue-impact scoring so teams can prioritize issues based on business outcomes rather than request volume. That makes it especially relevant for teams trying to connect feedback themes with churn or expansion signals.
Implementation Essentials and Security Checks
Implementation is where many analytics projects become expensive. Not because the software fails, but because the surrounding work expands. Teams have to connect product logs, support systems, billing records, CRM objects, permissions, and reporting logic.
That hidden work is why many companies underestimate implementation costs by 340–580% when maintenance, integration complexity, and opportunity costs are included, according to SaaS Hero's guide to choosing a SaaS analytics platform.
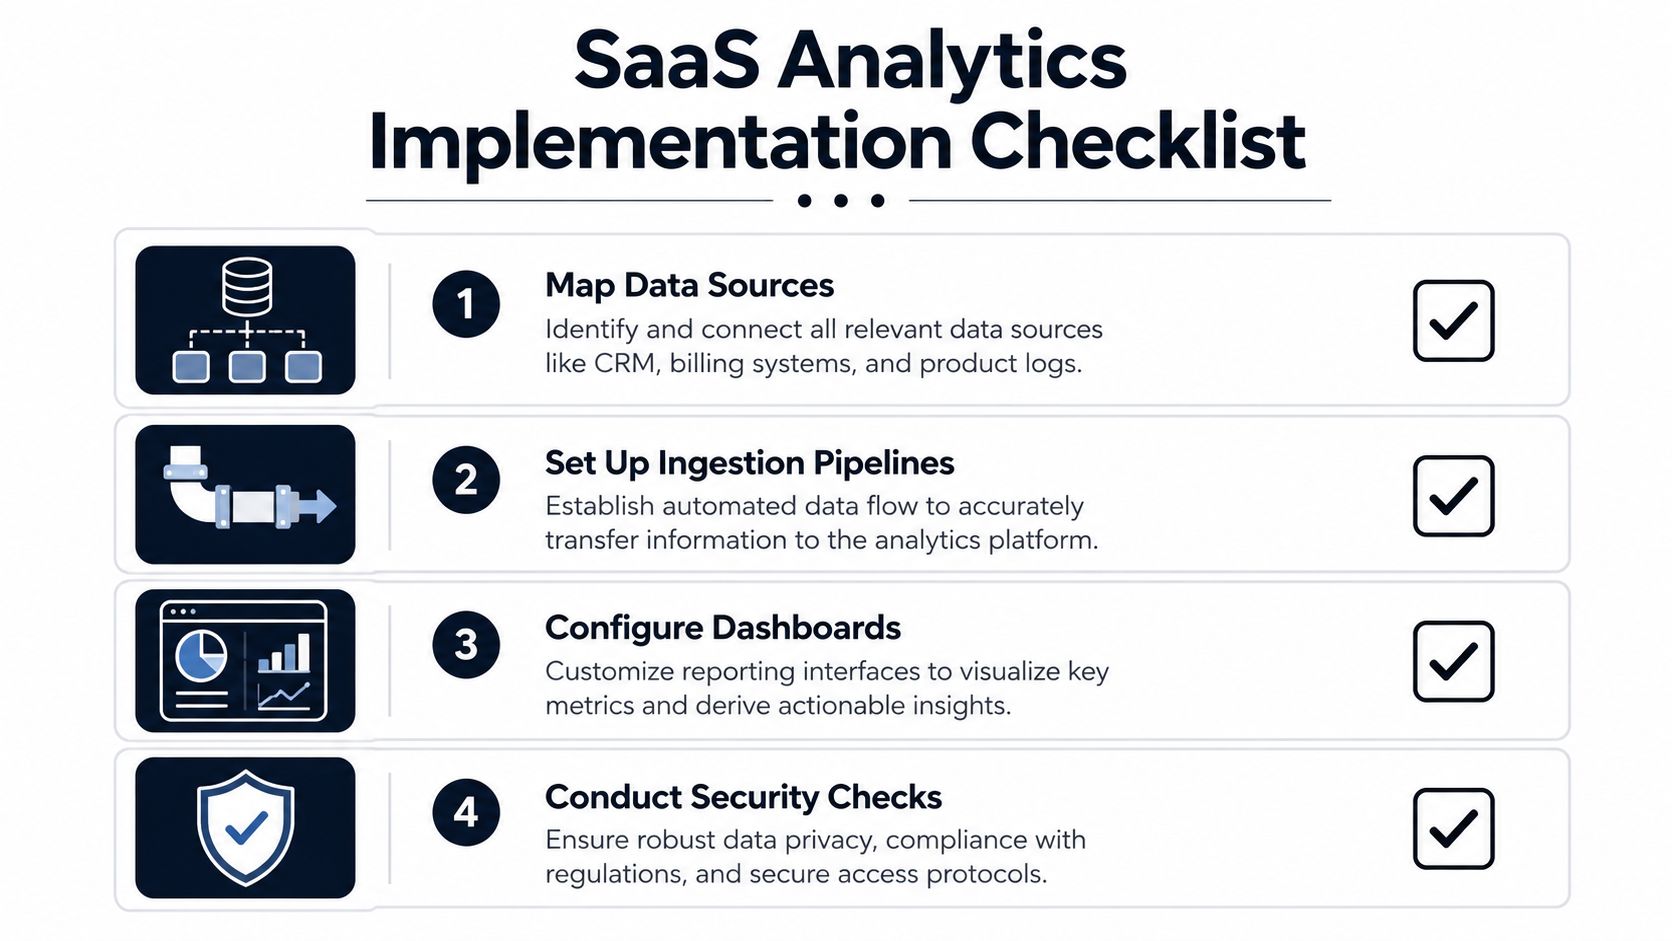
A Practical Launch Checklist
You can reduce that risk with a tighter rollout plan.
- Map the systems firstList every source that shapes customer truth: product events, billing, CRM, support, chat, call notes, and issue trackers. Don't start with the dashboard. Start with the data relationships.
- Define a common account keyMany projects break because one tool tracks users, another tracks workspaces, and another tracks companies. Decide how records should join before data starts flowing.
- Set up ingestion in stagesConnect one high-value workflow first. For many SaaS teams, that's support plus product usage. Then add billing and CRM context so teams can connect pain points to outcomes.
- Build decision dashboards, not vanity dashboardsA useful dashboard should help someone answer “what needs action now?” That's better than showing every metric available.
Security Checks at Each Step
Security shouldn't be a final review. It belongs inside each implementation step.
- During source mapping: Confirm which systems contain sensitive customer information and whether all fields need to be ingested.
- During identity mapping: Review who can access account-level details and whether role-based access is enforced.
- During pipeline setup: Verify encryption at rest and in transit, and document where data moves.
- During dashboard rollout: Limit broad access to sensitive revenue or conversation data unless the role requires it.
Treat implementation scope like product scope. Every extra integration adds value only if someone will use the resulting insight.
Watch the Hidden TCO Signals
Hidden total cost of ownership usually comes from four places:
| Hidden cost area | What it looks like |
|---|---|
| Data cleanup | Teams manually fix mismatched records |
| Pipeline upkeep | Internal owners babysit connectors and schemas |
| Access sprawl | More users see data than necessary |
| Workflow drift | Insights exist, but nobody acts on them consistently |
If you catch those early, your SaaS analytics platform stays useful instead of turning into another expensive reporting layer.
Integrating SaaS Analytics into Your Workflow
A platform only becomes valuable when it changes daily behavior. If insights stay inside a dashboard that people check once a week, the tool becomes reference material instead of an operating system.
Here's a workflow many SaaS teams recognize.
Support tickets enter Zendesk throughout the day. Customers describe bugs, confusion, missing capabilities, and account-level friction in their own words. The analytics platform ingests those tickets, groups similar issues, and compares them with product behavior from the application itself. It then adds account context from the CRM and subscription context from billing.
A Day in the Loop
By the afternoon, the product team can see that a cluster of complaints isn't random. The same accounts also show a repeated drop-off in a key workflow. Customer success notices that some of those accounts are coming up for renewal. Instead of debating whether the issue is “loud,” the teams can treat it as a coordinated signal.
The next step is workflow automation.
- Support handoff: A pattern from Zendesk gets tagged for product review.
- Team notification: An alert in Slack or Intercom tells account owners which customers may be at risk.
- Issue creation: A Jira or GitHub ticket is created with the supporting evidence attached.
- Follow-up: Customer success reaches out to affected accounts with context instead of a generic check-in.
Why This Matters Cross-Functionally
Each team sees a different slice of the same account.
Product sees usage friction.Support sees complaint language.Success sees renewal risk.Sales sees upgrade potential.
A strong SaaS analytics platform connects those views without forcing each function to become an analyst. The value isn't just speed. It's consistency. People stop making roadmap or retention decisions from isolated anecdotes.
A healthy operating rhythm often looks like this: morning alert review, weekly issue clustering, roadmap prioritization tied to account impact, and renewal planning informed by observed product friction. Once analytics is integrated that way, the platform becomes part of the team's routine rather than a side tool.
Real World Use Cases of AI Driven Intelligence
AI matters here when it helps teams sort signal from noise, not when it writes a generic summary. The most useful systems connect behavior, feedback, and account outcomes in ways that would take humans too long to piece together manually.
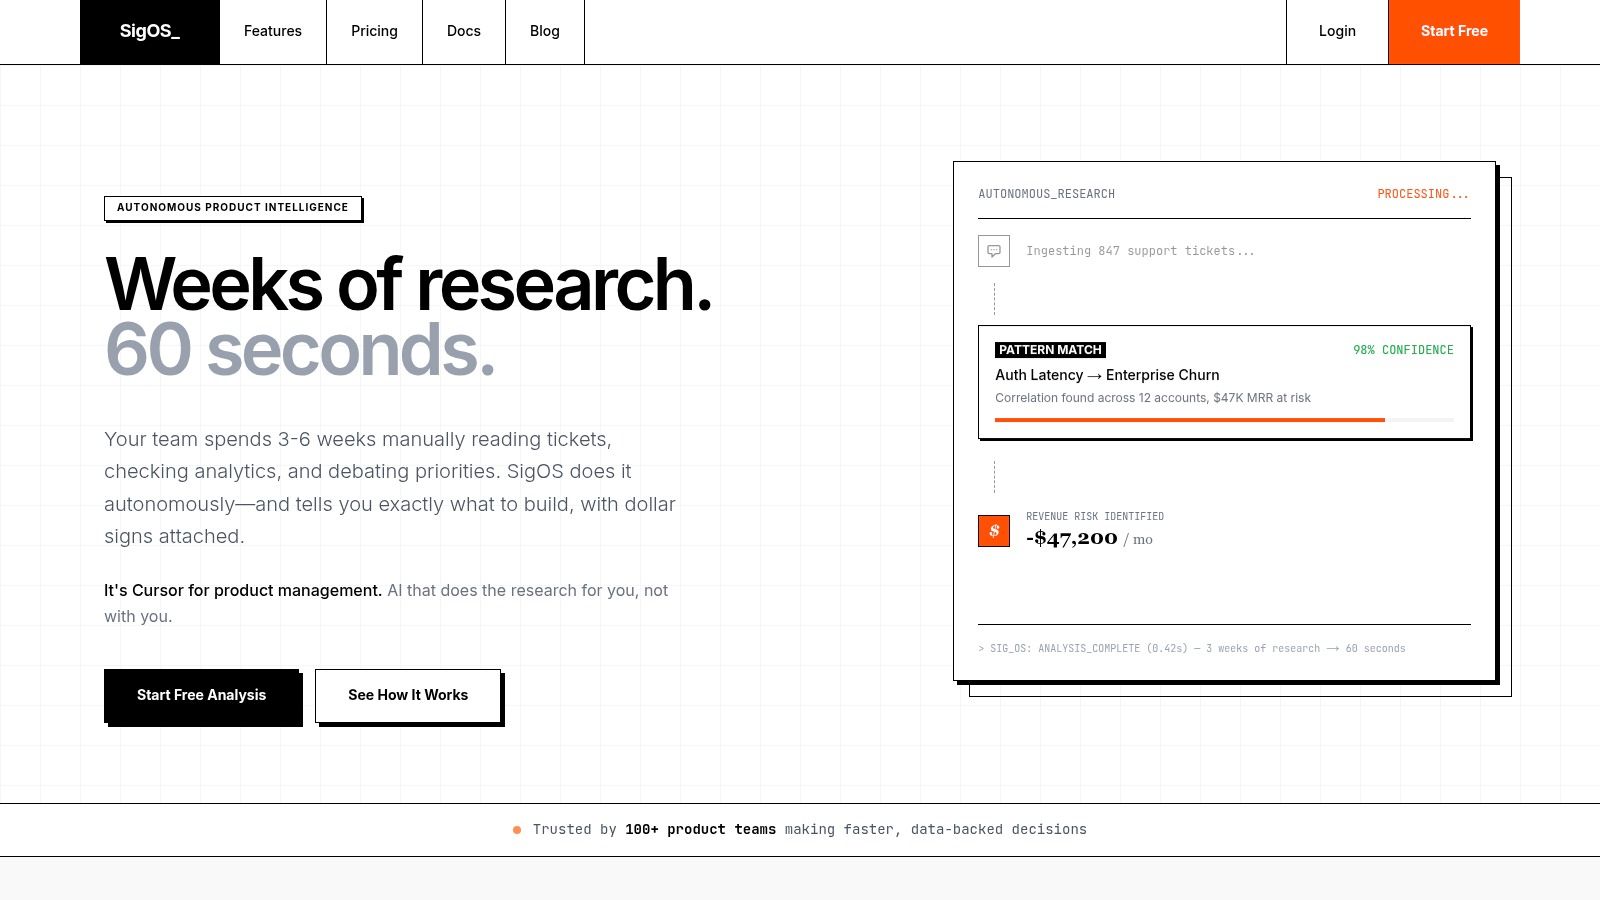
A visual example helps show what that kind of workspace looks like in practice.
Use Case One
A growth team keeps hearing the same request from prospects and larger accounts. On its own, that request doesn't dominate support volume, so it sits low in the backlog. Once the team reviews account behavior and revenue context together, the pattern changes meaning. The request isn't common across all users. It's common among accounts with strong expansion potential.
AI-assisted grouping proves beneficial. It can surface that a small but valuable segment is asking for the same capability in different words across tickets, chats, and calls. Without that grouping, the request looks scattered.
Use Case Two
A customer success team wants earlier warnings before renewal conversations go sideways. Product event data alone shows less activity, but less activity can mean many things. When the team layers in support conversations and friction themes, the picture becomes clearer. Some accounts aren't disengaging because they've lost interest. They're stuck in a workflow and asking for help repeatedly.
That distinction changes the response. Success doesn't need a generic nurture motion. It needs a targeted save plan tied to the actual problem.
Good AI in analytics should narrow the decision, not widen the mystery.
Use Case Three
A product team has a backlog full of bugs. The loudest ones aren't always the most costly. Some bugs generate a lot of comments from a few vocal users. Others appear subtly across important accounts and affect a critical path tied to retention or expansion.
Correlation is most critical. According to the publisher information provided for this article, SigOS is built to connect support tickets, chat transcripts, sales calls, and usage metrics with churn and expansion outcomes, with 87% correlation accuracy and sub-minute analysis times. Used well, that sort of capability gives teams a more disciplined way to rank work by likely business impact rather than by complaint count alone.
A short walkthrough can make that easier to picture.
Why AI Evaluation Needs a Different Standard
Most buyers ask whether the platform has AI. That's the wrong question. Better questions are:
- Can it connect qualitative feedback to account outcomes?
- Can it explain why a theme matters?
- Can teams act on the result inside their existing workflow?
- Can security teams trust how customer data is handled?
If the answer to those questions is weak, the AI layer is mostly decoration. If the answers are strong, the platform becomes a practical product intelligence system.
Conclusion and Next Steps
Many SaaS teams assume they already “have analytics” because they have dashboards. That assumption breaks down when nobody can tie a support theme, feature request, or repeated complaint to churn risk or expansion value.
Audit your current setup. Check whether your tools can connect behavior, feedback, and revenue. Then score your options with a TCO lens, not just a feature lens. Build a basic ROI model, test one workflow that matters, and run a proof of concept around a real product or retention question. That's how a SaaS analytics platform moves from reporting to decision support.
If your team wants to connect customer feedback, usage signals, and revenue impact in one workflow, take a look at SigOS. It's designed for SaaS teams that need to prioritize product work based on what customer issues and requests are costing or providing benefits.
Keep Reading
More insights from our blog



Ready to find your hidden revenue leaks?
Start analyzing your customer feedback and discover insights that drive revenue.
Start Free Trial →