SaaS Revenue Optimization Playbook for 2026
Stop guessing. Learn a practical revenue optimization framework for SaaS. Find revenue leaks, quantify impact, & prioritize fixes that grow your NRR.

The challenge for teams isn't a roadmap problem. It's a translation problem.
Support is closing tickets in Zendesk. CSMs are logging renewal risk in Salesforce. Product is shipping from Jira. Growth is watching expansion opportunities stall for reasons that sound familiar but never become concrete enough to win roadmap priority. The same phrases keep showing up: “confusing setup,” “export failed,” “needs SSO mapping,” “can't trust the dashboard,” “we'll revisit this next quarter.”
That work feels productive. It often isn't revenue optimization.
In SaaS, product friction now carries more financial weight because the market has expanded fast and pricing is shifting toward actual usage. The SaaS market grew from **152 billion in 2021 to a projected **312 billion in 2026, and 61% of new SaaS products now use some form of consumption-based pricing, according to Zylo's SaaS statistics roundup. When customers pay closer to value received, every blocked workflow, broken report, and delayed activation event has a more direct path to lost revenue.
The practical question isn't whether customer feedback matters. It does. The question is whether your team can convert messy feedback into a ranked list of revenue risks and expansion opportunities that engineering can act on this sprint.
Why Your Roadmap Might Be Leaking Revenue
A roadmap leaks revenue when feature priority is driven by volume, opinion, or executive visibility instead of business impact.
That usually happens in companies that are doing plenty of work. Product ships. Support responds. Sales logs objections. Customer success escalates issues. But nobody can answer a simple question with confidence: which bug, friction point, or feature gap is costing the business the most money right now?
Shipping work isn't the same as protecting revenue
Teams often assume that a busy roadmap means value is being created. It doesn't. A roadmap can be full and still miss the issues that block renewals, suppress usage, or kill expansion conversations.
The problem gets worse when pricing becomes more sensitive to adoption. In usage-based environments, customer experience issues don't just create dissatisfaction. They suppress the very usage patterns revenue depends on. That's one reason product leaders should revisit product-market-fit signals regularly, not just at launch. Rite NRG's product market fit guide is a useful refresher if your team is still treating fit as a one-time milestone instead of an operating lens.
A strong roadmap process helps, but process alone won't fix weak prioritization logic. If your current planning ritual still starts with stakeholder requests and anecdotal urgency, it's worth reviewing a more structured product roadmap development approach.
Practical rule: If a team can't explain how a roadmap item affects retention, expansion, or activation, it's still a bet. That doesn't make it wrong. It just means it shouldn't be treated as obvious.
The blind spot is qualitative feedback
Most revenue leakage starts as text before it shows up in churn.
A customer says onboarding took too long. A support agent tags a recurring export failure. A sales rep notes that procurement won't move forward without audit logs. A success manager hears that a team achieved value in one module but can't roll out the next because permissions are too rigid. Those aren't disconnected anecdotes. They're raw inputs for revenue optimization.
The teams that get this right stop treating qualitative feedback like a side channel. They treat it like an operating dataset.
Diagnosing Revenue Leakage in Your Qualitative Data
Aggregate churn is useful, but it's late. By the time churn appears in a dashboard, the actual signal has already passed through support tickets, account notes, call transcripts, and product behavior.
That's where revenue leakage shows up first.
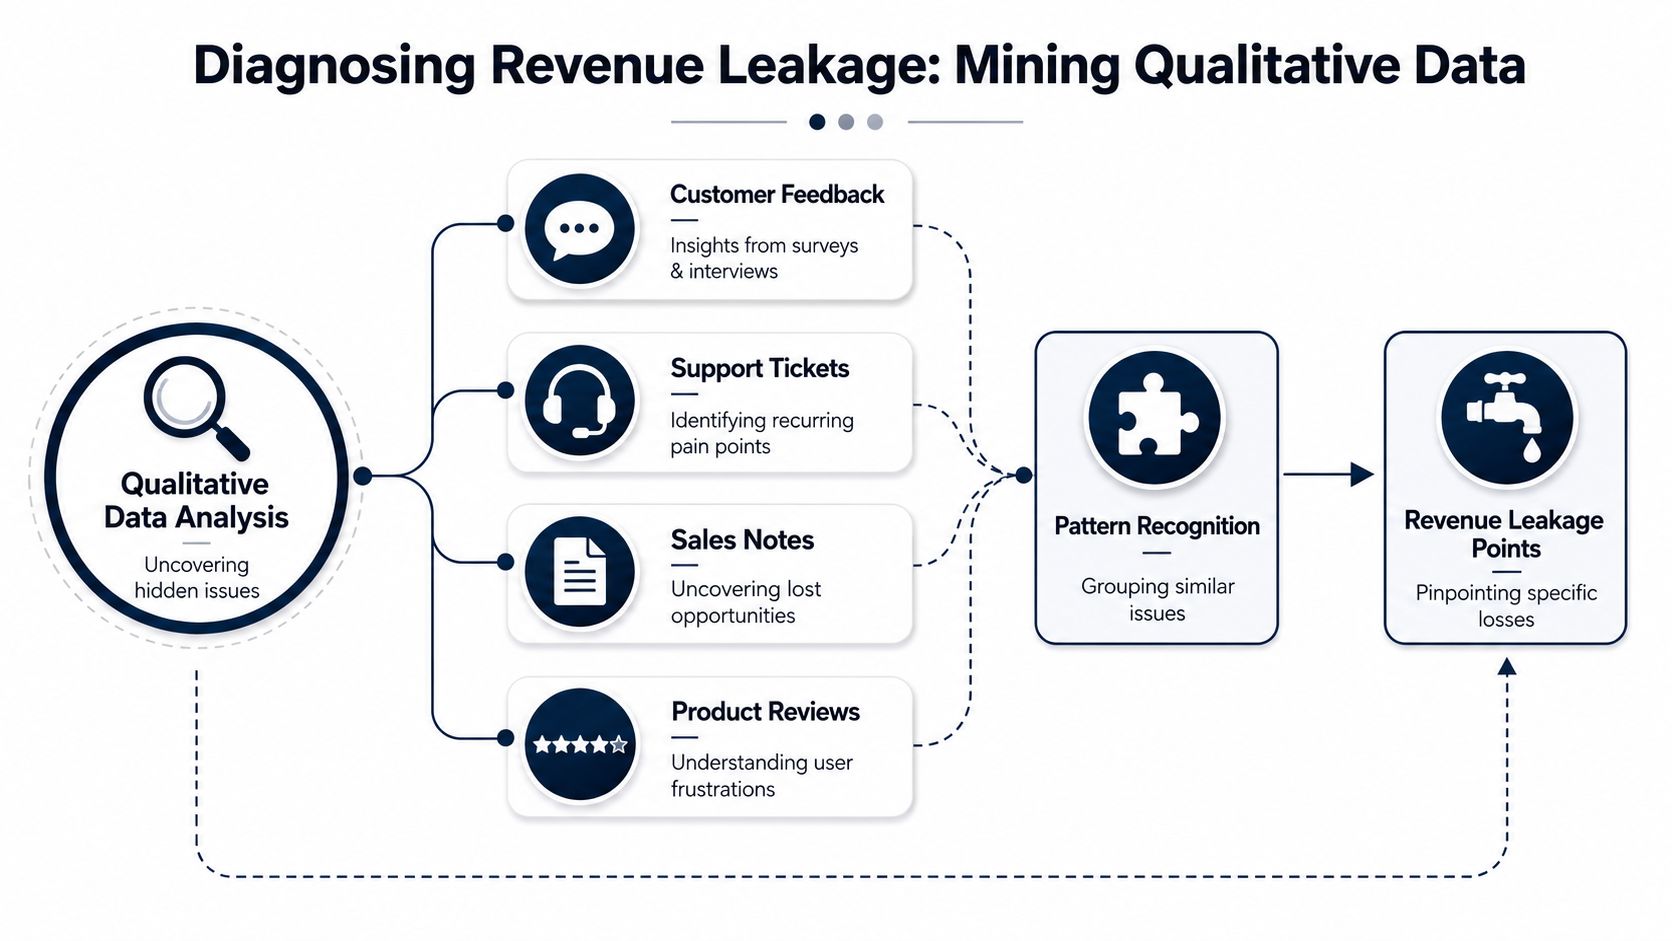
Start where customers complain in their own words
Many organizations already have the data. They just don't analyze it with commercial intent.
The useful sources are usually:
- Zendesk and Intercom conversations: Recurring bug reports, confusing workflows, unresolved workarounds, and phrases that indicate trust erosion.
- Sales call notes and CRM fields: Patterns in stalled deals, security objections, missing integrations, procurement blockers, or competitor comparisons.
- CSM and renewal notes: Language around delayed rollout, weak adoption, power-user dependence, or failed executive reporting.
- Public reviews and community posts: Repeated complaints are often cleaner in public because customers explain pain in plain language.
The challenge isn't collection. It's prioritization. According to K38 Consulting's analysis of SaaS revenue optimization, 87% of product teams struggle to prioritize feedback due to noise, and most guidance still doesn't show how to connect support and sales feedback to hard revenue metrics.
Mine for patterns, not anecdotes
Single tickets can be misleading. Repeated clusters rarely are.
Teams need a taxonomy that's built for business impact, not just support operations. Instead of broad tags like “bug” or “feature request,” classify feedback into categories that can later be tied to money:
| Feedback pattern | What it usually signals |
|---|---|
| Onboarding friction | Delayed activation and slower expansion potential |
| Reliability complaints | Trust loss, renewal risk, blocked product usage |
| Reporting gaps | Lower executive visibility and weaker account stickiness |
| Integration requests | Expansion blockers in larger accounts |
| Permission or security issues | Procurement friction and enterprise deal risk |
That kind of categorization is far more useful than a flat backlog of requests.
Look for revenue-adjacent language
Some phrases should trigger immediate review, even before scoring.
Examples include:
- “We can't roll this out broadly” because that often points to blocked seat growth or blocked usage growth.
- “We built a manual workaround” because workarounds hide pain until renewal.
- “This came up in procurement/security review” because late-stage friction is expensive.
- “Our team stopped using that workflow” because dropped usage often precedes churn or lower expansion.
A lot of teams miss these patterns because support, product, and growth review data in separate meetings. That separation creates blind spots. A better operating habit is a shared weekly review of tagged qualitative signals, ideally paired with a workflow for analyzing customer feedback in a way product, success, and growth can all use.
The ticket queue is not just a service function. It's a live feed of friction inside your revenue engine.
Diagnose by account context
Not all friction is equal. The same bug means different things depending on who hits it.
A reporting issue affecting trial users is not the same as a permissions issue blocking rollout in a multi-team enterprise account. A CSV export complaint from a low-touch account may be annoying. The same complaint from an account preparing a quarterly board pack can be a renewal problem.
That's why diagnostic work needs account context attached early:
- Which segment is affected
- Which workflow is blocked
- Whether the issue appears before activation, before renewal, or before expansion
- Whether the affected accounts are asking for more seats, more usage, or deeper rollout
Without that context, backlog grooming turns into pattern recognition without consequence. With it, you can start converting noise into prioritizable business risk.
Quantifying Problems with Revenue Impact Scoring
Once you've grouped the signals, the next step is assigning a Revenue Impact Score to each issue. At this point, many teams stop too early. They identify a pattern, agree it matters, and then still prioritize by instinct.
That wastes the hard part.
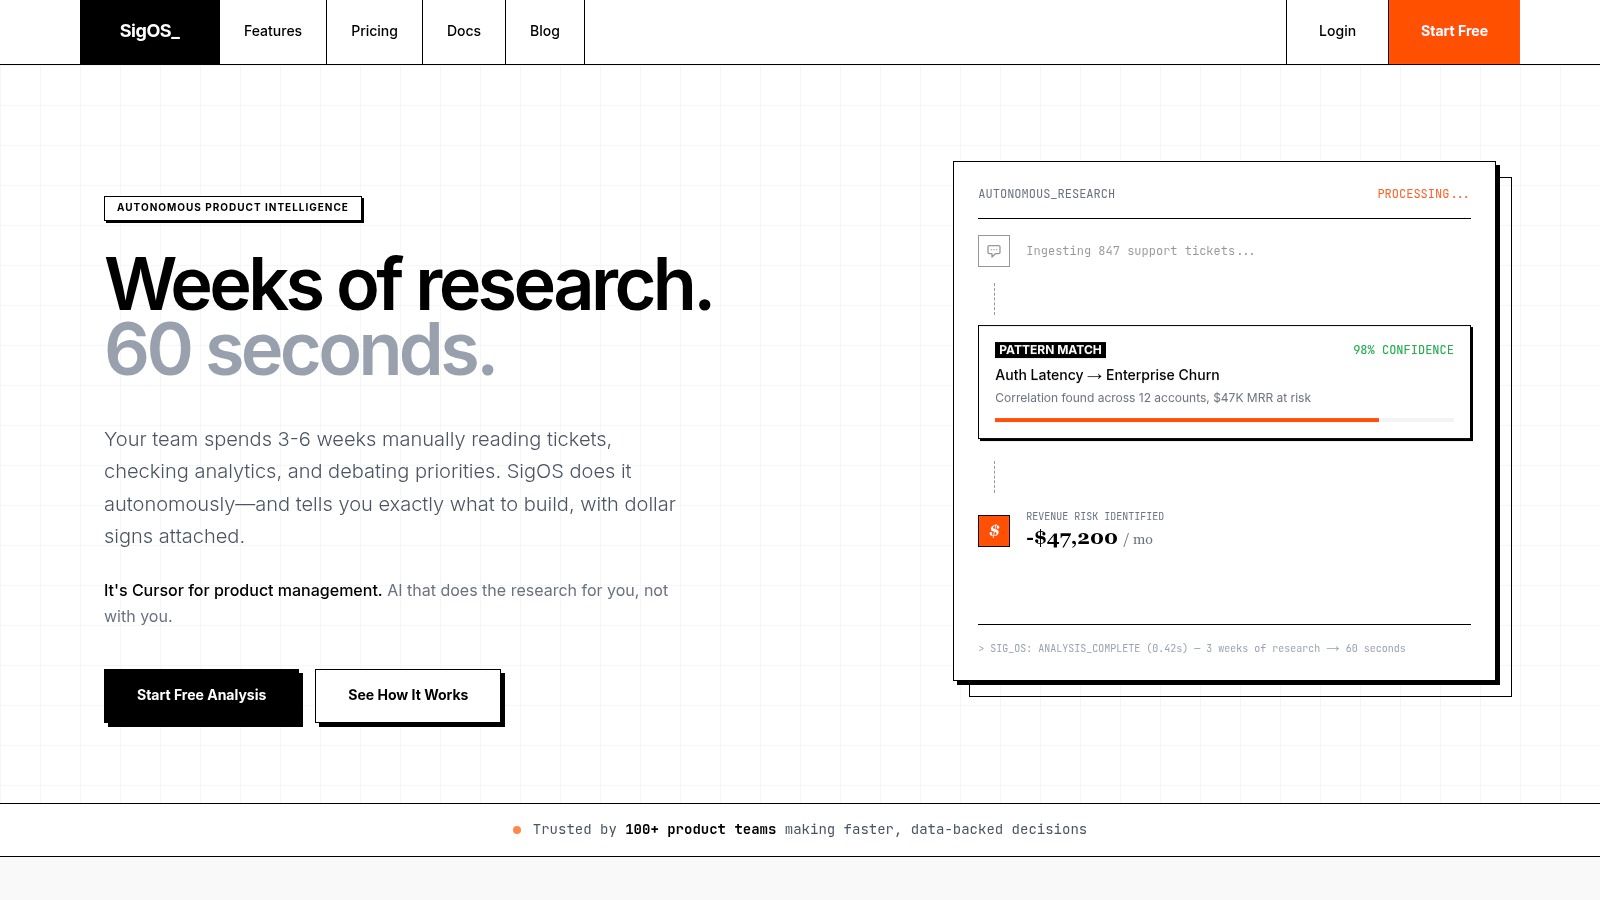
What a usable score actually includes
A Revenue Impact Score shouldn't pretend to be perfect finance. It should be directional, operational, and consistent enough to influence sprint planning.
The score usually combines four inputs:
- Account value: The ARR or commercial importance of affected accounts.
- Journey stage: Whether the issue threatens activation, renewal, or expansion.
- Severity of workflow blockage: Minor annoyance, degraded workflow, or hard blocker.
- Signal density: Whether this is isolated or recurring across support, sales, and usage data.
In practice, I prefer a scorecard that product can understand at a glance inside Jira or Linear. If finance needs a cleaner estimate later, that can happen after prioritization. The first job is helping teams decide what deserves engineering attention now.
A concrete workflow from text to dollars
Here's the operational flow that works:
- Collect the raw signal from Zendesk, support email, Gong notes, or CSM comments.
- Group similar reports under one issue family, such as “dashboard export timeout” or “SCIM provisioning confusion.”
- Attach affected accounts and segment data.
- Check business context. Is this linked to renewal risk, delayed rollout, or blocked expansion?
- Assign a revenue class such as retention risk, expansion opportunity, or acquisition friction.
- Push the result into Jira with enough context for a PM and engineering lead to make a decision fast.
This is one place where tooling matters. Some teams stitch it together with spreadsheets, Zendesk exports, CRM notes, and BI dashboards. That works for a while. Others use product intelligence tools such as SigOS to ingest support, chat, sales, and usage signals, then attach revenue-oriented context before creating issues in Jira or GitHub.
A complaint becomes roadmap-worthy when you can tie it to a commercial outcome, not when it gets repeated loudly enough.
Don't confuse issue volume with issue value
A common mistake is over-prioritizing the most frequent complaint.
Frequency matters, but it's not enough. One issue affecting a strategically important account or blocking a high-intent expansion can matter more than a larger pile of low-stakes tickets. This is the same logic teams use when they calculate data downtime costs. The raw outage isn't the whole story. The business cost depends on where it hits, how long it lasts, and what it blocks.
The same principle applies here. A bug that interrupts a secondary workflow is different from one that breaks the action customers use to prove value internally.
Keep the score visible in the systems people already use
The score is only useful if it shows up where decisions happen.
That usually means adding a small set of fields to your issue workflow:
| Field in Jira or Linear | Why it matters |
|---|---|
| Revenue class | Tells reviewers whether this is retention, expansion, or acquisition related |
| Affected segment | Distinguishes SMB pain from enterprise blockers |
| Commercial notes | Summarizes renewal, rollout, or deal context |
| Confidence level | Signals whether evidence is strong or still emerging |
If your team struggles to standardize the model, a simple ROI template for product decisions helps force consistency. The key is not building a flawless scoring algorithm. The key is ending subjective roadmap debates that ignore commercial consequence.
Prioritizing Fixes and Features for Dollar Impact
Once feedback carries a Revenue Impact Score, prioritization gets simpler. Not easier, because trade-offs still exist. But simpler, because teams stop arguing about whether something “feels important.”
They can argue about effort, timing, and confidence instead.
Use a two-axis decision model
The most practical framework I've seen is a simple matrix:
- High impact, low effort: Fix now.
- High impact, high effort: Scope carefully, get leadership alignment, and define expected business movement before committing.
- Low impact, low effort: Batch with adjacent work.
- Low impact, high effort: Usually reject or defer.
That sounds basic because it is. The value comes from what “impact” means. In strong teams, impact is not ticket volume or internal pressure. It's measurable revenue risk or measurable revenue opportunity.
What the weekly review should look like
A revenue-focused prioritization meeting shouldn't resemble backlog theater.
Keep it tight:
- Review the highest-scoring issues first
- Confirm affected accounts and commercial stage
- Check engineering effort and dependencies
- Decide one of four outcomes: fix now, investigate, bundle, or reject
- Record the reason
- Set a post-release measurement plan
That final step gets skipped too often. If a team can't say how it will judge the result, it isn't running revenue optimization. It's just shipping work with better language.
Prospeo's revenue optimization framework is useful here because it frames optimization as a continuous eight-step experimentation loop. Teams define one lever and metric, run a controlled test, and publish learnings in a Growth Log so knowledge compounds instead of disappearing into Slack threads and retrospective notes.
Operating principle: Every prioritized item should come with a hypothesis. What should move, for whom, and why?
Automate the handoff into Jira
This process works best when the path from signal to issue creation is short.
A practical setup looks like this:
- Zendesk or Intercom collects the initial pattern
- Product intelligence or ops review adds commercial context
- Jira ticket is created automatically or semi-automatically
- Fields are pre-filled with affected segment, revenue class, and evidence
- PM owns prioritization
- CS or sales gets looped in when customer follow-up matters
That avoids the biggest execution gap in most organizations. Insight lives in one system, but delivery happens in another.
The handoff also needs a rejection path. Some issues are real but still shouldn't be built. Reasons vary: narrow use case, weak signal confidence, poor strategic fit, or effort too high relative to likely value. Saying no is part of the discipline.
The roadmap should show commercial intent
I like roadmap labels that make the business case visible without forcing people into a spreadsheet every time.
Examples:
- Retention protection
- Expansion enablement
- Activation acceleration
- Procurement unblock
- Trust and reliability
Those labels help engineering understand why the work exists. They also force product leaders to articulate the expected outcome before implementation starts.
Instrumenting Your Revenue Engine KPIs and Experiments
Backlog scoring helps decide what to build. KPIs tell you whether the system is working.
For B2B SaaS, the most important top-line metric is Net Revenue Retention. The median NRR in the category is 101%, while stronger companies target 110% or above. That matters because expansion ARR now accounts for 40% of new revenue, and the median cost to acquire **1 of new ARR has climbed to **1.76, according to Oliver Munro's SaaS marketing statistics roundup. If existing customers aren't expanding, acquisition efficiency gets punished fast.
The KPI stack that actually matters
Here's the scorecard I'd put in front of a growth, product, and CS leadership team.
| Metric | What It Measures | Benchmark Target |
|---|---|---|
| Net Revenue Retention | How well revenue from existing customers holds and expands over time | 110% or above |
| Expansion ARR share | How much new revenue comes from upsells and add-ons | Track closely because expansion ARR accounts for 40% of new revenue in stronger companies |
| CAC Ratio | Cost to acquire new ARR | Watch closely against the median 1.76 to acquire ****1.00 of new ARR |
| Rule of 40 | Combined growth rate plus profit margin | 40 or above |
| CAC Payback Period | Time required to recover acquisition cost | Under 18 months for enterprise segments |
Those aren't vanity metrics. They answer whether your product, pricing, and customer experience are producing efficient growth.
Add operational KPIs under the finance layer
The high-level metrics matter, but teams need lower-level instrumentation they can influence directly.
I'd track these operationally:
- Conversion by pricing tier
- Expansion funnel stages
- Churn and retention by segment
- ARPA movement over time
- Feature adoption tied to expansion motion
Artisan Growth Strategies' SaaS revenue optimization guidance is especially useful on two points. First, teams should target annual ARPA growth in the 10–15% range, maintain at least an LTV:CAC ratio of 3:1, and work toward a CAC payback period of 12 months or less through pricing and packaging discipline. Second, they need to instrument the expansion funnel explicitly rather than treating expansion as a single event.
A simple expansion funnel can look like this:
| Expansion stage | What to capture |
|---|---|
| Signal detected | Usage spike, value milestone, support pattern, or stakeholder request |
| Offer delivered | Whether the account saw the right upgrade path |
| Demo or meeting | Whether the commercial conversation actually happened |
| Expansion closed | Whether the account upgraded and why |
If you don't instrument those steps, expansion misses get filed as “timing” or “budget,” and the organization learns nothing.
Run experiments around value milestones
Many teams push upgrade conversations at renewal because the calendar makes it easy. That's usually the wrong trigger.
What works better is connecting outreach to a moment when the customer has already achieved a visible outcome. That might be a successful rollout, repeated use of a premium workflow, or a business report that proves the product is working. The same Artisan guidance notes that expansion outreach performs better when it happens shortly after measurable value is achieved rather than at arbitrary renewal dates.
That principle should shape both product and GTM experiments:
- Price fences: Test feature gates, usage thresholds, or priority support instead of blanket price increases.
- Timing tests: Trigger expansion prompts after a success milestone, not just by contract date.
- Packaging tests: Segment by job-to-be-done and desired outcome, not only by company size.
- In-product prompts: Surface upgrade paths when users hit natural capability limits.
The best upsell moment is often right after the customer proves the product works, not right before the contract ends.
Keep a Growth Log
Experimentation breaks down when results live in memory.
Every test should end with a written record: hypothesis, affected segment, implementation detail, observed movement, and decision. If you skip that, teams repeat the same pricing tests, the same prompt placements, and the same outreach mistakes every few quarters.
Revenue optimization is not a quarterly brainstorm. It's an operating system with memory.
Building Your Continuous Revenue Optimization Flywheel
The durable model is a flywheel, not a project plan.
You diagnose friction from customer language. You quantify the business impact. You prioritize fixes and features by commercial consequence. You instrument the right KPIs. You run experiments that line up product changes with actual value delivery. Then the results feed back into the next round of diagnosis.
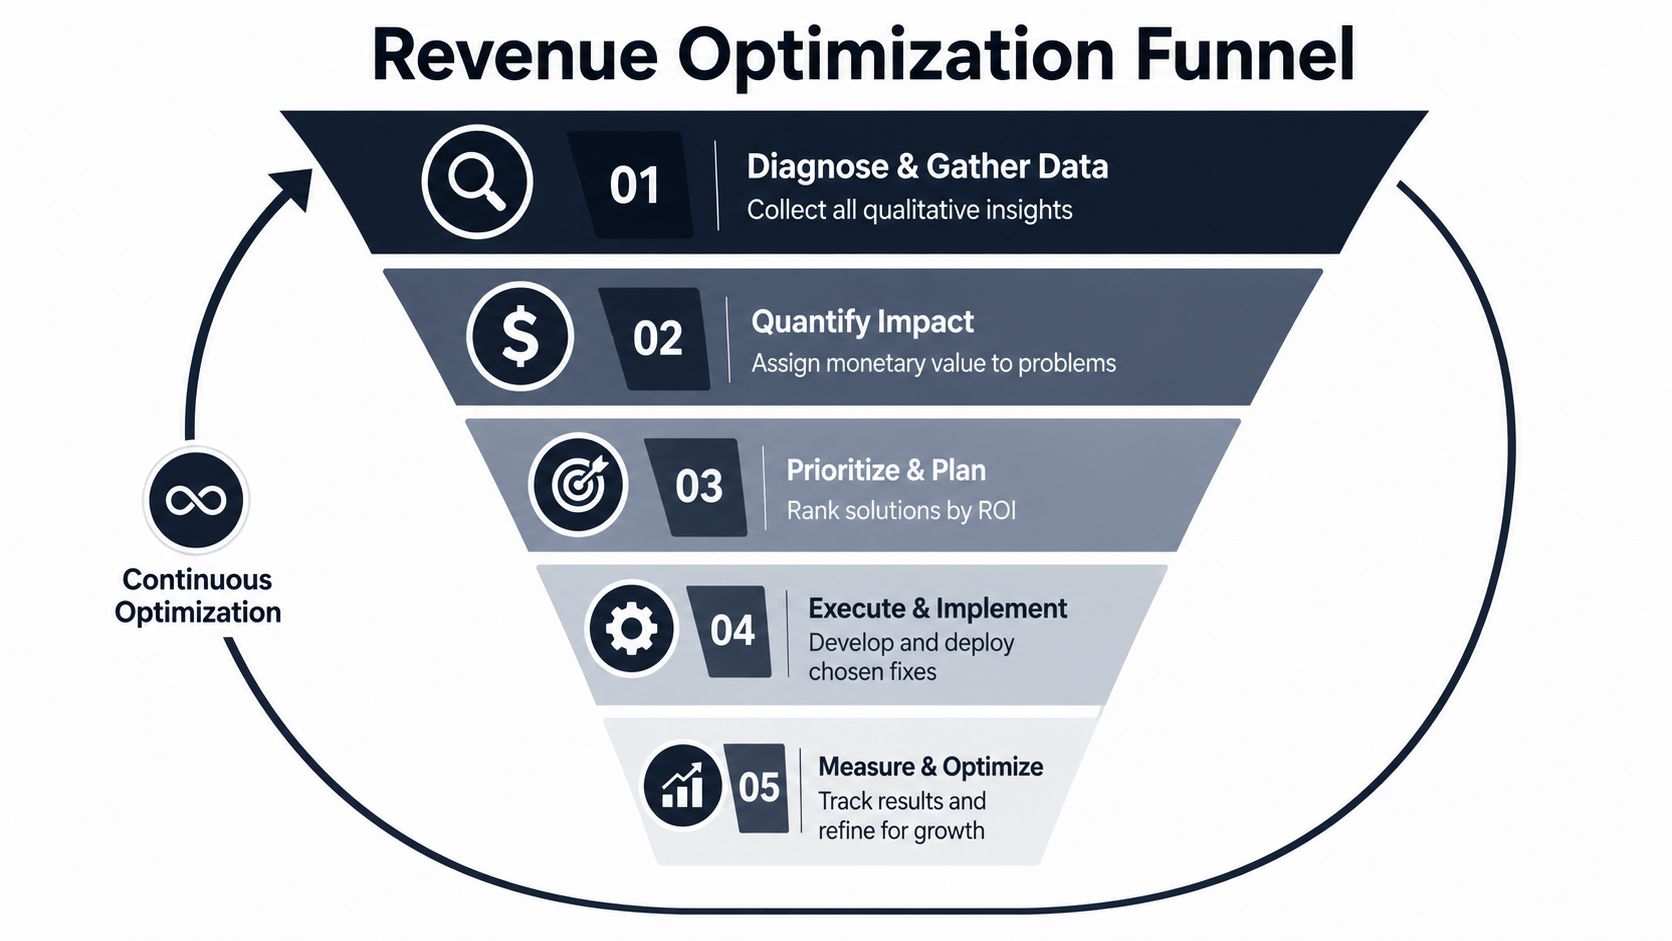
The important shift is cultural. Teams stop treating support feedback as noise, product delivery as an isolated function, and expansion as something owned only by sales. Revenue optimization becomes shared operational discipline across product, support, CS, growth, and engineering.
That's also why timing matters so much. Upgrade motions work better when they follow customer outcomes, not arbitrary internal schedules. The teams that connect product signals to value milestones create cleaner expansion conversations and smarter roadmap decisions.
A short explainer on the broader operating mindset is worth watching before you formalize the process in your own org:
What the flywheel looks like in practice
A healthy operating cadence usually includes:
- Weekly signal review: Product, support, and CS review emerging issue clusters.
- Biweekly prioritization: PMs and engineering leads decide which revenue-scored work enters delivery.
- Monthly KPI review: Leadership checks retention, expansion, ARPA, payback, and experiment outcomes.
- Quarterly model cleanup: Teams refine scoring logic, taxonomy, and instrumentation.
What changes when this is working
Three things happen.
First, roadmap debates get shorter because the business case is attached to the work. Second, support and customer-facing teams feel useful in a more concrete way because their data influences delivery. Third, product starts acting less like an intake function and more like a revenue partner.
That's the true advantage. Not just better prioritization, but a tighter connection between customer reality and financial outcomes.
If your team wants a cleaner way to turn support tickets, sales notes, and usage patterns into prioritized product work, SigOS is one option to evaluate. It's built for teams that need to connect qualitative feedback to churn risk, expansion opportunity, and issue creation inside tools like Zendesk, Jira, and GitHub without relying on manual tagging and spreadsheet triage.
Keep Reading
More insights from our blog



Ready to find your hidden revenue leaks?
Start analyzing your customer feedback and discover insights that drive revenue.
Start Free Trial →