What Is Customer Churn Risk and How to Reduce It
What is customer churn risk? Learn drivers, scoring, models and interventions to predict at-risk accounts and reduce revenue loss before cancellation.
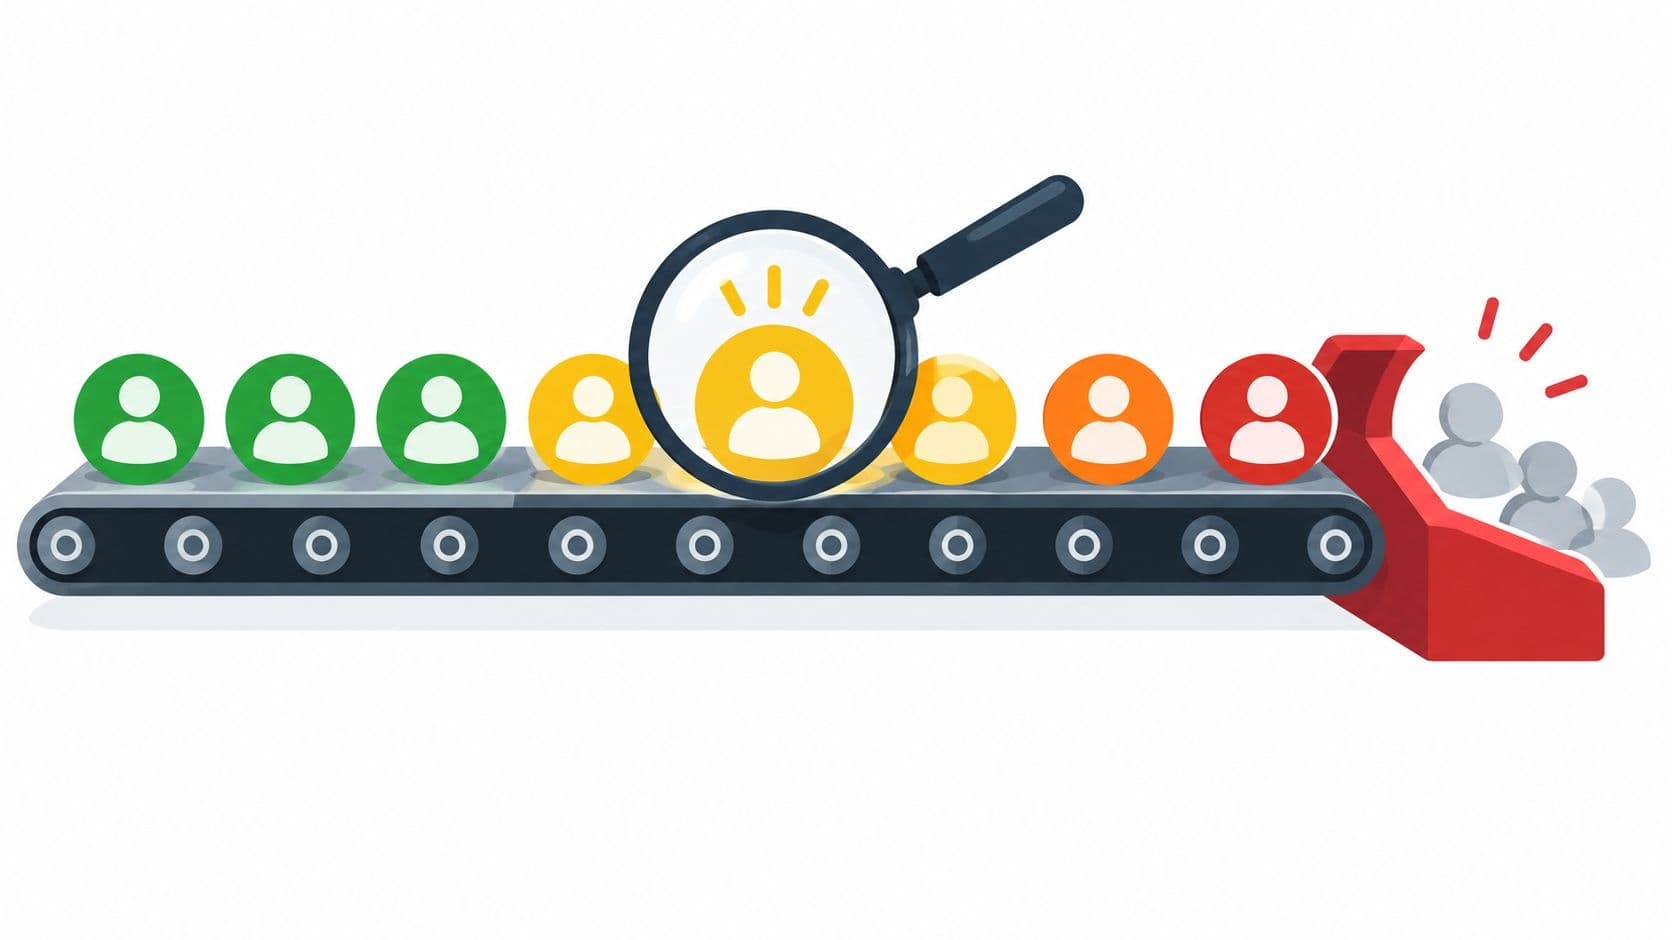
An account that used to log in every day has gone quiet. Its users stopped exploring new features, the last support conversation ended without a clear resolution, and the renewal date is approaching. Nothing has been canceled yet, so the account still looks active in the billing system. For the customer success team, however, the silence is already a signal.
Introduction to Customer Churn Risk for Growing Teams
一個原本穩定使用產品的客戶,可能在取消訂閱前,先逐步降低參與度。報表仍顯示帳戶有效,團隊卻已失去了解需求變化的機會。這正是 customer churn risk 需要被及早辨識的原因。
客戶流失是已經發生的結果,例如訂閱結束、合約未續約,或客戶停止購買。Customer churn risk 則是客戶在特定期間內出現這些結果的前瞻性機率,期間可以是下一個續約週期或未來 90 天。這個差異決定了團隊是在事後解釋,還是在客戶仍可能改變決定時採取行動。
風險也不是一個固定標籤,而是會隨行為、產品價值與時間變化的光譜。短暫沉默可能只是客戶正處於專案空檔,較長時間的低使用量若同時伴隨未解決的支援問題,則應提高警覺。團隊要設定的是決策門檻,而不是把每個安靜帳戶都當成即將流失的客戶。低風險帳戶可先觀察,中度風險帳戶需要確認背景,高風險帳戶才應立即安排介入。
Churn rate 提供客戶流失的回顧性結果,churn risk 則協助產品、支援與客戶成功團隊,在行為仍在變化時分配注意力。這種區分能減少誤報,也讓介入時機更貼近客戶真正需要協助的時刻。
流失的財務影響不容忽視。Industry summaries place average U.S. customer churn at about 21%, and estimate that churn costs U.S. businesses roughly $168 billion per year, according to Qualtrics' customer churn statistics. 在訂閱模式中,持續的每月流失會逐步縮小客戶基礎。若沒有新客戶抵銷,5% monthly churn could lose about 46% of its starting customer base over a year, as explained in this churn risk analysis guide.
實務上,團隊應追問:哪些行為改變了,證據有多充分,以及現在的介入是否值得。這三個問題構成可靠風險判斷的起點。
Understanding What Customer Churn Risk Really Means
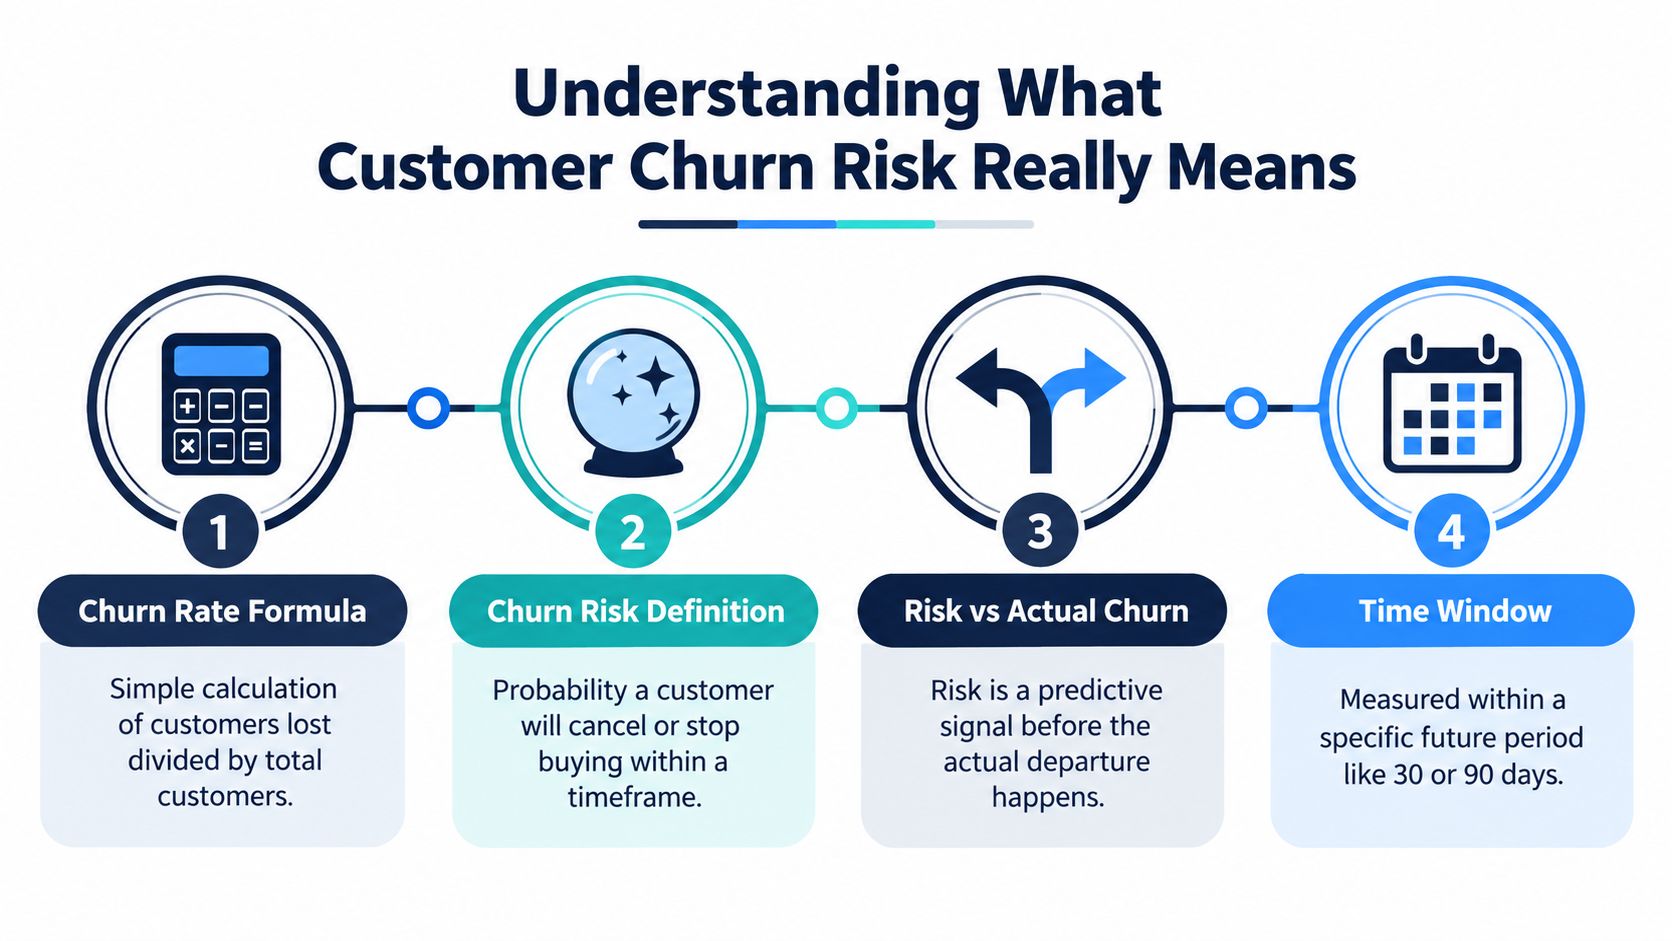
A team can review last month's customer losses and still miss which active accounts need attention today. The starting point is churn rate, a backward-looking measure:
Churn rate = (customers lost ÷ customers at start) × 100
This formula summarizes what happened during a completed month, quarter, or year. It cannot identify which current accounts may leave next, or show whether reduced activity reflects a temporary pause or a deeper decline in perceived value.
Risk is a forecast, not a verdict
Customer churn risk is the probability that a customer will stop buying or cancel within a defined period. Any useful estimate must identify both the customer being assessed and the future window under consideration.
Customer churn risk is a time-bound estimate of a possible departure, not proof that a customer will leave.
A health check offers a useful comparison. A clinician does not treat one temperature reading as a final diagnosis. They consider symptoms, history, and changes over time. A churn score needs the same context. One quiet week may reflect a customer moving between projects. Quiet usage combined with unresolved support issues and missed onboarding milestones suggests a different level of concern.
Risk therefore works better as a spectrum than as a permanent label. An account can move from healthy to watch-listed after a modest usage decline, then become ready for intervention when several independent signals align. It can also return to a lower-risk state after the customer completes a workflow, adopts a valuable feature, or receives a satisfactory resolution.
Time windows change the meaning
A risk score without a time horizon is difficult to act on. An account may have little cancellation risk over the next few weeks but face a serious renewal concern later if adoption remains narrow. Microsoft describes subscription churn prediction as a time-windowed classification problem. Businesses define churn based on when a subscription ended, then predict risk across a future horizon such as the next 90 days. Its guidance also states that monthly retraining may be sufficient for many subscription businesses as new data arrives, as described in Microsoft's subscription churn prediction documentation.
The prediction window should match the decision the team must make. Support teams may need a short horizon for unresolved incidents. Customer success teams may need a longer window tied to renewal planning. Product teams may monitor a broader period to spot adoption problems before they become commercial risks.
Industry summaries place B2B SaaS monthly churn around 3% to 7% for SMB accounts and 1% to 2% for enterprise accounts, while B2C subscriptions often fall around 5% to 10% monthly, according to KPITree's churn risk analysis reference. These benchmarks offer context, not a decision rule. Account-level evidence should determine whether a team observes, contacts, or escalates a customer.
Key Drivers and Behavioral Indicators Behind Churn Risk
Demographics can help teams segment customers, but they rarely explain the first meaningful change in an account's relationship with a product. Behavioral deterioration usually gives teams more actionable evidence. A customer's company size or industry may describe who the account is. Usage, service quality, and experience reveal what's happening now.
An Aalto University SaaS case study found that service usage ranked highest among churn factors, followed by service quality and service experience. It also described service quality, market conditions, and customer profile as causal drivers, with usage, experience, and contractual factors appearing as downstream effects in the relationship, as documented in the Aalto University study.
Read the causal chain
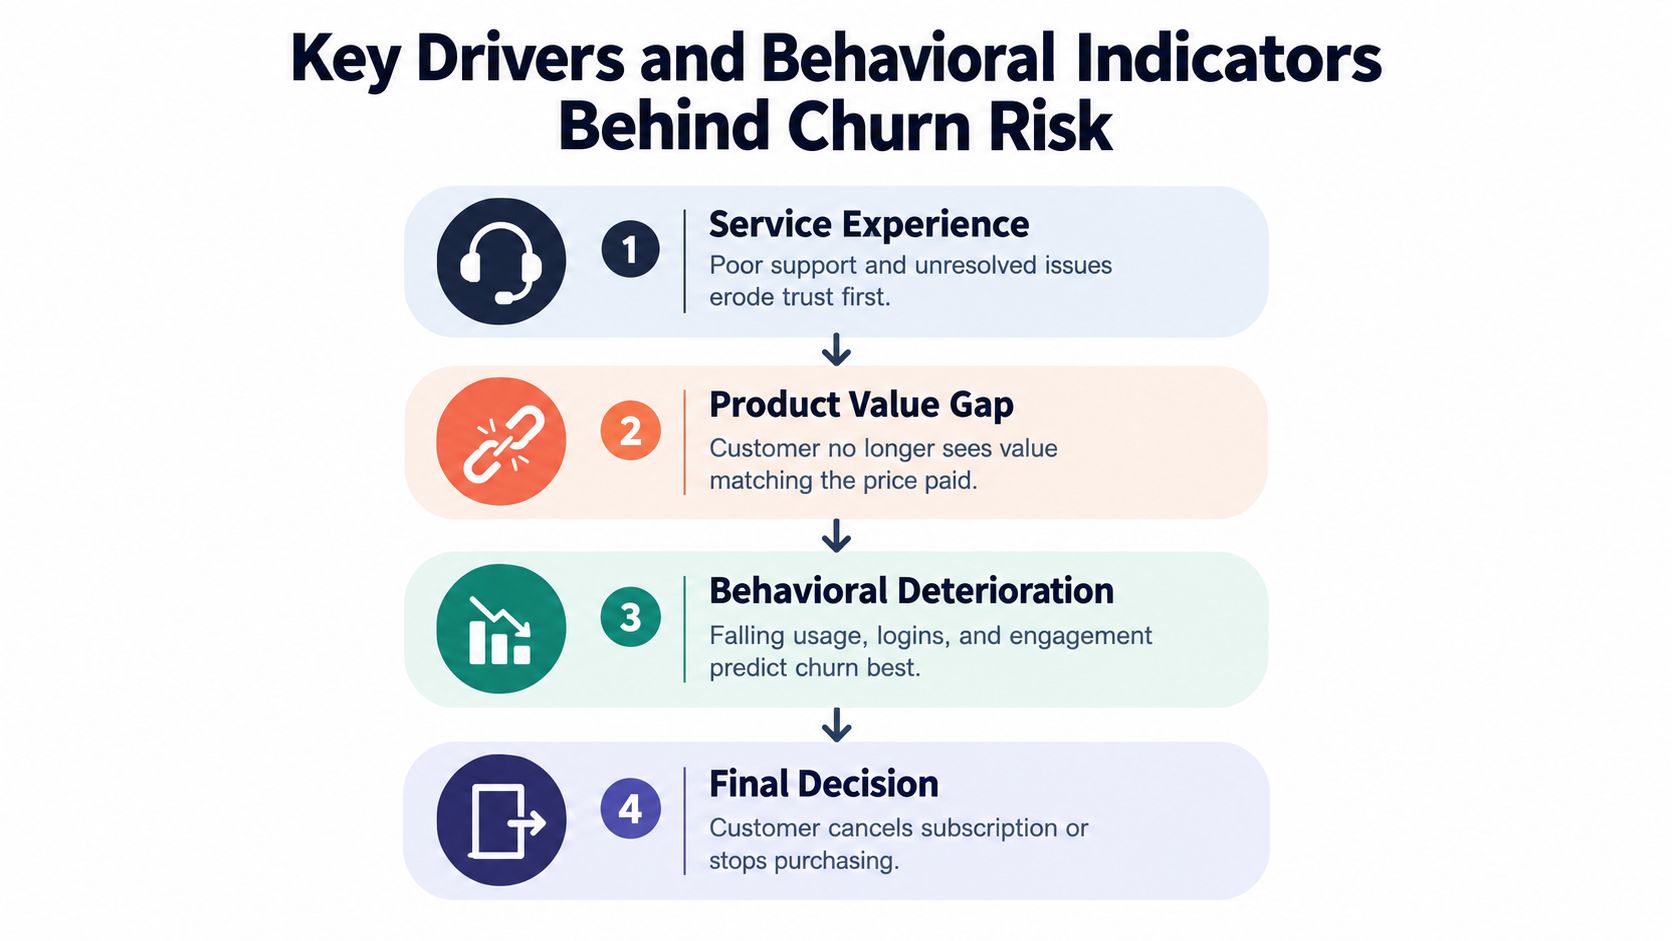
A practical account review can follow this order:
- Service experience: Unresolved tickets, repeated handoffs, or poor delivery can weaken trust before users reduce activity.
- Product value: If the customer no longer connects the product to a meaningful workflow, usage becomes narrower and less consistent.
- Behavioral deterioration: Falling usage breadth, fewer meaningful actions, and weaker engagement provide early evidence that value realization is slipping.
- Commercial decision: The customer eventually cancels, stops buying, downsizes, or chooses not to renew.
This sequence doesn't mean every account follows the same path. It gives teams a way to ask better questions. If usage has fallen, inspect service quality and customer experience before assuming the customer is disengaged. If support sentiment has worsened but usage remains strong, the account may need a service recovery rather than a broad retention campaign.
Quiet isn't always at risk
A temporarily quiet account usually has a plausible business explanation and stable surrounding signals. Its users may be working on a seasonal project, waiting for internal approval, or completing work outside the platform. The account becomes more concerning when inactivity combines with other changes, such as a missed onboarding milestone, a shrinking set of active users, unresolved support issues, or declining engagement across communication channels.
Account-level context matters. A single user's lower activity might be harmless if other teams continue to use the product. A broad reduction across key workflows is more significant. Contract structure matters too, because a usage decline can carry different implications for a short-term subscription, a multiyear agreement, or an account approaching renewal.
A quiet account is a question. A quiet account with converging negative signals is a decision.
Teams can deepen this diagnostic approach with a practical guide to identifying customer risk factors. The aim isn't to punish low activity with an automatic alert. It's to understand whether the customer's path is returning to normal or moving toward a commercial decision.
How to Measure and Score Customer Churn Risk Accurately
A useful score turns scattered signals into a consistent decision aid. It shouldn't pretend to predict the future perfectly. It should help teams decide which account deserves attention, why it deserves attention, and how urgently someone should respond.
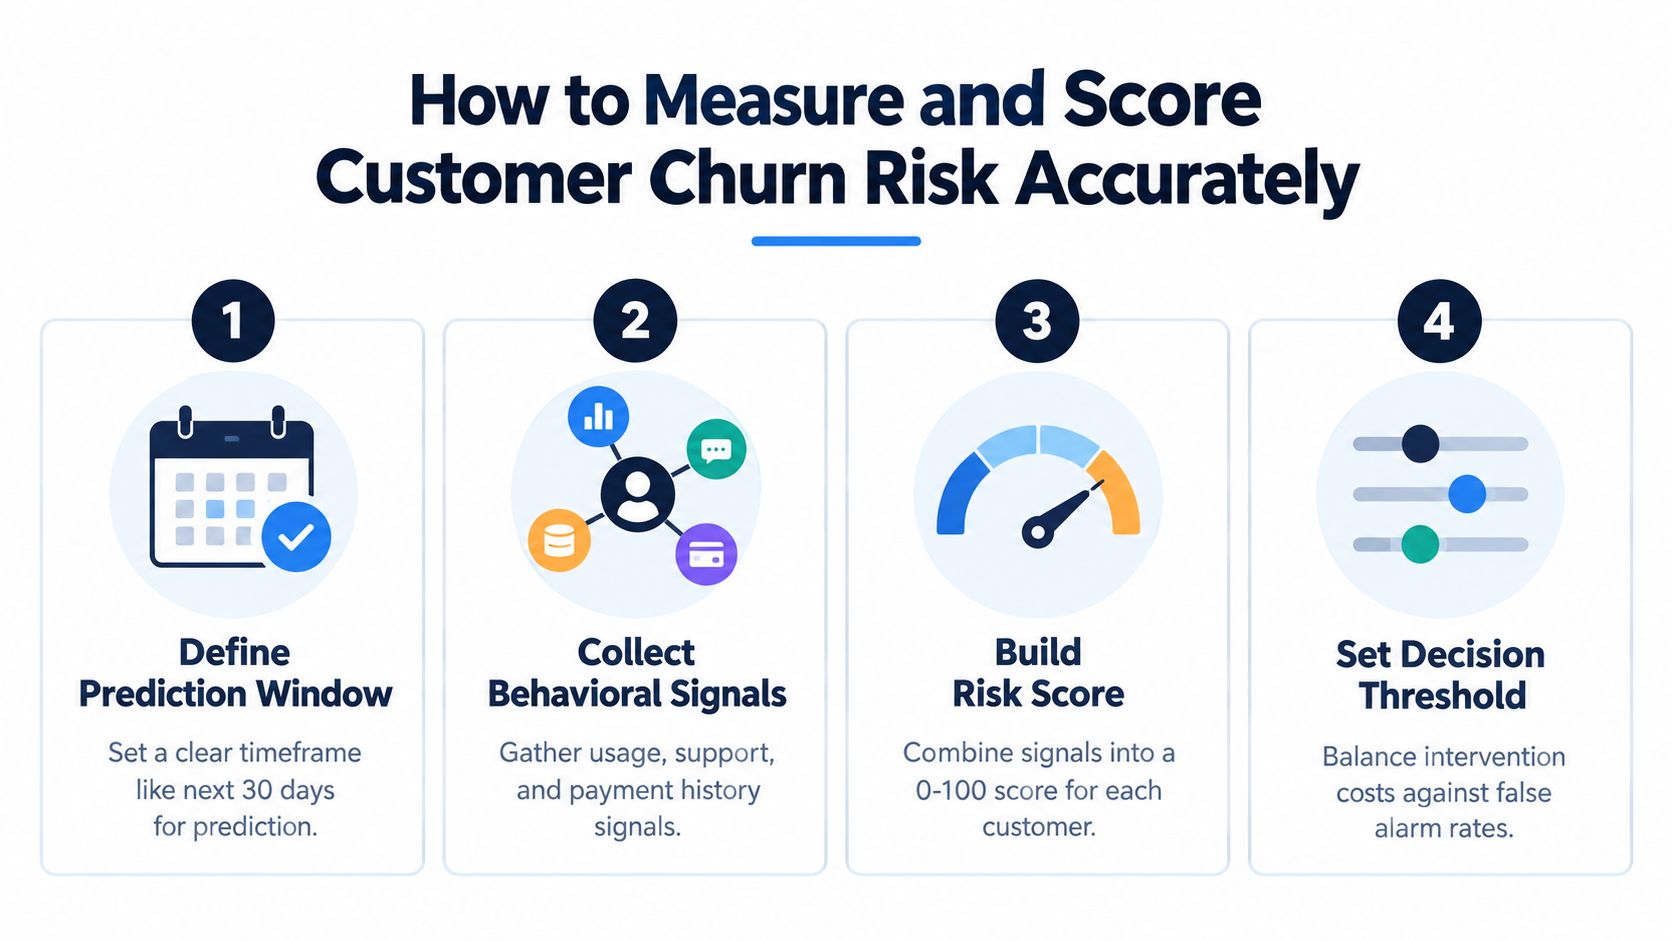
Start with the prediction window
Choose a period that matches the action you can take. A short window may support rapid service recovery. A longer window may give customer success managers time to rebuild adoption before renewal. Define the churn event clearly too. Depending on the business, it may mean cancellation, non-renewal, payment failure, or a sustained stop in buying.
Then collect signals that explain customer behavior:
- Usage change: Compare current activity with the account's own established pattern, not only with a company-wide average.
- Adoption breadth: Check whether the customer uses one narrow feature or relies on several core workflows.
- Onboarding progress: Flag milestones that remain incomplete when they were expected to support value realization.
- Support experience: Review unresolved issues, repeated escalations, and the nature of recent conversations.
- Engagement: Monitor meaningful customer interactions, not just message volume.
- Payment status: Separate involuntary risk caused by billing friction from voluntary risk caused by declining value.
A score can combine these inputs, but the formula should remain explainable to the people who act on it. A customer success manager should be able to see why an account moved from healthy to watch-listed.
Set thresholds around decisions
The most important threshold isn't a universal score. It's the point at which intervention becomes more valuable than observation. If every small fluctuation triggers an urgent task, teams will stop trusting alerts. If thresholds are too strict, they'll miss accounts where multiple weak signals are already reinforcing one another.
A practical policy can use three states:
- Observe: One mild or short-lived signal appears. The owner checks context and waits for confirming behavior.
- Investigate: Multiple signals align, or one serious issue remains unresolved. The owner reviews the account and contacts the relevant team.
- Intervene: Risk is persistent, high-impact, or tied to an approaching commercial event. The team assigns an explicit recovery plan and deadline.
This spectrum reflects guidance that churn risk is a forward-looking estimate, usually inferred from declining usage, missed onboarding milestones, unresolved support issues, and weaker engagement. The distinction between a temporarily quiet account and an at-risk account remains a decision problem, not something a score can solve by itself, as discussed in Dock's guide to at-risk customers.
Use customer health scoring practices to document signal definitions, ownership, and escalation rules. Review false alarms as carefully as missed risks. A model that identifies many accounts but gives no useful action can create more operational noise than insight.
Common Modelling Approaches for Predicting Churn Risk
A quiet account is not automatically a failing account. One customer may pause usage because a project is between phases, while another may be preparing to leave. Modelling works best when it treats churn risk as a changing spectrum, with thresholds that guide decisions rather than a permanent label attached to each account.
Teams should establish reliable definitions and usable behavior data before choosing a complex model. A transparent rule can outperform an opaque prediction when nobody trusts the result or knows what action it should trigger. The model's purpose is practical: separate temporary silence from sustained deterioration, then give the owner enough time to respond.
Churn prediction is commonly framed as a time-windowed classification problem. The question becomes whether an account is likely to churn within a defined future period, rather than whether it is “a churner.” That distinction keeps the score connected to a decision horizon. Models also need refreshes because customer behavior, product adoption, and market conditions change over time.
Compare the practical options
| Approach | Best Horizon | Key Inputs | Refresh Cadence |
|---|---|---|---|
| Rule-based heuristics | Immediate monitoring and short intervention windows | Usage decline, unresolved tickets, payment events, onboarding status | Whenever signal definitions or workflows change |
| Cohort and survival analysis | Renewal planning and time-to-event questions | Customer tenure, contract structure, historical churn timing, cohort behavior | On a scheduled analytical review |
| Machine learning classification | A defined future window | Product events, support history, engagement, billing, account context | Monthly can be sufficient in many subscription environments |
Rule-based systems are easy to explain and useful for early monitoring. A team might flag an account when usage declines and a high-priority support issue remains unresolved. The limitation is rigidity. The same behavior can mean different things for a new customer, a mature account, or a seasonal workflow.
Cohort and survival analysis adds time and comparison. It can show whether newer customers, contract groups, or onboarding paths follow different risk patterns. This approach suits teams asking when departures happen, not only which accounts cross a risk threshold.
Machine learning classifiers combine more signals and can identify interactions that manual rules miss. They require clear labels, consistent event tracking, drift monitoring, and regular retraining. A classifier should support a defined retention action, such as investigation or intervention, rather than become a separate analytics project.
Start with signals the business understands. Record the threshold, the owner's response, and the outcome. Add complexity only when better prediction changes a decision. The most useful horizon gives the owner time to act while keeping the behavior relevant. A model that is not refreshed can mistake old behavior for current risk and miss new patterns.
Operationalizing Alerts and Interventions That Actually Work
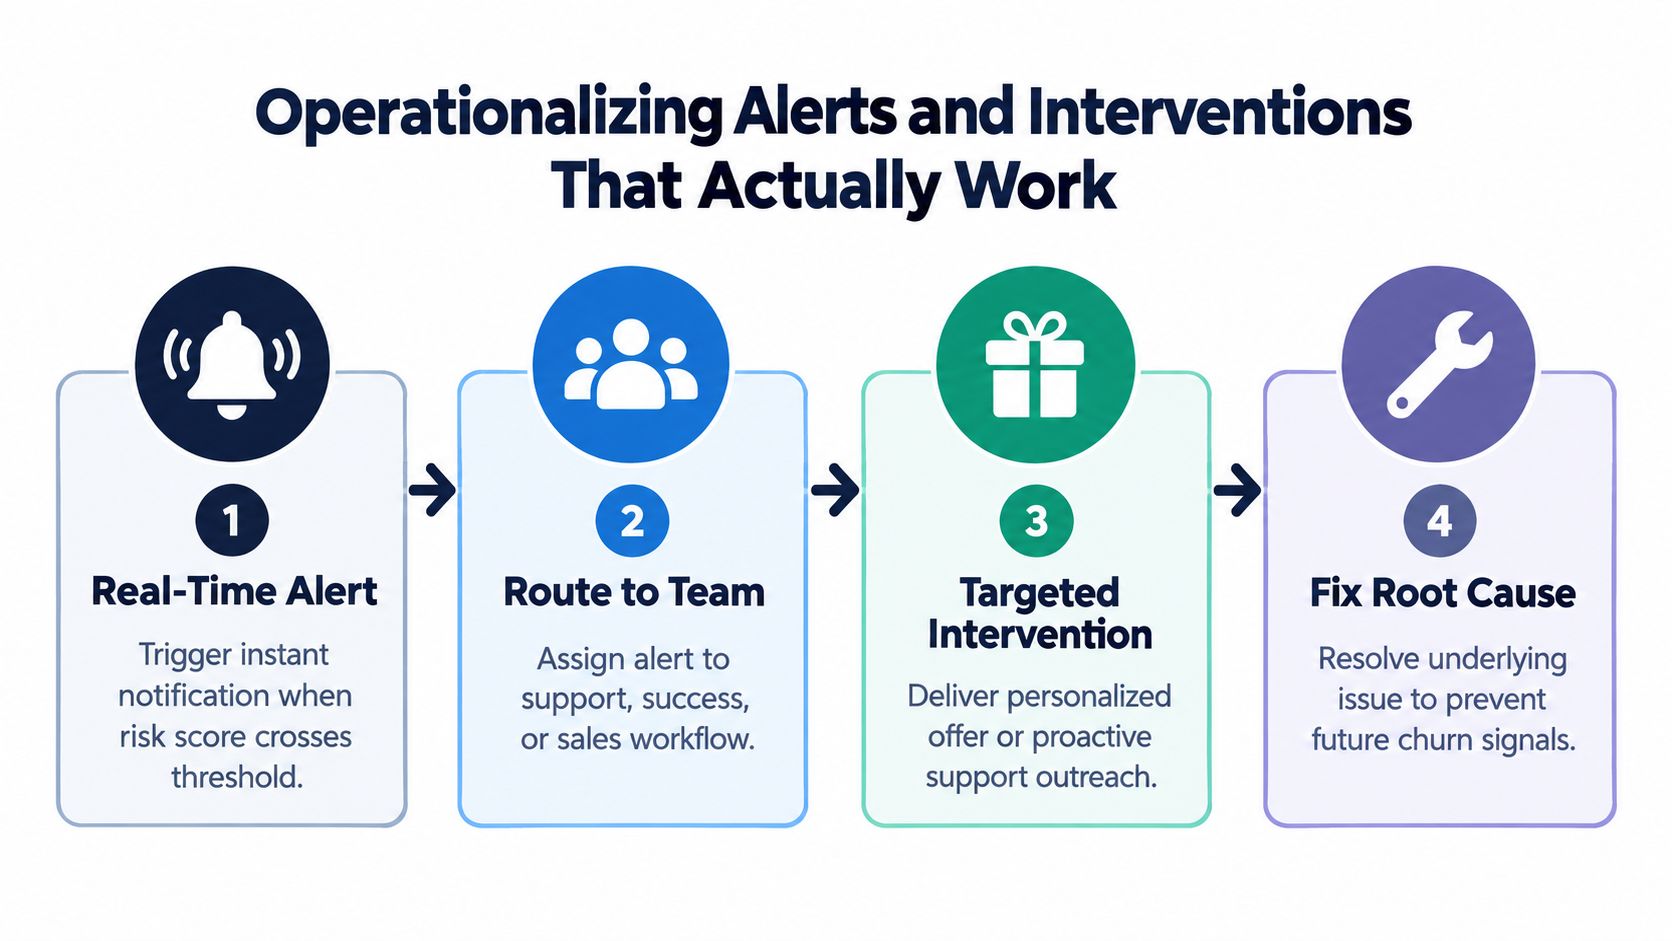
A churn alert has value only when a person can understand it and take the right next step. A notification that says “high risk” without evidence creates anxiety, not retention. The alert should show the changed behavior, the affected workflow, the account's commercial context, and the owner responsible for responding.
Route each signal to the right team
A support issue belongs first with support, even if it contributes to a broader account-risk score. A product defect may require a Jira or Linear issue with account and revenue context. A customer success owner may coordinate the recovery plan, while sales or finance handles contract or payment concerns.
A workable flow looks like this:
- Detect: A meaningful pattern crosses the agreed threshold.
- Explain: The system displays the signals behind the change, including timing and account context.
- Assign: The alert reaches the person or team that can address the cause.
- Verify: The owner records whether the customer's behavior and experience improved.
A team might use Zendesk for support history, Intercom for conversations, Jira for defects, and a customer health system for account-level context. A churn prediction dashboard can help teams bring these views together, provided the dashboard supports investigation rather than hiding the evidence behind one score.
Reduce symptoms, then remove causes
Faster support can improve the immediate experience, but it doesn't necessarily repair the underlying product problem. Industry coverage cited in 2026 reports that generative AI in customer service can reduce response time by 78% and improve first-contact resolution by 22%, according to this customer retention statistics summary. Those figures illustrate why service automation may matter, but a quick answer can still leave a broken workflow, missing capability, or repeated defect unresolved.
Separate the intervention record into two fields:
- Symptom response: What did the team do to reduce immediate friction?
- Root-cause response: What changed in the product, process, billing setup, or customer workflow to prevent recurrence?
The same principle applies to unusual account behavior. If a store needs to stop repeat fraudsters from checking out, a transaction-control workflow may protect the business, but the team should still distinguish fraud prevention from customer retention signals. Mixing unrelated risk categories can produce misleading alerts and inappropriate outreach.
A strong intervention can include a targeted enablement session, a documented resolution plan, a product workaround, or an executive review for a strategic account. The owner should define what evidence will show that risk has declined. A polite reply alone isn't enough if the customer continues avoiding the affected workflow.
Real Examples of Revenue Impact and Churn Reduction
A quiet account is not automatically an at-risk account. One customer may pause a project and temporarily reduce usage. Another may show the same dip alongside unresolved support issues and an approaching renewal. The first needs context and monitoring. The second may have crossed an intervention threshold. Treating both accounts alike wastes customer success capacity and can frustrate a healthy customer.
A useful threshold combines converging signals, persistence, account value, and timing. One weak signal is a dim light on the dashboard. Several independent signals that persist near renewal are a clearer warning. This dynamic view separates temporary inactivity from behavior that suggests declining value.
The financial context sets priorities. Industry benchmarks report annual churn at 23%, while 44% of companies can't state their churn rate, as noted in Qualtrics' cited churn benchmarks. Without a reliable connection between account behavior and customer loss, teams cannot estimate exposure, compare interventions, or decide which product problems need investment.
Review each account through five questions:
- Exposure: What recurring revenue, expansion opportunity, or strategic dependency is attached to the account?
- Evidence: Which behaviors changed? Are the signals independent, or did one event generate several alerts?
- Cause: Does the pattern relate to product value, service quality, market conditions, contract terms, billing, or several factors?
- Action: Who owns the next step, and what observable result would lower the risk state?
- Learning: Did behavior improve after the intervention, or did the score fall only because the alert became quiet?
Retention value depends on pricing, contract mix, expansion model, and cost structure. Calculate exposure at the account level instead of applying a generic benchmark.
Customer churn risk is a changing estimate that a customer may leave within a specified period. Teams should treat it as a spectrum with decision thresholds: monitor low-signal accounts, investigate persistent patterns, and intervene when evidence and business impact justify the effort.
SigOS connects support tickets, chat transcripts, sales conversations, usage data, and revenue context to surface patterns associated with churn and expansion. Visit SigOS to see how product and growth teams can turn customer signals into prioritized actions before at-risk behavior becomes cancellation.
Keep Reading
More insights from our blog
Ready to find your hidden revenue leaks?
Start analyzing your customer feedback and discover insights that drive revenue.
Start Free Trial →