What Is Churn Rate in SaaS and Why It Matters
What Is Churn Rate in SaaS. Learn what churn rate in SaaS really means, how to calculate it, the benchmarks that matter, and proven strategies

SaaS churn rate is the percentage of customers or recurring revenue lost during a defined period. A 1% monthly customer churn rate annualizes to about 11.4% customer loss, while the same logo churn percentage can produce very different revenue outcomes depending on segment and ACV.
That distinction is where many SaaS dashboards mislead founders. A business can lose numerous small accounts and protect most of its MRR, or retain nearly every customer while one high-value enterprise cancellation materially damages revenue. Churn isn't just a retention score. It shapes lifetime value, CAC payback, revenue forecasting, and net revenue retention.
The useful question isn't just, “What is churn rate in SaaS?” It's, “Which type of churn is occurring, in which customer segment, and what does it do to recurring revenue?”
What Churn Rate in SaaS Actually Measures
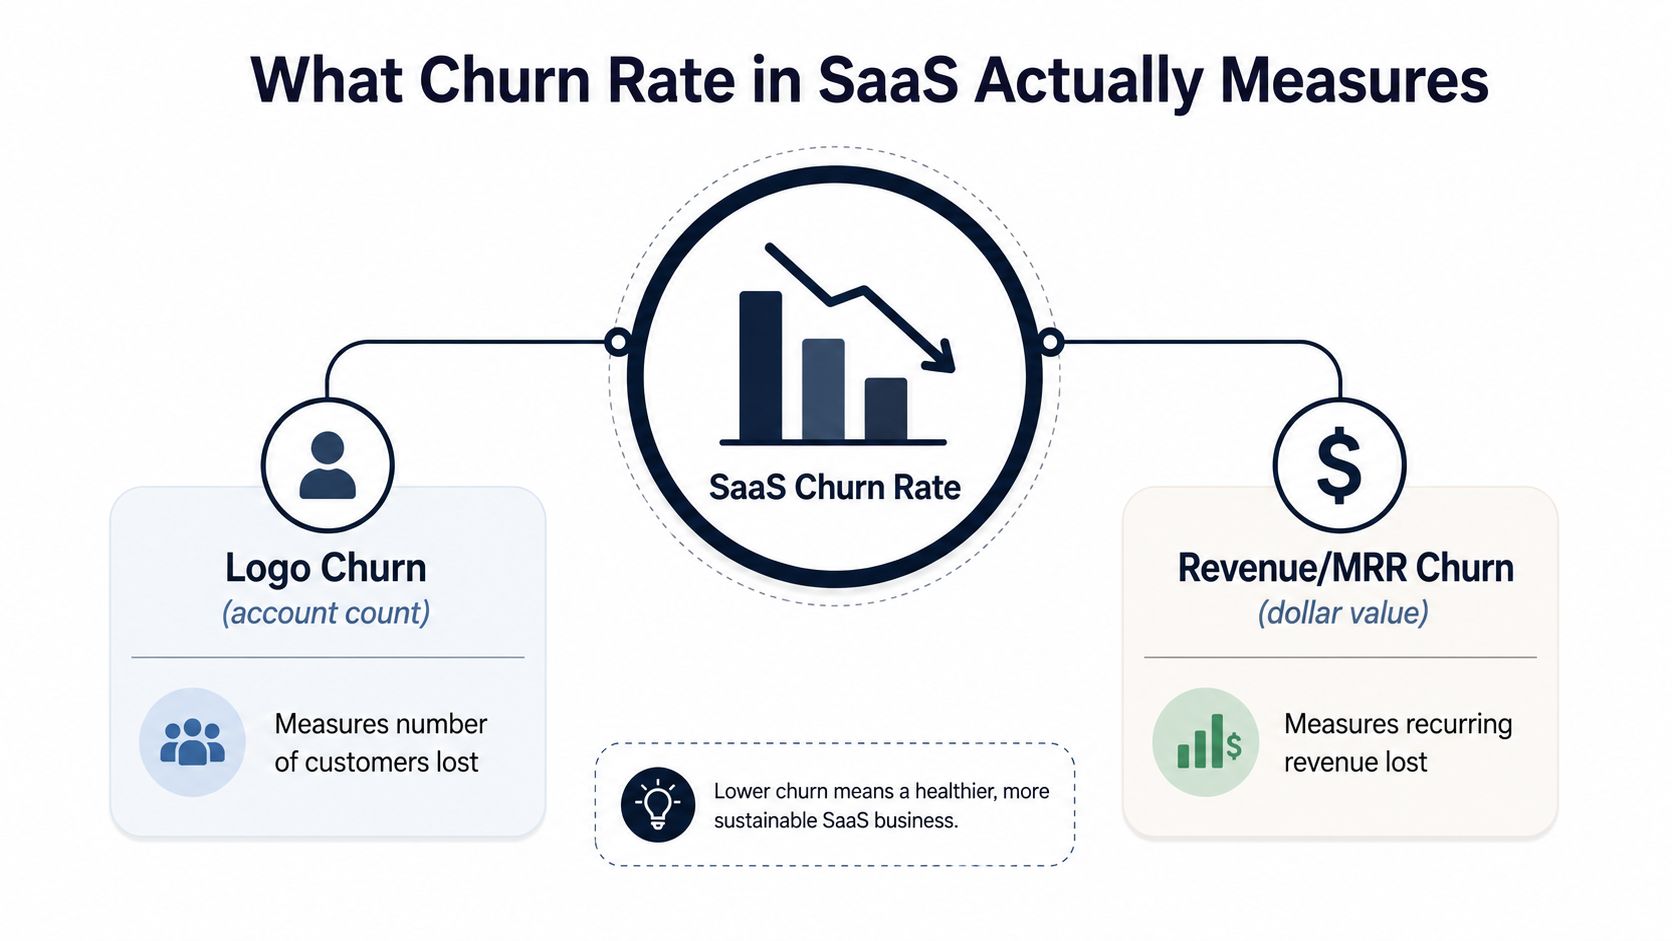
SaaS churn rate measures the percentage of customers or recurring revenue lost during a defined period, usually monthly or annually. The customer view is called logo churn, because each account represents a customer logo. The financial view is revenue churn, often expressed as MRR churn, because it measures recurring revenue lost from cancellations, downgrades, or other reductions.
Two lenses, one operating question
Logo churn answers, “How many customers did we lose?” Revenue churn answers, “How much recurring revenue did those losses remove?” Both are valid, but they serve different decisions.
A product leader may use logo churn to investigate onboarding, adoption, or market fit. A finance leader needs revenue churn to understand the effect on the forecast. The two numbers can diverge sharply when customers pay different prices, use different plans, or sit in different segments.
A 2% logo churn rate doesn't carry a universal meaning. Enterprise accounts often have higher ACV, deeper integrations, longer commitments, and greater switching costs. SMB accounts generally have lower switching friction and more price sensitivity. Recurly's software benchmark reports a 3.04% median annual churn rate, with top-quartile software businesses at 1.78% or below (Recurly's churn benchmark research). Those figures are useful context, not a substitute for segment-level analysis.
Finance rule: A churn percentage has no revenue meaning until you attach it to the value of the accounts that left.
Churn also affects the economics behind growth. When customers leave sooner, their lifetime value falls and the business has less time to recover acquisition costs. A lower churn rate can improve the efficiency of existing sales and marketing spend, while expansion revenue can offset losses through net revenue retention above 100%. That's why operators shouldn't treat churn as a standalone vanity metric. They should connect it to gross MRR churn, expansion MRR, CAC payback, and NRR.
How to Calculate Logo Churn and Revenue Churn
Start with a fixed opening cohort and a clearly defined period. The standard logo churn formula divides customers lost during the period by customers at the start of that period, then multiplies the result by 100. New customer acquisition stays out of the denominator, so the metric measures retention rather than overall growth (the SaaS churn calculation reference).
The two core formulas
Logo churn rate
Customers lost during period ÷ Customers at start of period × 100
Revenue, or MRR, churn rate
MRR lost during period ÷ MRR at start of period × 100
Revenue churn should use the MRR lost from cancellations, downgrades, or other reductions. If you want to assess gross revenue churn, don't offset those losses with expansion. If you want net revenue churn, subtract expansion from existing customers according to your reporting definition.
Use one cohort to see why the metrics must sit side by side. Suppose the period begins with 1,000 customers, each paying 50 MRR. Starting MRR is therefore ****50,000. During the 12-month period, 60 customers leave, and the business loses $3,000 MRR from those accounts.
- Logo churn is
60 ÷ 1,000 × 100, or 6%. - Revenue churn is
$3,000 ÷ $50,000 × 100, or 6%.
In this deliberately aligned example, both measures tell the same story because every lost account carries the same MRR. The divergence appears when the lost accounts have different values. If the 60 lost accounts represent only $3,000 MRR while the opening base includes larger retained accounts, logo churn can look severe while revenue churn remains comparatively contained. If one large account accounts for most of the lost MRR, revenue churn can be much worse than logo churn.
| Metric | Formula | Inputs | Result |
|---|---|---|---|
| Logo churn | Customers lost ÷ customers at start × 100 | 60 lost customers, 1,000 starting customers | 6% |
| Revenue churn | MRR lost ÷ MRR at start × 100 | 3,000 lost MRR, 50,000 starting MRR | 6% |
Timing and denominator discipline
A monthly rate and an annual rate aren't interchangeable. Churn compounds over time. 1% monthly churn annualizes to about 11.4% customer loss, while 3% monthly churn annualizes to roughly 30.6% if new bookings don't offset the losses (industry churn statistics and annualization context).
Use the starting customer or MRR base consistently unless your finance team has explicitly adopted another convention. Don't divide losses by the ending base, and don't mix gross losses with net expansion in a single calculation. Also document whether the period uses beginning-of-period balances, average balances, or a cohort fixed at the start. Consistency matters more than choosing a supposedly perfect convention.
Gross Churn, Net Churn, and the Voluntary vs Involuntary Split
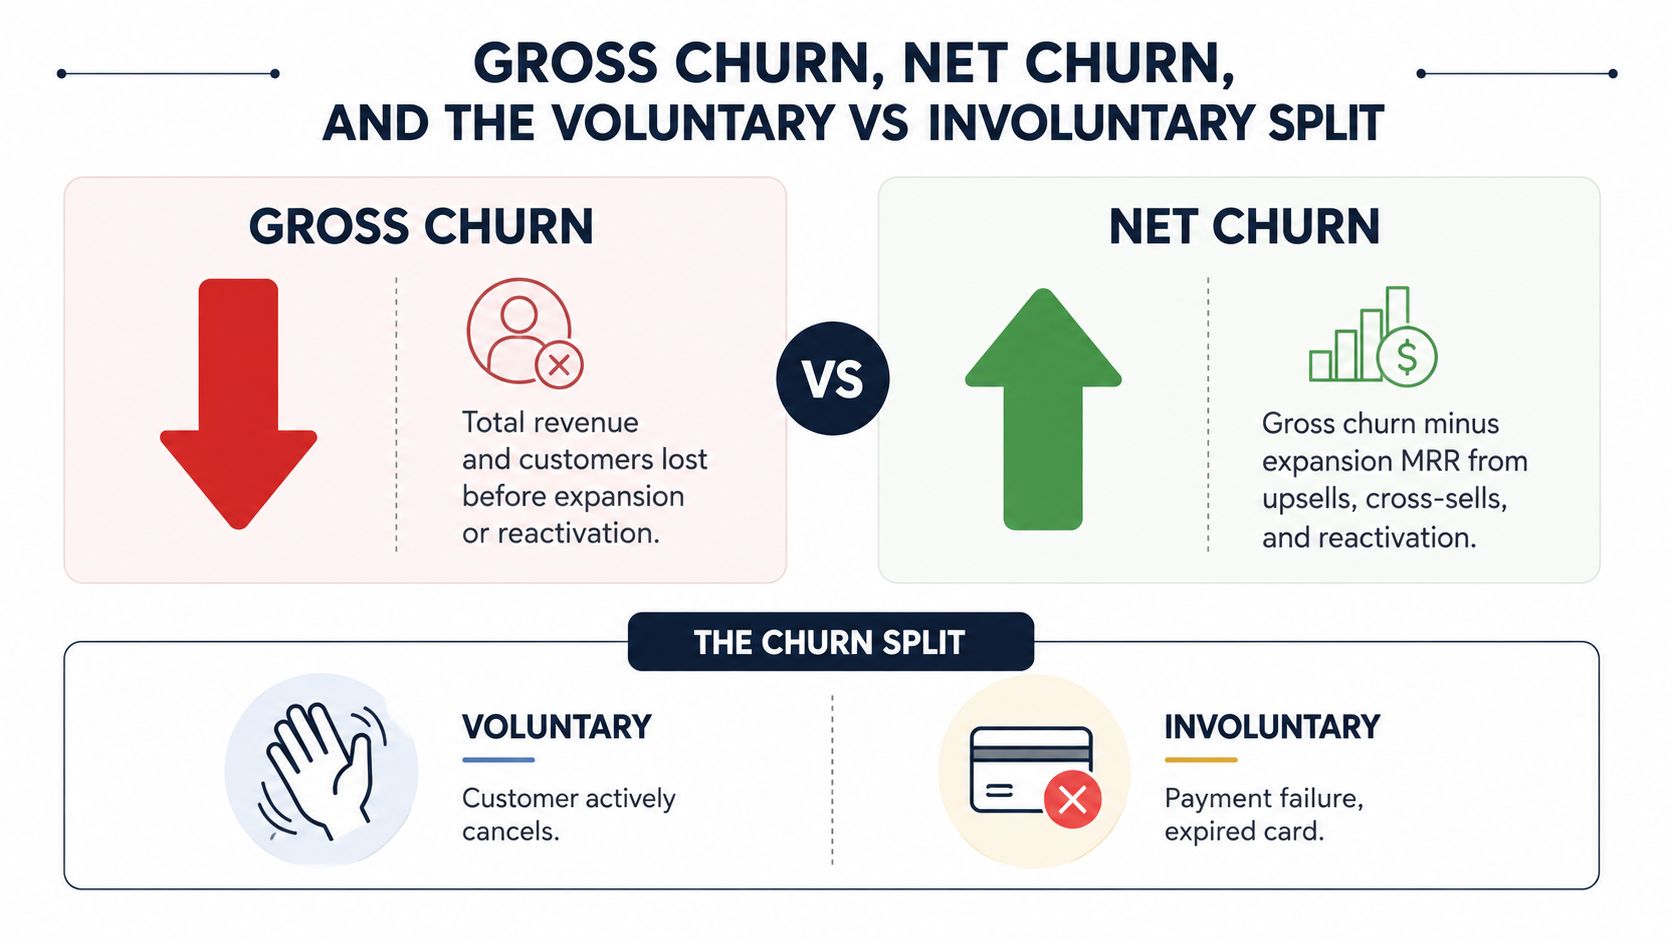
Gross churn shows the full loss before expansion or reactivation. Net churn subtracts expansion MRR from upsells, cross-sells, and reactivation, showing whether existing-customer growth offset the losses.
A company can therefore have meaningful gross losses and still produce net revenue retention above 100% if expansion exceeds churn. That result doesn't make gross churn irrelevant. It means the business is using expansion to mask the underlying leakage, a strategy that becomes risky if expansion slows or concentrates in a small number of accounts.
Gross and net answer different finance questions
Gross churn asks, “How much recurring revenue disappeared from the starting base?” Net churn asks, “After accounting for expansion, how did the existing base change?”
Track both. Gross churn is useful for assessing retention quality and forecasting replacement pressure. Net churn is useful for understanding whether the installed base can grow without relying entirely on new logos. If the dashboard reports only net churn, a strong upsell motion may conceal deteriorating product fit among smaller or less engaged customers.
The second split is operational.
- Voluntary churn follows an intentional cancellation. Common drivers include poor fit, unclear value, budget pressure, or a competitive alternative.
- Involuntary churn follows a payment failure, expired card, billing error, or failed recovery process. The customer may not have intended to leave.
Recent benchmark reporting cited in industry coverage places B2B SaaS churn at 2.6% voluntary and 0.8% involuntary (the 2025 Recurly split cited by ChurnNote). A separate benchmark summary reports 4.1% annual SaaS churn, divided into 3.0% voluntary and 1.1% involuntary, while another reports overall annual SaaS churn at about 3.8% (the benchmark summary from Sender). The datasets use different scopes and methodologies, so they shouldn't be blended into one universal benchmark. They do support a practical conclusion: involuntary churn can represent a substantial, recoverable share of total loss.
Payment retries, dunning sequences, card-update prompts, invoice monitoring, and payment-method management address involuntary churn. Product changes and customer-success interventions address voluntary churn. Combining both categories into one “churn” queue sends teams toward the wrong remedy.
SaaS Churn Benchmarks by Segment
A good churn rate depends on who pays you, how they pay, and how difficult it is to replace your product. Enterprise SaaS commonly operates with stronger switching costs than SMB SaaS because integrations, migration work, retraining, and procurement processes make cancellation more disruptive.
The most defensible benchmark data in the available evidence is segment-specific. B2B SaaS benchmarks frequently treat less than 1% monthly churn as strong, translating to under 5% annual churn. Enterprise SaaS is often reported at 1% monthly or less and 10% annual churn or less, while SMB-focused SaaS commonly sees 30% to 58% annual churn (Recurly's SaaS churn benchmark research). Usage-based and freemium models can exceed 50% annual churn, reflecting lower commitment and easier cancellation (the 2025 benchmark coverage from Vena Solutions).
| Segment or model | Available benchmark context | Why the number behaves differently |
|---|---|---|
| B2B SaaS overall | Less than 1% monthly is often treated as strong, with 3.5% to 5% annual churn cited in recent benchmark reporting | Contracts, account value, and implementation depth vary |
| Enterprise SaaS | Often near 1% monthly or less, with annual churn at or below 10% | Integrations, procurement, and migration costs raise switching friction |
| SMB-focused SaaS | Often 30% to 58% annual churn | Shorter commitments, price sensitivity, and lower switching costs increase attrition |
| Usage-based or freemium | Can exceed 50% annual churn | Low commitment and easy cancellation make logo retention fragile |
The available verified data doesn't support inventing a universal monthly revenue-churn band for every segment. That's a feature, not a gap to fill with false precision. Revenue churn depends on account concentration, pricing structure, usage, downgrades, and expansion. A business with many low-ACV customers can tolerate more logo loss than an enterprise vendor whose revenue sits in a small number of accounts.
For a broader discussion of how companies normalize these differences, compare the SaaS churn rate benchmarks by customer profile rather than copying a single industry average. Benchmark steady-state cohorts against comparable businesses, and treat early post-launch churn separately because immature onboarding and evolving product fit can distort the number.
Leading Indicators and Cohort Analysis
Headline churn is a lagging metric. By the time a cancellation appears in the monthly report, the customer may have been disengaging for weeks or months. The operator's advantage sits in the signals that precede the event.
A churn cohort groups customers by a shared start period, such as the month they subscribed. Track each cohort's retention curve by ACV band, plan tier, acquisition channel, payment method, and customer size. A cohort analysis framework helps separate a deteriorating recent cohort from a stable installed base.
Read the shape, not only the average
An early drop in a cohort heatmap points toward onboarding, activation, or sales-expectation problems. A later decline may indicate value erosion, renewal friction, budget pressure, or competitive switching. The shape tells you when the relationship breaks, while the segment tells you where to investigate.
Useful leading indicators include:
- Usage decline: Fewer logins, active seats, workflows, or meaningful product actions can precede cancellation.
- Support friction: Repeated unresolved tickets or a rising volume of similar complaints can signal declining confidence.
- Customer sentiment: Detractor feedback and negative survey responses can identify accounts that need intervention.
- Payment events: Failed retries, expired payment methods, and unresolved invoices can forecast involuntary churn.
- Adoption breadth: A product embedded across a customer's workflow is usually harder to replace than a feature used by one person.
Don't treat every signal as a prediction on its own. A login decline may reflect seasonality, a team restructure, or successful automation. Combine behavioral data with contract timing, account value, support history, and payment status before assigning a retention action.
Teams that want better qualitative evidence can use boost loyalty with targeted surveys to ask focused questions at activation, after a support interaction, and before renewal. The purpose isn't to collect more feedback. It's to connect an answer to a customer segment and an intervention owner.
Strategies to Reduce Churn and Tie Them to Revenue
Churn reduction works when the remedy matches the cause. A product redesign won't fix an expired card, and a payment retry won't repair a customer who never reached meaningful value.
Match the intervention to the loss
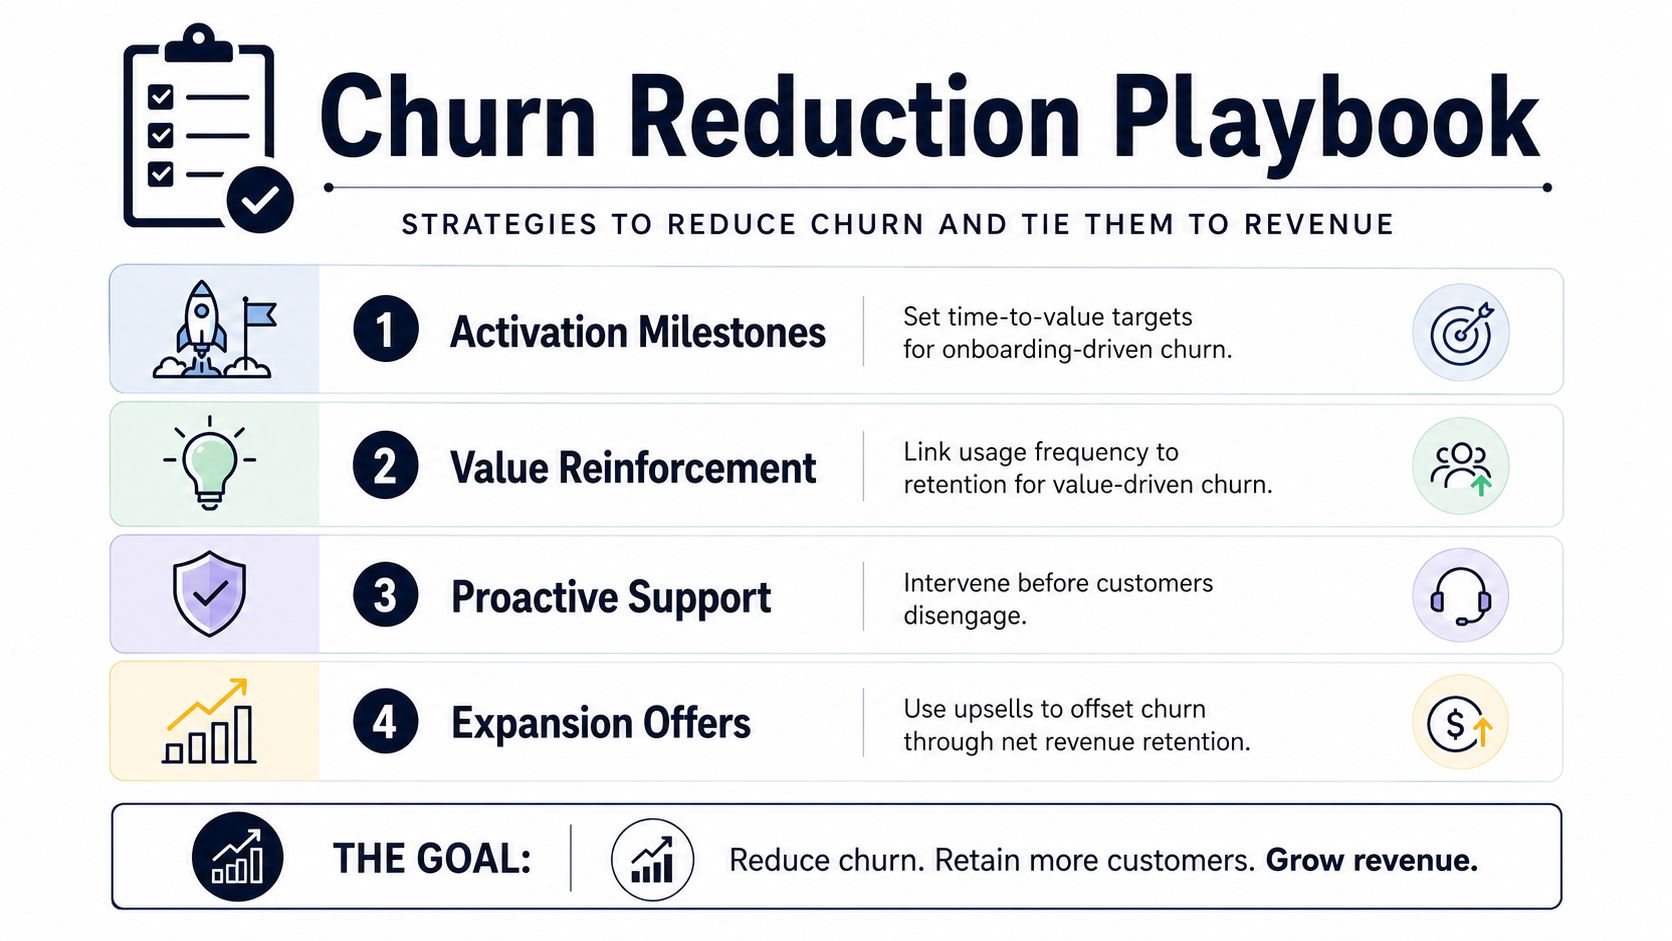
Onboarding-driven churn needs a clearer path to activation. Define the first meaningful outcome, instrument the milestones that precede it, and give customer success a trigger when an account stalls. Measure retained MRR from accounts that reach activation, not only completion of onboarding tasks.
Value-driven churn requires adoption evidence. Create alerts when active seats, core workflows, or usage frequency fall below an account's established pattern. A customer-success manager can then investigate whether the cause is training, a missing capability, organizational change, or a weak initial use case.
Price-sensitive churn calls for controlled options before cancellation. A lower tier, usage-based plan, temporary pause, or narrower deployment may preserve an account that would otherwise disappear. The commercial decision should compare the expected retained MRR with the cost of the concession, rather than treating every discount as a win.
Involuntary churn belongs first to billing and finance operations. Configure payment retries, dunning messages, card-update flows, invoice reminders, and escalation rules. Because the customer may not have chosen to leave, these interventions can recover revenue without changing the product experience.
Operational test: Every churn-reduction initiative should name the churn category, the customer segment, the owner, and the MRR it aims to protect.
Turn feedback into a retention roadmap
Support tickets, sales calls, product usage, and renewal notes often describe the same problem in different language. Product-intelligence tools can cluster those signals, identify recurring friction, and rank issues by their connection to at-risk revenue. SigOS, for example, analyzes support tickets, sales calls, and usage data to provide churn-risk scores for teams to investigate, while its product materials describe forecasting churn impact before development work begins.
That workflow helps product teams avoid prioritizing the loudest request. A small usability issue affecting a high-value cohort may deserve attention before a popular feature request with little retention impact. Use reducing churn rate as a reference point for connecting retention programs to measurable operating decisions.
Putting It Together for Your SaaS Business
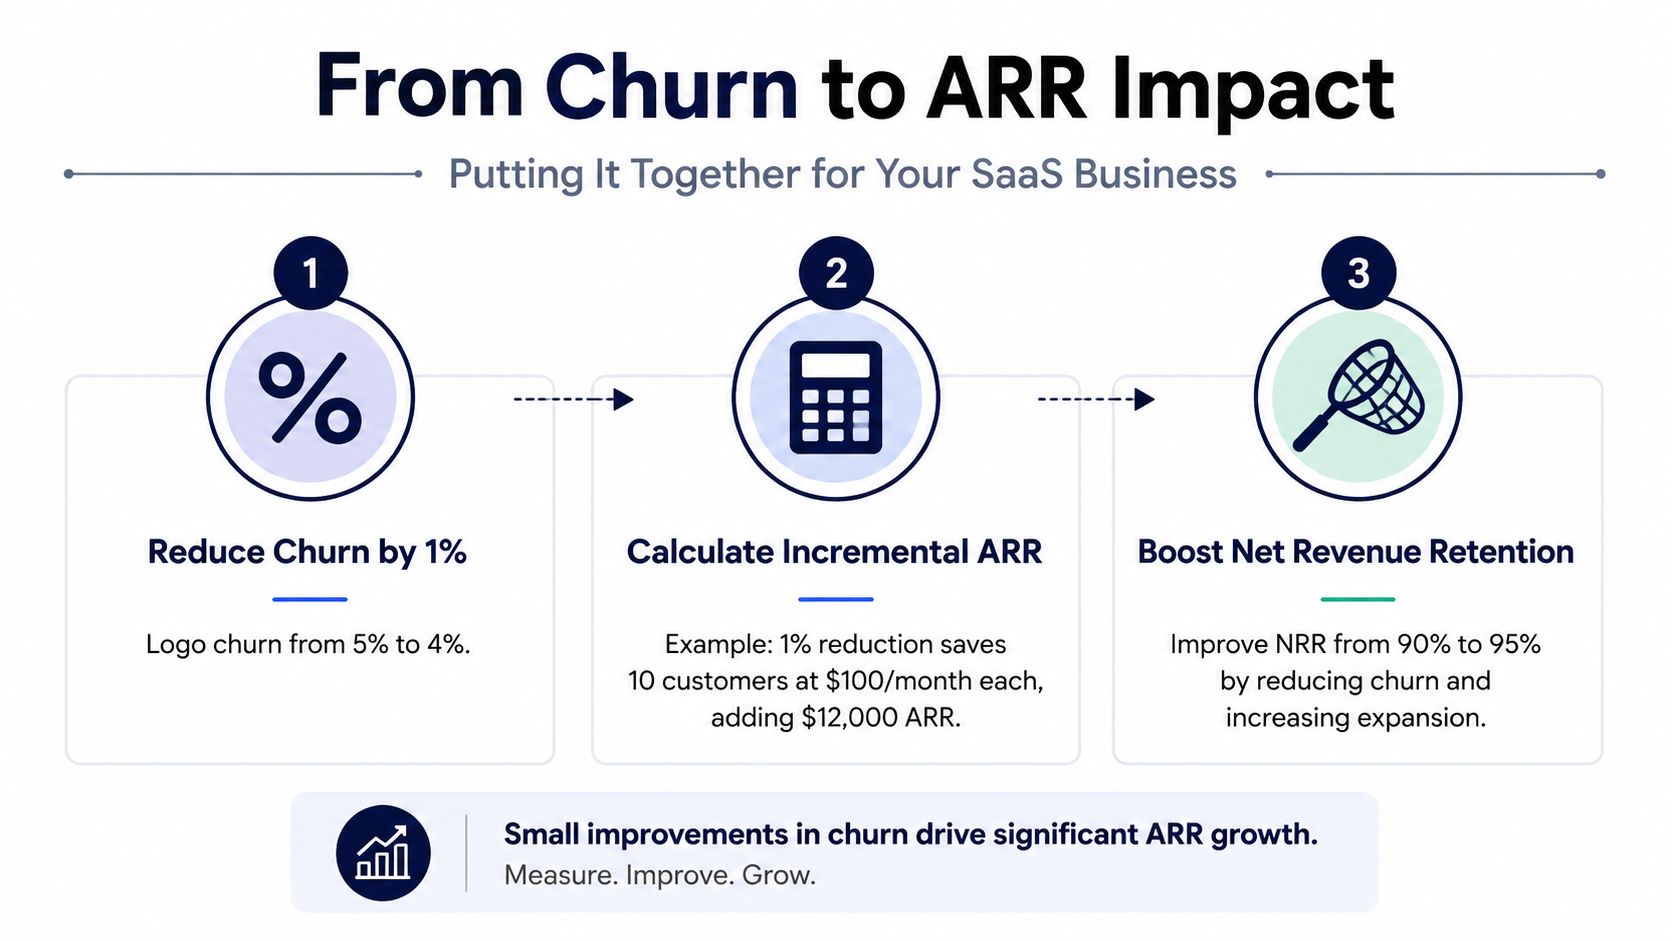
A churn improvement becomes financially meaningful only after you translate it into retained recurring revenue. The arithmetic is straightforward: identify the MRR that would otherwise leave, multiply it by the number of periods it remains, and then adjust the forecast for expansion, contraction, and future churn. The result is an estimate of incremental ARR, not a guaranteed outcome.
Suppose a cohort contains customers paying 100 MRR each, and a retention initiative prevents the loss of 10 customers. The retained MRR is ****1,000, and the corresponding annualized recurring revenue is $12,000. That example shows the bridge from a logo metric to revenue, but it doesn't prove that every 1% reduction produces the same result. The customer count, ACV, timing, and segment determine the actual impact.
The right operating system combines the two churn lenses with the two cause categories.
The first 30-day checklist
- Instrument both measures: Report logo churn and gross MRR churn from the same opening cohort and period.
- Segment the base: Break results down by enterprise, mid-market, SMB, plan, ACV, acquisition channel, and contract structure where those dimensions exist.
- Separate causes: Label voluntary cancellations, downgrades, payment failures, and reactivations independently.
- Set relevant benchmarks: Compare each customer band with an appropriate benchmark instead of forcing every segment toward one target.
- Review cohorts monthly: Look for early onboarding dropoff, late-stage value erosion, and changes in retention by acquisition source.
- Assign indicator owners: Give customer success, product, finance, and billing clear responsibility for the signals they can change.
- Model revenue impact: Tie each retention initiative to protected MRR, gross churn, expansion, and NRR.
The deeper conclusion is that churn reporting should end with a prioritized decision, not a dashboard screenshot. If the number rises, leaders need to know whether customers are leaving, whether revenue is leaving faster than logos, whether expansion is masking losses, and whether billing operations can recover part of the damage. That requires product, finance, customer success, and billing data in the same analysis.
SigOS helps SaaS teams connect support tickets, sales conversations, and product-usage signals to churn risk and revenue impact, so retention work is prioritized around evidence rather than anecdotes. Visit SigOS to see how its product-intelligence platform can help turn scattered customer feedback into a focused churn-reduction roadmap.
Keep Reading
More insights from our blog



Ready to find your hidden revenue leaks?
Start analyzing your customer feedback and discover insights that drive revenue.
Start Free Trial →