What Is Behavioral Data and Why SaaS Teams Need It
Learn what is behavioral data, how SaaS teams use it to predict churn, spot expansion signals, and prioritize features, plus privacy rules and an implementation
Behavioral data is the record of what users do across product, support, and sales touchpoints, modeled as timestamped events rather than what they say about themselves in surveys or profiles. Each event can carry context such as time, device, location, and source, which lets teams interpret intent, engagement, and likely next actions.
The popular advice is to track everything. That's usually how teams create a crowded event stream, weak definitions, privacy exposure, and dashboards nobody trusts. The useful approach is narrower: connect the actions that matter to product adoption, friction, retention, expansion, and revenue decisions.
For SaaS teams, that means looking beyond clicks. Product usage, support tickets, sales calls, and session events form a combined signal. A customer may describe the product as valuable while abandoning a core workflow, opening repeated support requests, and avoiding an expansion conversation. Behavioral data helps expose that gap, but only when teams analyze change over time and govern what they infer.
What Behavioral Data Actually Is
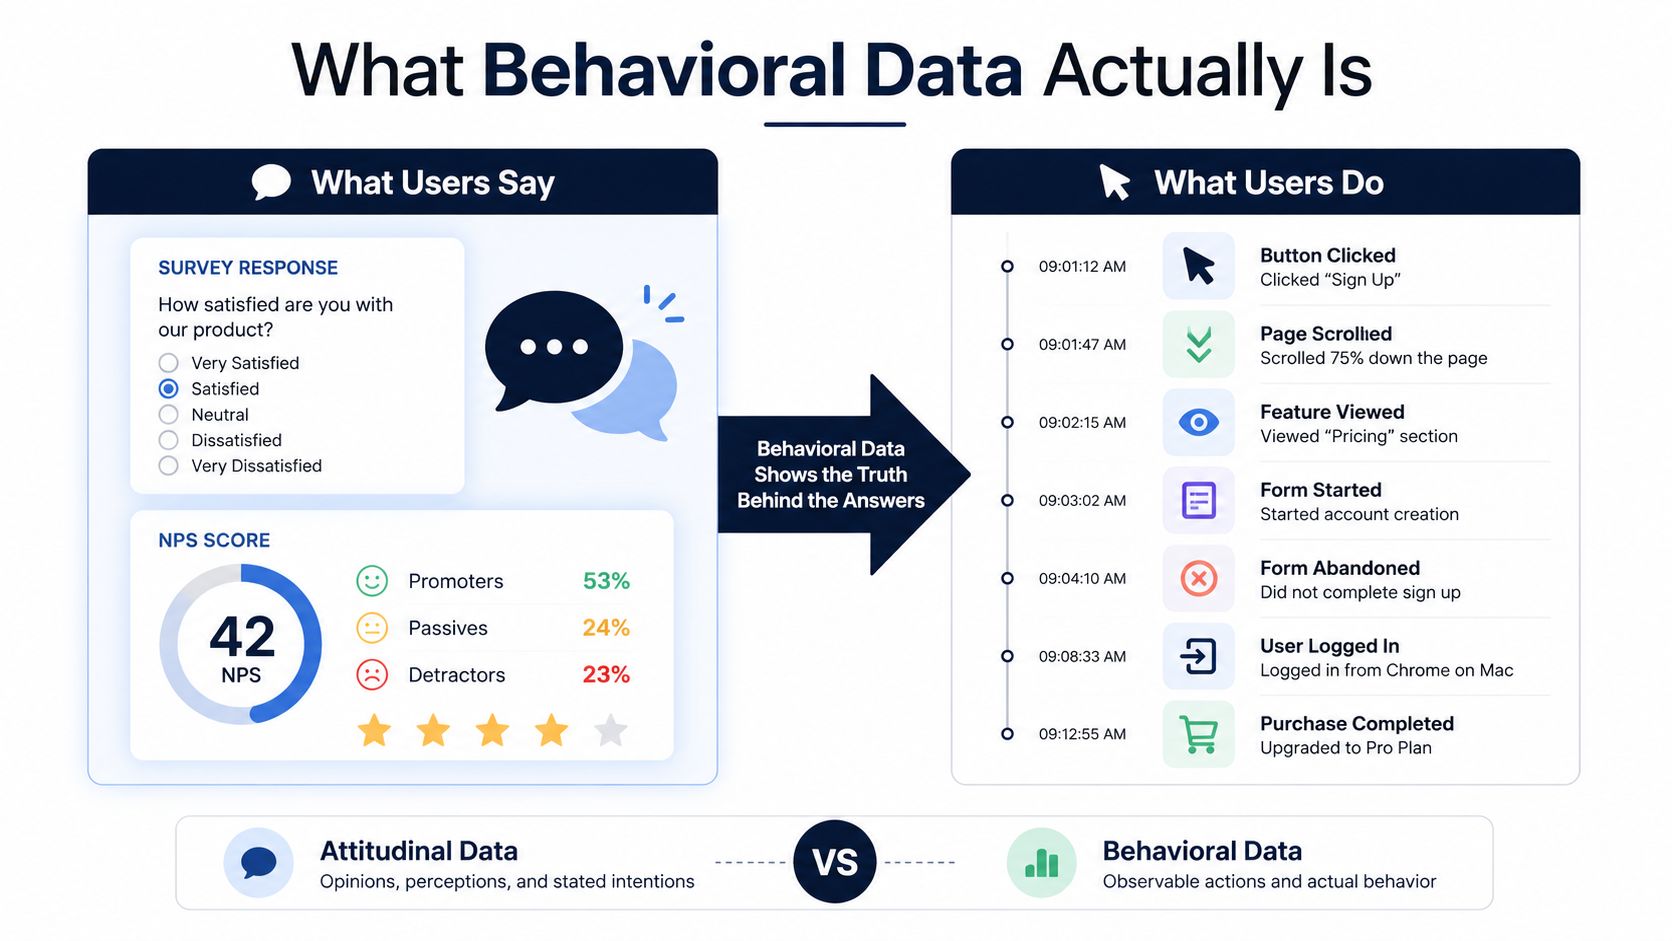
A survey captures what a user remembers and chooses to report. Behavioral data captures what that user does. Those answers can agree, but they often reveal different parts of the customer experience.
Behavioral data is an event-based record of actions across digital and physical touchpoints. A page view, click, login, purchase, support interaction, app action, or sales engagement can be stored as an event with contextual properties such as a timestamp, device, location, or acquisition channel. The CDP.com explanation of behavioral data describes this distinction clearly: demographics tell you who someone is, while behavioral data shows what they do.
Events are more useful than isolated counts
A raw login count says little by itself. A sequence of logins followed by a failed configuration attempt, a support conversation, and a drop in feature usage says much more. The sequence gives product and customer teams a way to investigate intent and friction instead of treating activity as proof of health.
This is also why behavioral data differs from traditional web analytics. Pageviews and sessions can describe traffic, but a richer behavioral record connects product interfaces with support systems, CRM activity, call centers, email, marketing automation, and other operational sources. The historical shift toward timestamped event tracking made it practical to reconstruct journeys across channels rather than rely only on surveys or periodic reports, as Snowplow's overview of behavioral data explains.
Practical rule: Treat an event as evidence, not a conclusion. The meaning comes from its context, sequence, audience, and change over time.
Inference is part of the data problem
Teams rarely stop at recording actions. They infer states from patterns, labeling an account as an active adopter, power user, disengaged customer, or churn risk. That inference can make behavioral data operational, but it also introduces uncertainty. A drop in usage might indicate dissatisfaction, a seasonal workflow, a change in internal ownership, or a successful migration to an API.
That distinction matters for behavioral segmentation. A segment based on observed actions can support a useful product intervention, but the label shouldn't be mistaken for a fact about the person or account.
Behavioral data is therefore raw material for predictive models, personalization, health scoring, and roadmap decisions. For teams evaluating broader signals beyond conventional market information, enterprise alternative data insights provide useful context for thinking about how nontraditional observations become decision inputs. The operational standard remains simple: connect each signal to a decision someone can make, and document what the system knows versus what it infers.
Where Behavioral Data Comes From in SaaS
A SaaS company usually has behavioral data before it has a behavioral data strategy. The events sit in separate systems, owned by different teams, with different identifiers and processing speeds. Product analytics may update quickly, while support tickets arrive in batches and sales-call notes depend on human discipline.
Product usage events
Product usage is the most familiar source. Feature clicks, workflow completions, API calls, configuration changes, invitations, exports, and permission updates reveal whether an account has moved from initial exposure to meaningful adoption.
The useful question isn't “How many times was this feature clicked?” It's “Which account behaviors precede successful renewal, expansion, or repeated value?” A team that uses a core workflow intensely but never touches an advanced capability has a different opportunity from a team that repeatedly configures the advanced capability and then abandons it.
Server-side events are often more reliable for critical actions because they can be tied to completed transactions or state changes. Client-side events remain valuable for interaction detail, but they need validation and consistent naming. A practical guide to tracking app usage can help teams define the events that matter before they instrument every interface element.
Support tickets and conversations
Support data exposes friction that product events can't explain. Ticket themes, repeated questions, escalation frequency, unresolved feature requests, and sentiment in chat transcripts can signal that a customer is working hard to obtain value.
Support volume doesn't automatically mean churn risk. A new customer may open many tickets because they're actively implementing the product. The stronger signal is the relationship between support activity and product behavior. Repeated tickets about a workflow alongside declining usage can justify intervention; high support activity alongside expanding adoption may indicate healthy investment.
Sales and success calls
Sales calls and customer-success conversations add intent and organizational context. Objections, mentions of competing tools, requests for additional seats, expansion discussions, and stakeholder changes can explain why usage is rising or falling.
Call data also has a freshness trade-off. A live or near-real-time product event can trigger a timely alert, while a call summary may not be available until someone records it in the CRM. Batch processing is acceptable for strategic analysis, but it can weaken use cases that require rapid outreach.
Session-level events
Session events show how users experience the interface. Time on page, scroll depth, navigation paths, repeated clicks, backtracking, and rage clicks can expose breakdowns that aggregate product events hide.
| Data Source | Example Events | Primary Revenue Signal | Typical Latency |
|---|---|---|---|
| Product usage | Feature use, workflow completion, API activity | Adoption, retention, expansion | Real-time or near real-time |
| Support systems | Ticket themes, escalations, chat interactions | Friction, churn risk, unmet demand | Batch or near real time |
| Sales and success calls | Objections, expansion intent, stakeholder changes | Pipeline quality and account growth | After note or transcript processing |
| Session analytics | Rage clicks, scroll depth, navigation paths | Conversion friction and product usability | Near real time or batch |
The compounding value comes from joining these sources around an account, user, workspace, or journey. Instrumenting only product clicks leaves the explanation for behavior in another system.
How Teams Analyze Behavioral Signals
Raw event volume creates confidence quickly and insight slowly. A dashboard can show more logins, more clicks, or longer sessions while users struggle to complete the task that matters. Behavioral analysis works better when teams measure direction, context, and cohort differences.
Start with rolling windows
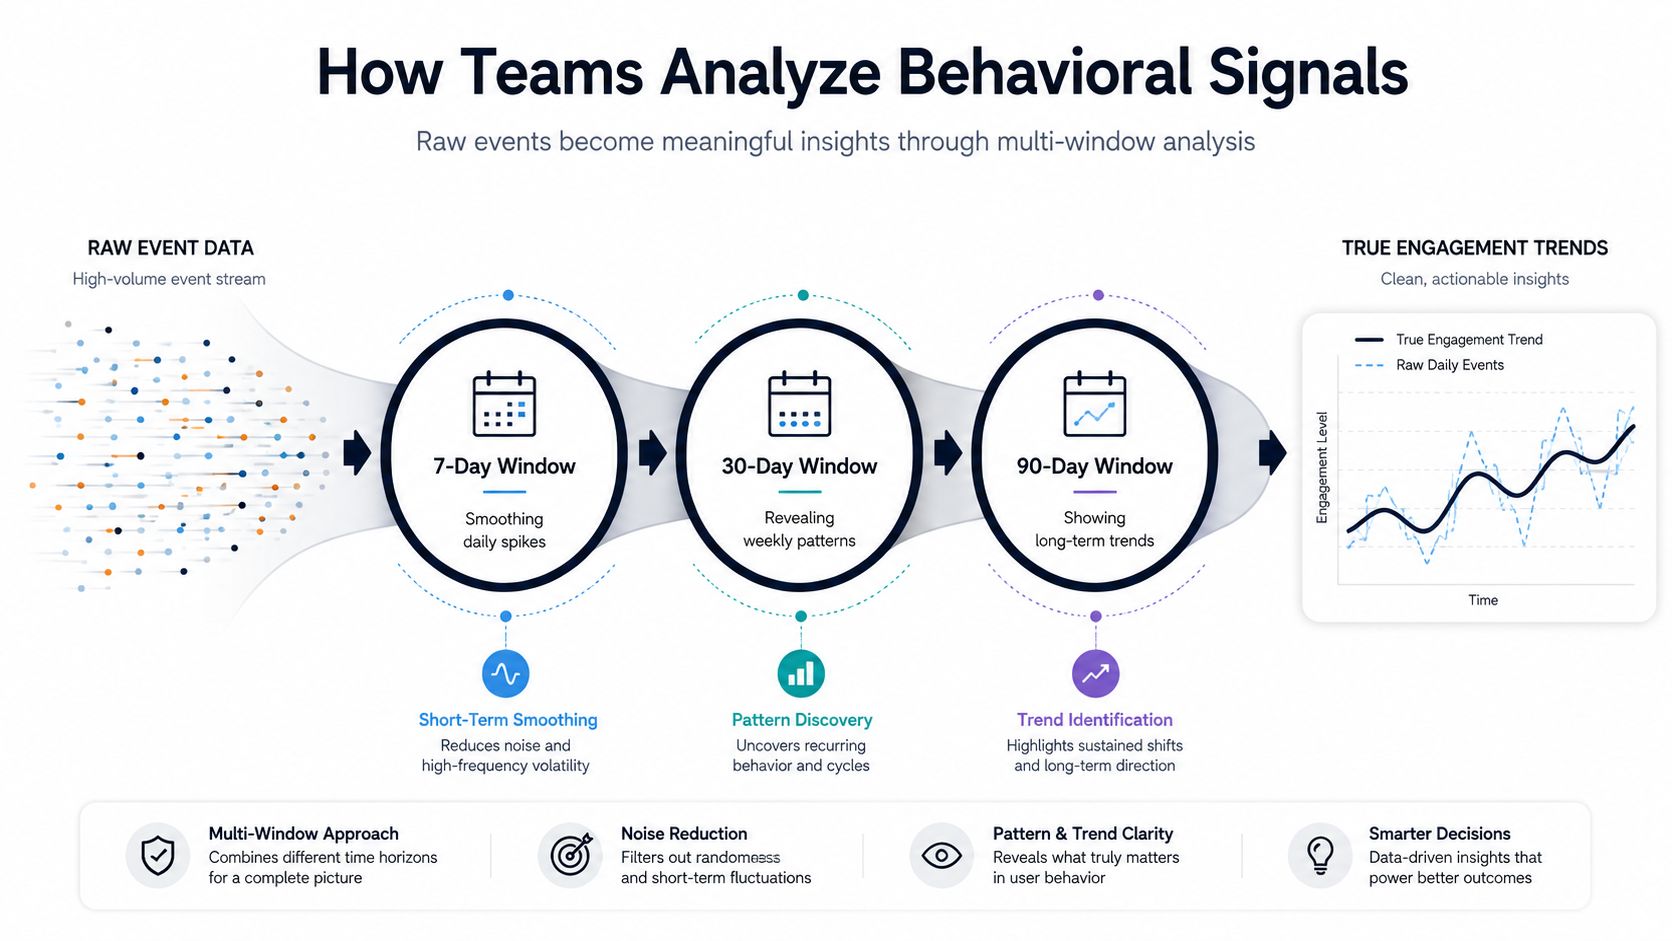
Use multiple observation windows instead of a single snapshot. A short window can expose a recent usage drop, a medium window can reveal a recurring pattern, and a longer window can show whether adoption is becoming durable.
The exact windows depend on the product's usage cycle. Daily-use software needs different monitoring from a product used around monthly reporting or quarterly planning. The principle is stable: compare recent behavior with a relevant baseline, and avoid treating one unusually active day as adoption.
Measure change, not just volume
A high number of logins can come from one user troubleshooting a broken workflow. A lower count spread across a healthy team may reflect more efficient usage. Teams should pair volume measures with trend features such as:
- Recent-versus-baseline activity: Compare current usage with the account's normal behavior.
- Slope and direction: Identify whether adoption is accelerating, flattening, or declining.
- Week-over-week deltas: Detect meaningful movement without overreacting to daily noise.
- Moving averages: Smooth irregular activity so teams can distinguish a pattern from an isolated event.
- Sequence changes: Observe what actions happen before conversion, support escalation, or abandonment.
Research on churn modeling links stronger predictions to behavioral changes such as declining purchase frequency, shorter browsing sessions, reduced communication, increased cart abandonment, support volume, and weaker feature adoption depth. The published churn-modeling research supports a practical conclusion: rolling-window features and temporal trends are more useful than one-time counts.
Compare cohorts with a meaningful starting point
Cohort analysis prevents averages from flattening important differences. Group users by an activation milestone, onboarding path, first completed workflow, plan type, or implementation stage, then track how their later behavior diverges.
A product analytics platform suits teams that need fast self-serve exploration. A customer data platform helps unify identities and activate segments across systems. Warehouse-native analytics gives data teams greater control over definitions, joins, and governance. None of these tools fixes an unclear event taxonomy.
A metric becomes useful when a team can explain what action it should trigger.
Vanity metrics fail that test. Total event counts without a business context can lead teams to optimize a popular but low-value feature while ignoring a quiet workflow that determines renewal.
SaaS Use Cases That Drive Revenue and Retention
Behavioral data earns its place in a SaaS operating model when it changes a revenue decision. Three use cases consistently create that connection: identifying risk, finding expansion timing, and prioritizing product work.
Churn prediction needs a composite signal
An account that logs in less often and opens more support tickets deserves a different review from an account with stable usage and occasional questions. The first pattern combines a declining product signal with rising friction. NPS can add useful context, but it shouldn't stand in for observed adoption and service experience.
A practical workflow starts by defining the account's normal usage, then monitoring rolling changes in core actions. Add support themes and escalation behavior, check for recent sales or success context, and route only interpretable risk patterns to customer success. The action might be a technical review, an onboarding intervention, or an executive conversation, depending on the evidence.
Expansion signals appear in adoption depth
Expansion usually follows a customer discovering additional value, not merely using the product more often. A team moving from basic reporting into automated workflows, advanced permissions, integrations, or broader collaboration may be demonstrating readiness for a growth conversation.
The signal becomes stronger when product adoption aligns with account context. A customer who repeatedly reaches the limits of a workflow, invites new stakeholders, or asks about advanced capabilities may need a commercial conversation. Sales shouldn't receive a generic “high engagement” alert. It should receive the behavior, the account context, and the reason the pattern matters.
Roadmap choices improve when evidence crosses sources
Suppose session events show repeated clicks around one control, while support tickets repeatedly describe confusion in the same workflow. Product managers now have both a quantitative friction pattern and qualitative customer language. That evidence can change prioritization more convincingly than a single loud request.
The method is triangulation. Use session data to locate the problem, support data to understand the complaint, and account data to estimate its commercial importance. The result isn't automatic truth, but it is a defensible basis for deciding whether to redesign, document, simplify, or defer the workflow.
| Use Case | Key Behavioral Signals | Analysis Method | Business Action |
|---|---|---|---|
| Churn prediction | Usage decline, support escalation, reduced workflow depth | Rolling trends and composite account review | Customer-success intervention |
| Expansion | Advanced feature adoption, stakeholder growth, repeated capacity friction | Cohort comparison and account enrichment | Timely sales or success outreach |
| Feature prioritization | Repeated clicks, abandonment, ticket themes, call objections | Funnel, path, and cross-source analysis | Reorder roadmap or improve workflow |
The point isn't to collect every possible event. It's to connect a small set of reliable signals to a decision at the moment that decision still matters. Teams exploring this operating model can review behavior analytics for SaaS teams as one practical reference.
Privacy and Compliance Risks You Cannot Ignore
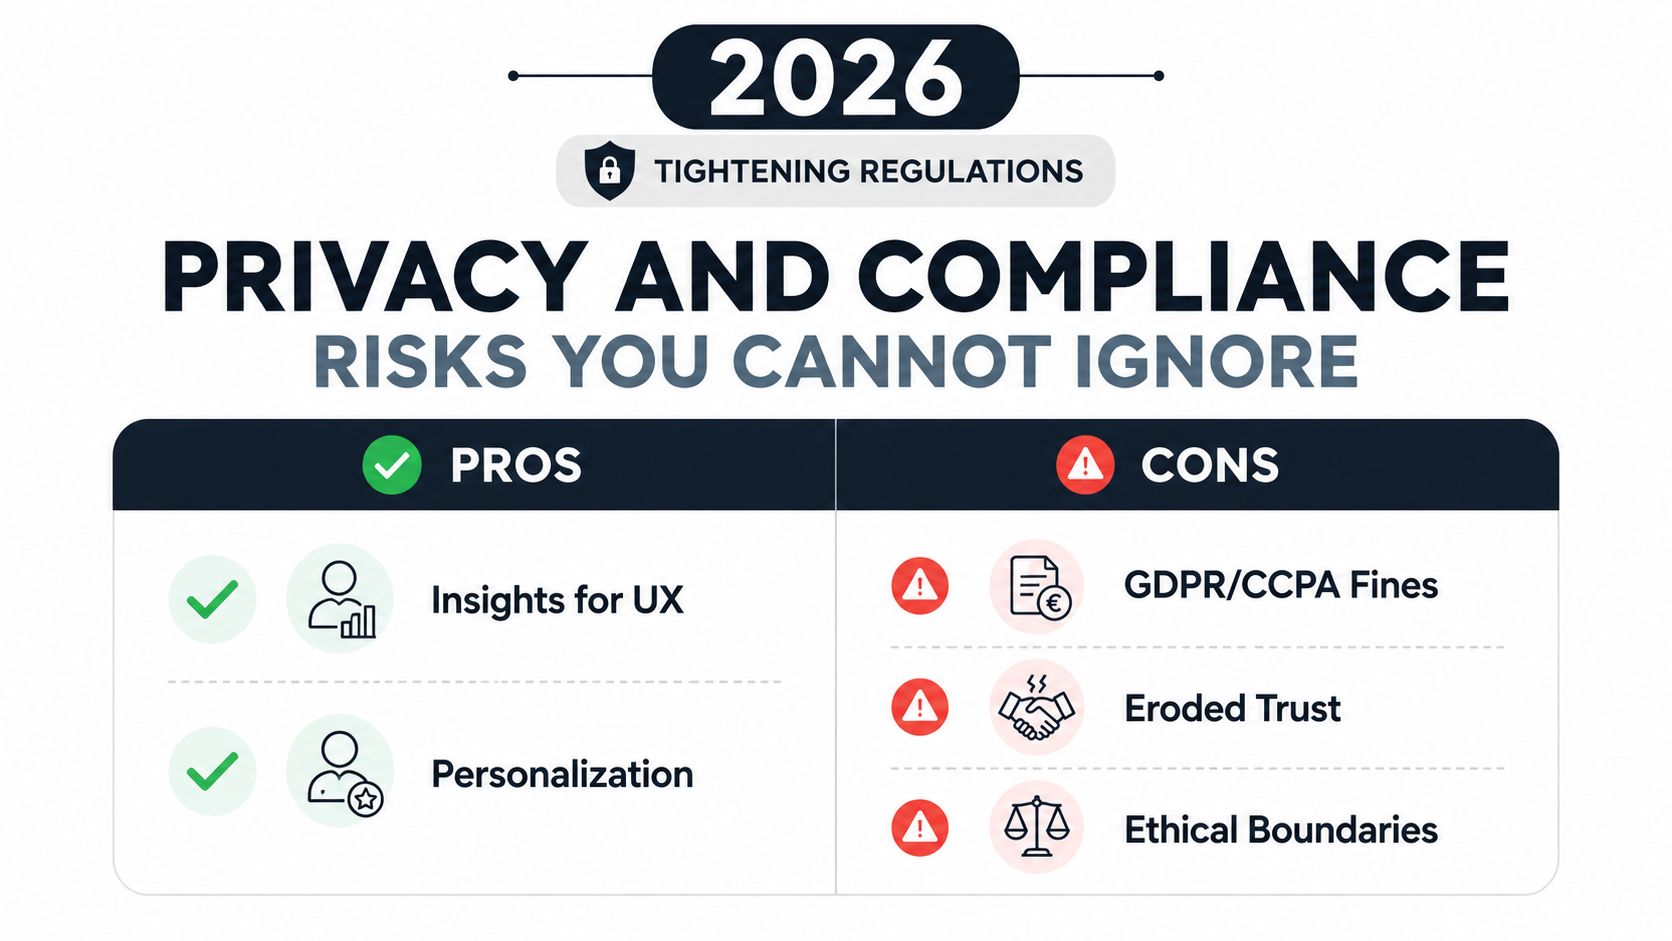
Behavioral data becomes a compliance problem when teams treat inferred intent like ordinary product telemetry. A combined signal from product usage, support tickets, sales calls, and session events can expose patterns that users never directly supplied.
Behavioral inference creates a separate compliance exposure. A model-labeled churn risk can receive different legal treatment than directly supplied profile data, yet many instrumentation plans do not document that second layer. A team might infer disengagement, financial pressure, technical blockage, or likelihood to leave from otherwise routine activity.
The issue is becoming more operationally important in the United States. Commentary on new U.S. state privacy laws in 2026 describes movement toward treating some device-level behavioral data as sensitive, including automated content recognition and smart-monitor data. Teams should therefore define behavioral data broadly enough to cover product activity, conversations, support context, and inferred traits.
Session capture requires deliberate boundaries
Session replay and recording show interaction detail, but they can also collect sensitive fields unintentionally. Set redaction rules, masking, access controls, retention policies, and documented purposes before replay data reaches broad internal audiences.
Teams should ask:
- What is necessary: Which events support a defined product or service purpose?
- What is inferred: Which labels come from models rather than direct user statements?
- Who can access it: Can support, product, sales, and vendors see the same raw detail?
- How long is it kept: Does retention match the use case and applicable obligations?
- Where is it processed: Do transfers and vendors meet the organization's privacy requirements?
For a concrete comparison point, teams can review how NotFair handles data while evaluating vendor governance. The internal requirements remain clear: document consent, minimize collection, protect identifiers, and give users meaningful transparency.
Before expanding instrumentation, classify events by sensitivity, separate operational telemetry from inferred traits, define approved uses, review cross-border processing, and create an escalation path for automated decisions. Privacy review belongs in the design of the signal, before a model flags a customer as at risk.
The benchmark also challenges the assumption that more activity means a healthier experience. According to FullStory's 2025 benchmark of 14 billion sessions, scroll depth fell from 75% to 67%, mobile rage clicks rose 15.6%, and exits after errors climbed 29% year over year. Signal quality and interpretation matter as much as collection. More interaction can indicate struggle rather than engagement.
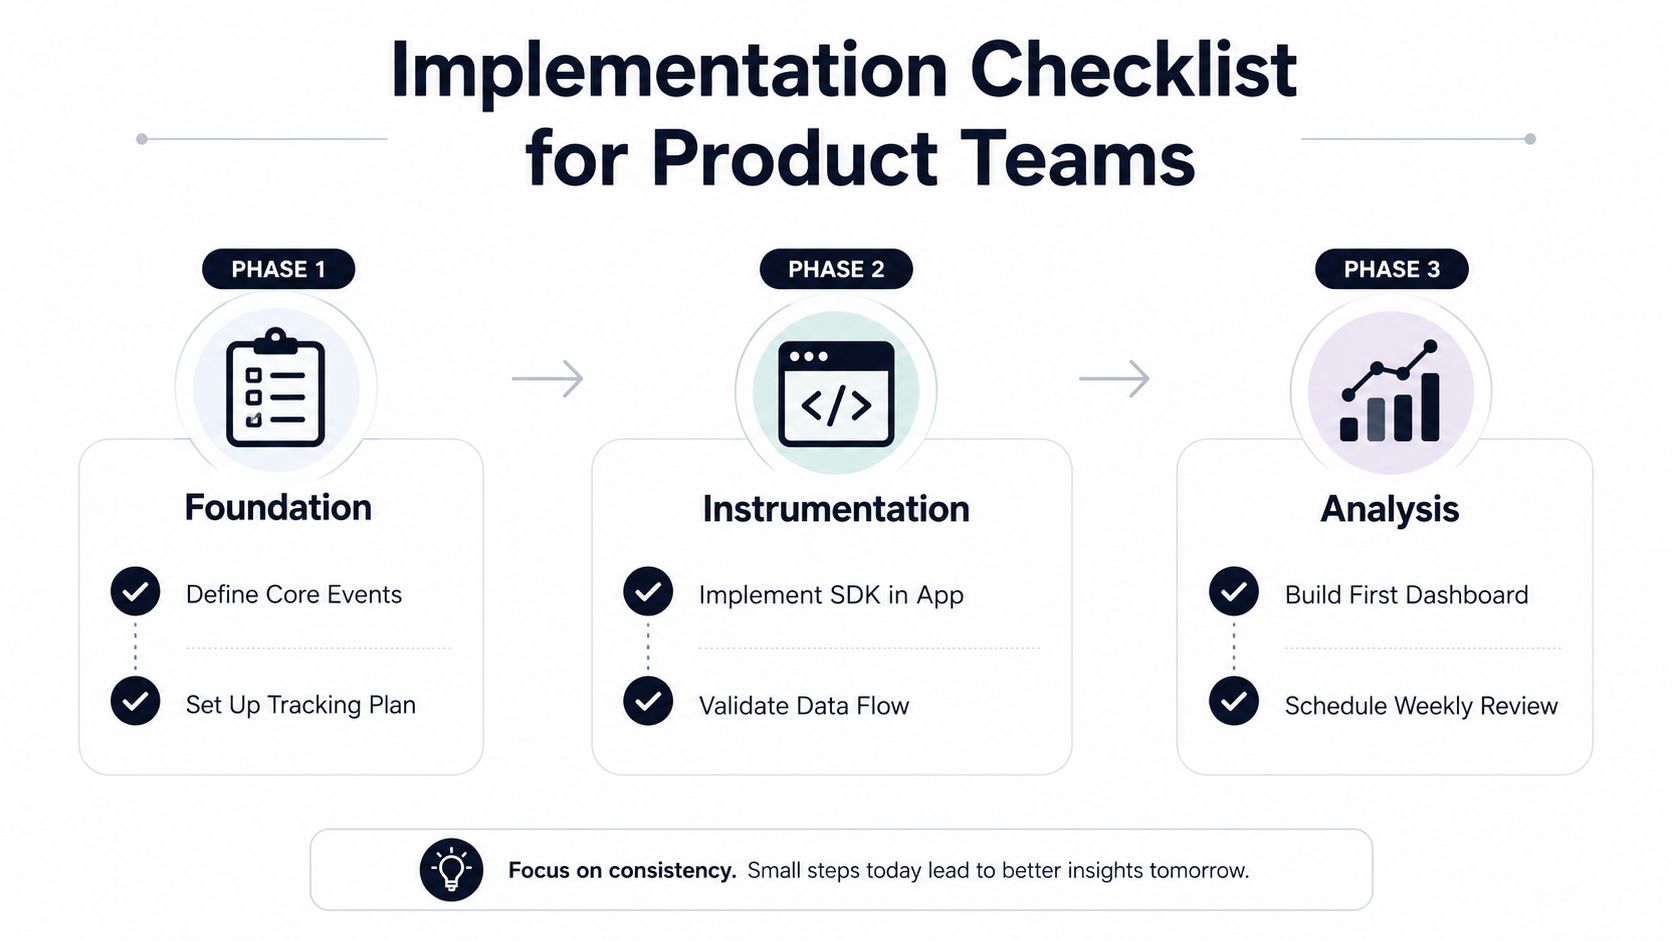
Implementation Checklist for Product Teams
A behavioral data program can start small. The first quarter should produce reliable coverage for revenue-critical journeys, not an encyclopedic record of every interface action.
Phase one builds the foundation
Product owns the event taxonomy. Define names, properties, actors, account identifiers, and allowed values for the core workflows. Include the actions that represent activation, value delivery, friction, and expansion. Keep the list short enough that engineering and analysts can maintain it.
Engineering implements critical events. Use server-side tracking for completed product states, billing-relevant actions, and workflow outcomes. Add client-side events where interaction detail is necessary, then validate that duplicate events, missing properties, and identity mismatches don't distort the record.
Support or operations connects ticket metadata. Bring in ticket category, status, escalation, product area, and account identifiers from systems such as Zendesk or Intercom. Avoid importing unnecessary message content until the team has a clear purpose and access policy.
Phase two makes the data usable
Join events to account-level context such as plan, segment, implementation stage, and ownership. Data engineering should choose between warehouse-native analysis and a dedicated product analytics platform based on governance needs, analyst capacity, and how quickly teams need self-serve answers.
Set up monitoring for event volume, schema changes, missing identifiers, delayed ingestion, and unexpected property values. A broken event pipeline can create more damage than an incomplete one because stakeholders may trust incorrect dashboards.
Phase three connects signals to action
Build three initial views:
- Product owns adoption: Show activation milestones, feature depth, and cohort movement.
- Customer success owns health: Combine usage changes with support friction and account context.
- Revenue owns opportunity: Surface advanced adoption, stakeholder growth, and expansion behavior.
Schedule a recurring review with all three groups. Add alerts only for patterns that have a defined owner and response. Product can investigate an adoption anomaly, customer success can respond to a usage decline, and data can audit the underlying events.
Turning Behavioral Data Into a Product Operating System
Behavioral data becomes valuable when it connects capture, interpretation, and action. It should inform roadmap prioritization, customer health, expansion plays, and churn intervention rather than sit in a dashboard that nobody reviews.
This quarter, audit event coverage against the revenue-critical journeys already identified. Create one cross-functional behavioral health dashboard that product, customer success, and revenue teams use in their regular reviews. Then automate one response, such as routing a sustained usage decline to customer success or sending an expansion signal to the responsible sales owner.
The strongest systems also join product usage with support, sales, and session evidence. That combination helps teams distinguish intent from frustration and meaningful adoption from noisy activity. Behavioral data compounds in value only when it changes decisions.
SigOS helps product and growth teams connect support tickets, chat transcripts, sales calls, and usage metrics to patterns associated with churn, expansion, and revenue impact. Visit SigOS to see how a continuous behavioral analysis workflow can turn fragmented customer signals into prioritized product and revenue actions.
Keep Reading
More insights from our blog


Ready to find your hidden revenue leaks?
Start analyzing your customer feedback and discover insights that drive revenue.
Start Free Trial →