Customer Churn Prevention: A Practical SaaS Playbook
A step-by-step customer churn prevention playbook for SaaS teams. Learn metrics, signals, workflows, experiments and ROI measurement that actually work.

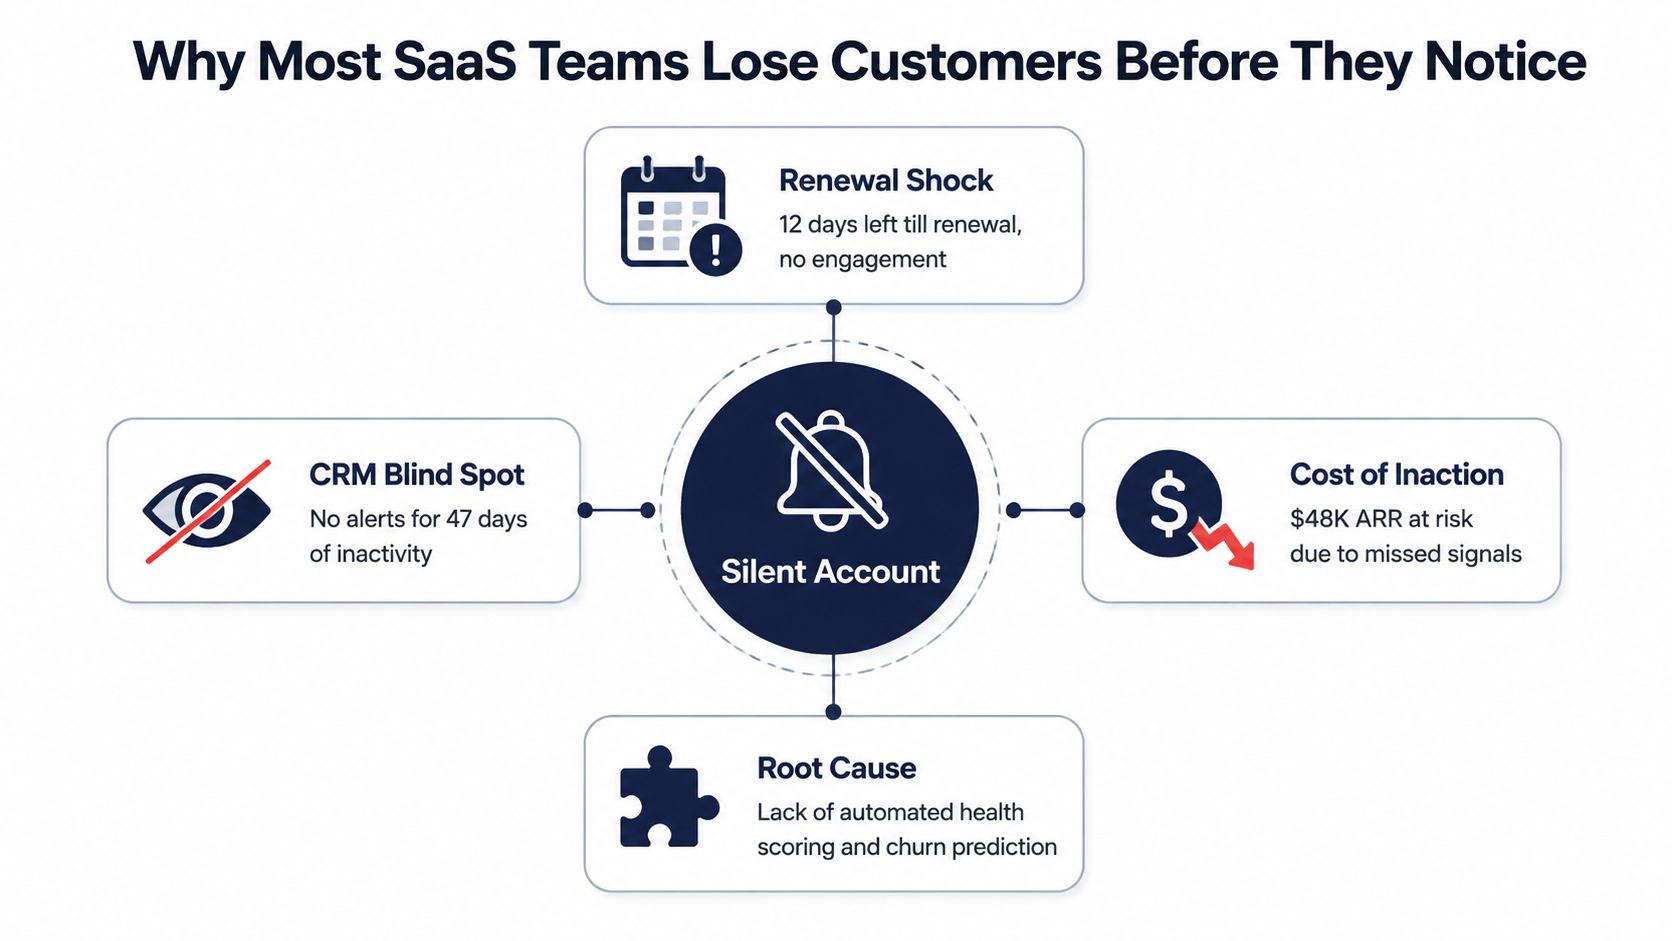
A CSM opens the CRM and finds a $48K ARR account that's been silent for 47 days. Renewal is in 12 days, no one has raised a risk flag, and the account's health score still looks acceptable because it was built from stale inputs. The signal wasn't missing. Your operating model didn't turn it into an action.
That situation is common in SaaS. Customer churn prevention fails when teams measure cancellation after the invoice stops, then treat that lagging event as if it were an early warning. A workable program connects behavior, feedback, billing, prediction, ownership, intervention, and financial measurement before the renewal date arrives.
Why Most SaaS Teams Lose Customers Before They Notice
Start with a shared vocabulary. Voluntary churn happens when a customer actively cancels or declines renewal. Involuntary churn follows a failed payment, an incomplete dunning sequence, or another billing problem. Expansion churn is contraction inside an account that remains active, such as a downgrade or seat reduction that lowers recurring revenue.
Those categories matter because logo churn and revenue churn answer different questions. Logo churn tells you how many customer accounts disappeared. Revenue churn tells you how much recurring revenue left or contracted. A business can preserve its logo count while losing meaningful ARR through downgrades, and it can lose a small number of accounts while taking a much larger revenue hit.
Keep the related terms separate:
- Gross retention measures the recurring revenue retained before expansion offsets losses.
- Net retention includes expansion, contraction, and churn within the existing customer base.
- Contraction captures reduced spend from an account that hasn't fully left.
- Non-renewal is the customer's decision not to continue at the contract boundary.
- Dunning is the operational process used to recover failed payments.
Practical rule: If an alert doesn't name an owner and a next action, it isn't a retention system. It's a report.
The financial case for prevention is unusually strong. A 5% decrease in churn can raise company revenue by 25% to 95%, and acquiring a new customer can cost six times more than retaining an existing one, according to Qualtrics' customer churn statistics compilation. That source also lists average U.S. customer churn at 21% and estimates that U.S. businesses lose about $168 billion annually because of churn. These figures explain why retention has moved from a back-office metric to a board-level growth variable.
The recurring failure mode is simple. Teams wait for a cancellation, classify the reason, and celebrate a win-back. By then, the customer may have disengaged weeks earlier, lost its internal champion, or concluded that switching is safer than explaining the problem.
Defining Churn Metrics and Cohorts That Actually Drive Decisions
Choose the metric that matches the decision you need to make. Early-stage SaaS teams often need a clean customer churn rate to understand whether the account base is stabilizing. Product-led and enterprise businesses usually need dollar retention views because account size, downgrades, and expansion can make logo counts misleading.
Use explicit formulas and a consistent reporting window:
- Customer churn rate = customers lost during the period ÷ customers at the start of the period.
- Gross revenue retention = starting recurring revenue minus churn and contraction, divided by starting recurring revenue.
- Net revenue retention = starting recurring revenue minus churn and contraction plus expansion, divided by starting recurring revenue.
- Revenue churn = recurring revenue lost through churn and contraction, divided by recurring revenue at the start of the period.
For volatile businesses, review trailing 3-, 6-, or 12-month windows rather than reacting to a single month. The right window depends on contract length, seasonality, and sales volume. Use the same definition in board reporting, experiment analysis, and customer success reviews, or the team will spend its time debating arithmetic instead of fixing leakage.
Build cohorts around causes, not convenience
A cohort is useful when it helps you decide what to change. Start with signup month or contract start month, then cut the data by plan tier, acquisition channel, ICP segment, onboarding path, and customer size. Add implementation complexity or primary use case if those dimensions are available and consistently recorded.
A Series B SaaS company might discover that most of its churn is concentrated in self-serve SMB accounts acquired through one paid channel. The right response isn't to tell every CSM to “engage more.” It's to inspect that channel's promise, activation path, pricing expectations, and support burden.
| Company stage | Primary metric | Secondary metric | Cohort cut |
|---|---|---|---|
| Early recurring-revenue SaaS | Customer churn rate | Gross revenue retention | Signup month and plan |
| Product-led growth | Net revenue retention | Expansion and contraction | Acquisition channel and activation path |
| Enterprise SaaS | Gross revenue retention | Logo churn and net revenue retention | ICP segment, contract type, and renewal cohort |
| Mixed customer base | Revenue churn | Customer churn rate | Plan tier, size, and onboarding motion |
Document the baseline before launching interventions. A practical retention cohort analysis should show starting customers, retained logos, churned logos, contraction, expansion, and the time since activation. Without that reference view, teams can claim improvement because the mix of new customers changed.
Instrumenting Behavior and Feedback Sources for Early Signals
A churn-ready signal set covers what customers do, where they struggle, what they pay, and what they report. Each stream fills gaps in the others. Login activity can decline because the product is embedded in a stable workflow, while support sentiment can worsen despite sustained usage.
Combine four signal streams
Behavioral data needs more than login counts. Track active users against purchased seats, feature adoption depth, time spent in important workflows, integration usage, and progress toward the customer's intended outcome. Session volume alone cannot show whether an account is receiving value. Teams building this layer can use behavior analytics guidance from SigOS to connect product actions with account-level patterns.
Support data exposes friction and urgency. Monitor ticket volume, repeated themes, sentiment changes, unresolved cases, and escalation patterns. Store structured issue categories beside ticket text. That combination helps product teams separate a one-off question from a recurring product failure and gives retention teams a clearer message for outreach.
Billing signals require their own pipeline. Payment retries, failed dunning, downgrade clicks, renewal-page visits, and invoice-behavior changes can surface involuntary churn risk or expansion intent before a cancellation appears. Industry summaries report that 20% to 40% of subscription churn may be involuntary, according to subscription churn benchmarks from GrowSurf. The same source reports that payment retry and dunning workflows may recover 20% to 30% of involuntary churn. Route these events to the team that can resolve payment friction, rather than treating every case as a product adoption problem.
Feedback data supplies customer context. Combine NPS detractor trends, CSAT movement, in-app survey answers, cancellation reasons, and exit-survey text. If you are replacing a survey platform, a SurveyMonkey alternative comparison can help assess whether response data, segmentation, and export workflows will support retention analysis instead of remaining in a separate reporting silo.
Protect the timeline
Two leakage patterns create false confidence:
- Look-ahead leakage uses information generated after the prediction point, such as a cancellation response or post-renewal support escalation.
- Label leakage uses a feature that exists because the customer has already decided to leave, such as a cancel-page visit in a model intended to detect earlier risk.
Define an event taxonomy in the warehouse with account ID, user ID, event time, source, event type, and lifecycle context. Set a feature-store cadence so analysts do not rebuild the same fields every sprint. A risk signal on a dashboard earns its place only when it reaches an owner, specifies the next action, and supports a timely customer message. That decision trail is what lets leadership connect instrumentation to retention lift rather than admire another chart.
From Predictive Signals to Profit-Aware Intervention Decisions
A churn score answers only half the retention question. It estimates who may leave, but it doesn't tell you who deserves a human intervention, which accounts can realistically be saved, or how much effort the action should receive.
A practical decision score combines:
- Churn probability, the estimated likelihood of loss during the actionable window.
- Customer lifetime value, or the revenue and margin value worth protecting.
- Save probability, the likelihood that a specific intervention will change the outcome.
- Intervention cost, including CSM time, specialist support, engineering work, credits, or discounts.
A simple expected-profit calculation is:
Expected profit = (value at risk × save probability) minus intervention cost
Value at risk can include current ARR, expected contribution margin, and credible expansion potential. The model shouldn't treat every account as interchangeable. A high-risk account with no reachable champion and a costly rescue plan may be a worse use of capacity than a moderately risky account with clear adoption friction and an engaged decision-maker.
For the worked example below, the values are illustrative decision inputs, not observed benchmark data.
| Account | ARR | Churn probability | Save probability | Intervention cost | Expected profit |
|---|---|---|---|---|---|
| A | $20,000 | 0.72 | 0.60 | $2,000 | $5,200 |
| B | $80,000 | 0.72 | 0.25 | $8,000 | $6,400 |
| C | $200,000 | 0.72 | 0.10 | $25,000 | $1,400 |
The accounts have the same churn probability, but the intervention priority changes once contract value, save likelihood, and cost enter the calculation. Account B may deserve the first staffed review, while Account C needs executive judgment rather than automatic escalation.
You can find a broader treatment of model inputs and evaluation in this churn prediction model guide. Tree-based ensembles such as Random Forest and XGBoost often outperform simpler baselines on churn tasks, but a stronger model won't rescue a weak decision policy. Validate against holdouts and business outcomes, not accuracy alone, especially when churn classes are imbalanced.
Add exceptions deliberately
Pure profit ranking can misfire. A strategic account may justify intervention because of reference value, partner influence, or expansion access even when the immediate expected value is negative. Usage-based accounts also require an expansion lens, since saving the current footprint may matter less than preserving a credible path to future usage.
Run a weekly account review with a fixed capacity. Staff the top 20 expected-profit saves if that matches your team's available attention, route the next tier into automated nurture, and document why strategic exceptions displaced a higher-ranked account. The principle is not to automate judgment away. It's to stop spending scarce CSM time on risk scores that have no economic context.
Alerting, Routing and the Operational Workflow Layer
Detection without routing is a dashboard nobody checks. The operational layer must turn a signal into a task on the right owner's queue, with enough context to act and a service-level agreement that makes delay visible.
Use a small alert taxonomy at first:
- P1 billing failure: Send Stripe dunning webhooks and payment events to Revenue Operations for immediate review. The owner checks payment status, customer communication, and recovery eligibility.
- P2 usage collapse: Route a meaningful product-usage threshold breach to the assigned CSM. The task should include the changed workflow, affected users, and renewal timing.
- P3 sentiment movement: Batch support NLP shifts, NPS detractors, and survey changes into the weekly customer success review unless a strategic account requires faster handling.
- Champion departure: Send stakeholder-change alerts to the account owner with a request to confirm the new decision-maker and rebuild the value narrative.
Native product analytics plus a lightweight rules engine can support an early program. As routing complexity grows, platforms such as Vitally, Gainsight, and ChurnZero can centralize health data, playbooks, tasks, and escalations. The right choice depends on data quality and operating maturity. A platform won't fix missing account ownership or inconsistent event definitions.
Teams should also monitor product reliability because performance degradation can look like disengagement. A practical guide to monitoring SaaS app performance can help engineering and customer teams connect technical health with customer risk.
| Severity | Owner | Response time | Escalation path |
|---|---|---|---|
| P1 payment or access failure | Revenue Operations | Immediate review | Billing lead, then account owner |
| P2 usage or adoption collapse | Assigned CSM | Same business day | CS lead, then product specialist |
| P3 sentiment or recurring issue | Customer Success review owner | Weekly review | CSM and product operations |
| Strategic exception | Executive sponsor | Based on account plan | Revenue and product leadership |
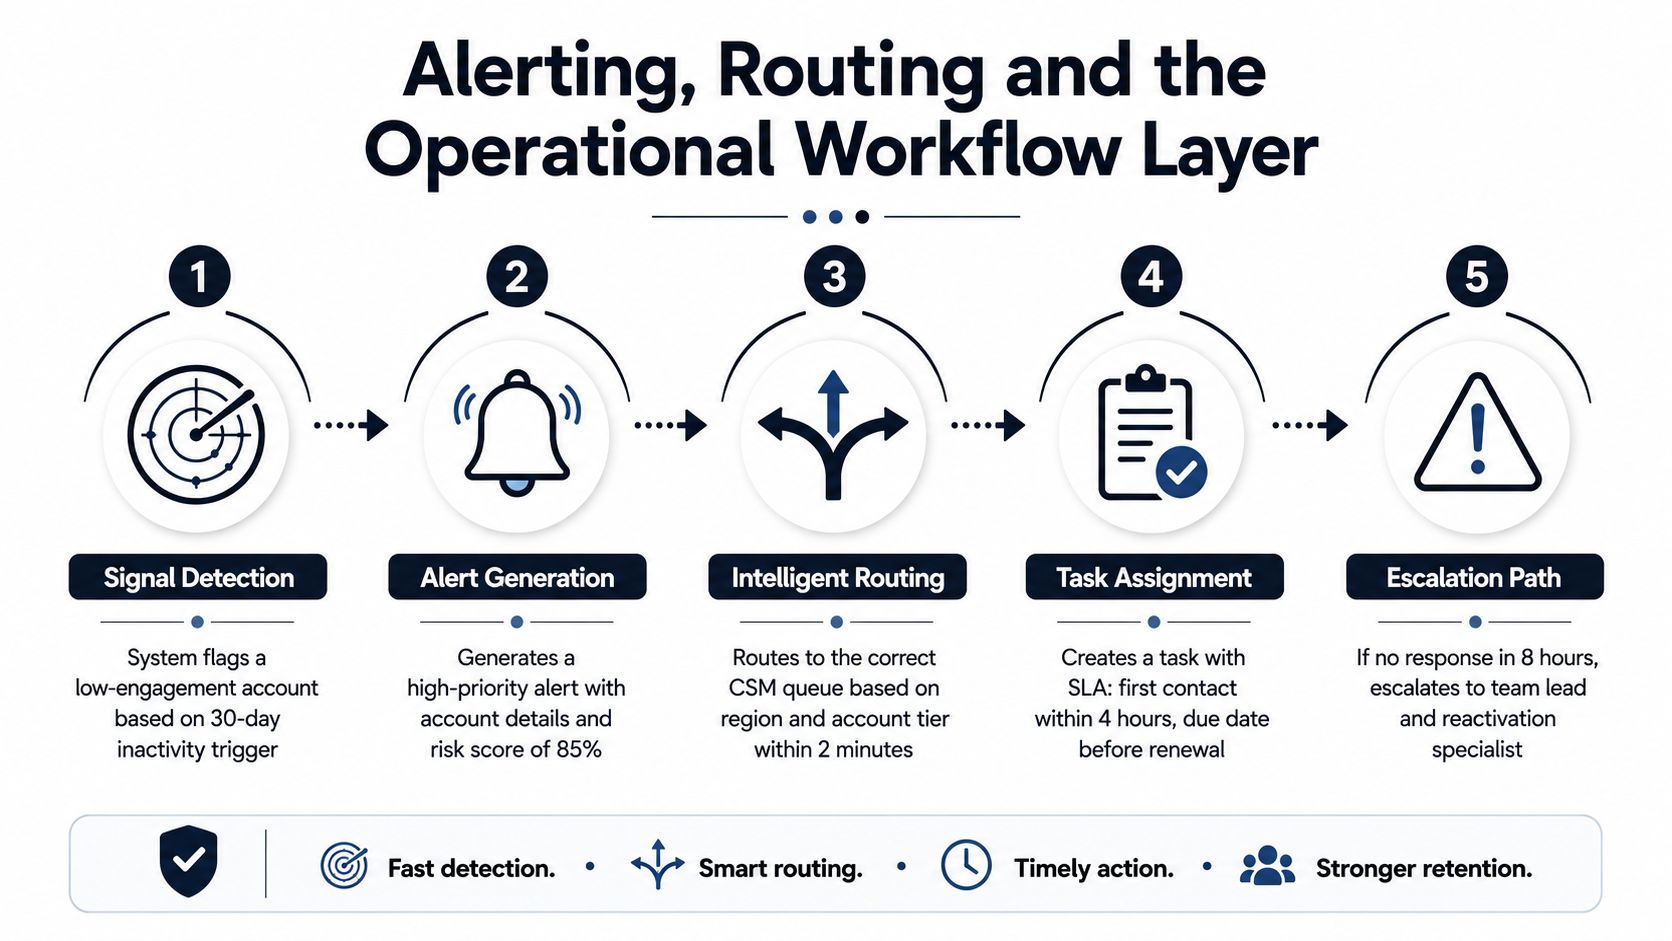
Every alert should carry the handoff contract: who the champion is, what changed, when it changed, why the account matters, and which play is recommended. A CSM shouldn't have to open five tools before making the first contact.
The following video can provide additional workflow context:
Designing and Prioritizing Retention Experiments
Retention experiments need a decision system, not a queue of disconnected ideas. Build a portfolio and rank each proposal by exposed revenue, diagnostic confidence, implementation effort, and the team's ability to act on the result. Prediction identifies risk. The experiment determines who receives which intervention, when, and under what conditions the team will stop or expand it.
Experiment A focuses on activation
Hypothesis: New accounts that fail to reach the activation milestone are more likely to churn early, so a guided onboarding path should improve activation by the pre-registered threshold.
Keep the control group on the existing onboarding experience. Give the treatment group a revised checklist, milestone prompts, role-specific guidance, and a human escalation path for stalled accounts. Set activation completion at day 14 as the primary metric. Track core-workflow usage, support friction, time to first value, and early retention as secondary measures.
Assign an ICE score of 8 when the affected cohort has meaningful revenue exposure, behavioral evidence supports the diagnosis, and the product changes are manageable. Estimate annual revenue saved from the exposed cohort's baseline ARR and expected incremental retention. A company-wide churn assumption will make the forecast look precise while hiding the actual decision basis.
Experiment B targets payment friction
Hypothesis: A clearer billing-retry cadence and payment-update experience will reduce involuntary churn by the pre-registered threshold without increasing complaints or refund requests.
Change retry timing, message clarity, payment-update prompts, and owner escalation for the treatment group. Leave the control group on the current dunning sequence. Measure involuntary churn reduction as the primary outcome. Recovered accounts, successful payment completion, support contacts, and customer sentiment provide guardrails and diagnostic detail.
This experiment receives an ICE score of 9 because engineering effort is low and the treatment can reach a broad billing population. Industry benchmarks, including the proactive outreach, structured onboarding, and payment-recovery patterns noted earlier, can help set an initial priority. They cannot replace controlled measurement of your own customers.
| Experiment | Cohort | Impact (1-10) | Confidence (1-10) | Ease (1-10) | ICE score | Projected ARR saved |
|---|---|---|---|---|---|---|
| Onboarding overhaul | First-lifecycle accounts | 8 | 7 | 9 | 8 | Estimate from exposed cohort baseline |
| Billing-retry cadence | Self-serve accounts with payment risk | 9 | 8 | 10 | 9 | Estimate from involuntary churn baseline |
Use the standard ICE formula, impact multiplied by confidence multiplied by ease, and score each input consistently across proposals. Weight impact by the cohort's dollar value, not only its account count.
Before launch, document the sample-size requirement, analysis window, falsifiable threshold, target audience, message, owner, and kill criteria. The operating question is whether the treatment changes retention for the accounts that received it, without creating avoidable support or refund costs. Do not expand because an early result looks promising. Roll out a winning treatment only after the pre-registered window closes. Remove a losing treatment cleanly within two weeks of a confirmed decision, then record what the result changes in the next experiment.
Measuring Retention Lift and Proving ROI to Leadership
Leadership rarely needs another chart showing that churn moved from one percentage point to another. Executives need to know how much ARR the program protected, how confident the team is in that estimate, and whether the work costs less than the revenue it saves.
Start with a holdout group whenever the intervention can be randomized. Eligible accounts are assigned to treatment or control, and both groups are measured over the same pre-registered window. If randomization isn't possible, use a matched-cohort design based on starting ARR, lifecycle stage, plan, prior usage, support history, renewal timing, and other variables that influence churn.
A basic retention-lift calculation is:
Retention lift = treatment retention rate minus control retention rate
Translate that lift into dollars using the eligible cohort's starting recurring revenue. Then adjust the interpretation for expansion, contraction, pricing changes, seasonality, new product releases, and accounts that entered or exited the cohort during the measurement period. The dollar figure should state what was observed, what was estimated, and what remains uncertain.
Build the monthly review around evidence
A strong monthly retention review fits on one page:
- Headline dollar result: ARR saved or protected, with the measurement method.
- Top three contributing motions: For example, onboarding, billing recovery, or targeted success outreach.
- Top three leaked cohorts: The segments where retention remains below baseline.
- Confidence interval: The plausible range around the estimated lift.
- Program economics: Intervention cost, ARR protected, and payback period.
- Decision list: Scale, revise, pause, or kill each active play.
Avoid the credibility killers that make leadership distrust the whole program. Cherry-picked test windows can hide seasonality. Survivorship bias can make net retention look healthy when expansion among remaining accounts masks logo losses. CSM attribution can overstate impact when a customer would have renewed because of product value regardless of the outreach.
The question isn't “Did the team contact the account?” It's “Did the intervention change the renewal outcome compared with what likely would have happened without it?”
The financial framing is straightforward:
Net program value = ARR protected minus program cost
Program cost includes staff time, incentives, engineering work, tooling, and specialist involvement. Payback period tells leadership how quickly the protected revenue covers that investment. Reduced logo churn also preserves future expansion opportunities, but report that separately unless the analysis can support the connection.
Use a 30-60-90 day ramp
A small SaaS team doesn't need a full data science department to begin.
Days 1 to 30: Lock the metric definitions, establish the cohort view, and instrument behavioral, support, billing, and feedback sources already available in your stack. Create a churn-reason taxonomy and make account ownership explicit.
Days 31 to 60: Ship the first two automated alerts with named owners and response expectations. Launch one narrow retention experiment and establish the ROI baseline before the first result arrives. The model design should preserve a clean reference window and a future prediction window, as recommended in guidance on predictive churn analytics.
Days 61 to 90: Add profit-aware scoring, run the leadership review using the template below, and sunset any play that didn't move ARR saved. Research on churn modeling warns that model timing, labeling, and class imbalance can produce impressive offline scores without operational retention lift, so connect every score to a staffed decision.
| Metric | Definition | Source | Reporting cadence |
|---|---|---|---|
| ARR protected | Revenue retained above the control or matched baseline | Billing and experiment data | Monthly |
| Retention lift | Treatment outcome minus control outcome | Experiment warehouse | Per experiment |
| Red accounts touched | At-risk accounts receiving a logged intervention | CRM or customer success platform | Weekly |
| Save cost | Staff, incentive, tooling, and engineering cost | Finance and activity data | Monthly |
| Payback period | Time required for protected ARR to cover program cost | Finance model | Monthly |
| Leaked cohorts | Segments below the approved retention baseline | Cohort analysis | Monthly |
Run a weekly scorecard with red accounts touched, experiments shipped, ARR saved, and program cost. Assign one named owner to the program, schedule a standing review, and maintain a kill list for zombie plays that remain active because nobody wants to make the call. Customer churn prevention compounds only when the team keeps measuring outcomes, not activity.
SigOS helps teams connect support tickets, chat transcripts, sales calls, and usage metrics to patterns associated with churn and expansion, then prioritize issues with revenue impact scores for operational follow-up. Visit SigOS to see how its product intelligence workflow can support earlier signals, profit-aware retention decisions, and a clearer link between customer feedback and ARR protected.
Keep Reading
More insights from our blog



Ready to find your hidden revenue leaks?
Start analyzing your customer feedback and discover insights that drive revenue.
Start Free Trial →