Win Loss Analysis Playbook for SaaS Revenue Growth
Run a winning win loss analysis program in SaaS. Learn KPIs, sampling, interview design, synthesis templates, and how to tie findings to revenue outcomes.
You know the situation. The dashboard says one thing, the rep debrief says another, and the CFO still wants a clean answer on why a healthy pipeline keeps turning into messy quarter-end explanations. That's usually the moment win loss analysis stops being a buzzword and starts looking like the only disciplined way to tell whether you've got a pricing issue, a positioning problem, a product gap, or just a sales process that's been guessing too long.
The teams that treat it like a one-off retro usually get a stack of notes and no behavior change. The teams that treat it as a decision system use it to shape pricing reviews, product roadmaps, customer success plays, and competitive strategy. That's the value of structured buyer feedback after a sales decision, the original Gartner framing behind win-loss work, and it's why the method matters most when you apply it consistently across enough opportunities to separate signal from noise, not when you gather a few colorful anecdotes and call it research (Clozd's win-loss analysis guide).
Why Win Loss Analysis Is the Most Underused Revenue Lever in SaaS
A CRO usually feels this before they can prove it. A big deal slips, the rep says timing, the manager says price, product hears “feature gap,” and the buyer never gets quoted because nobody asked the right questions soon enough. That's how teams end up running revenue motions on memory instead of evidence.
What makes win loss analysis powerful isn't the label, it's the discipline. It compares won and lost deals, then segments by variables like region, industry, product, segment, rep, and competitor to reveal where performance differs. That's the difference between knowing that deals are slipping and knowing where they're slipping, which is the only place a revenue team can intervene with confidence (Clozd's win-loss analysis guide).
Why the CRM alone won't save you
CRM data is useful, but it's still seller-shaped unless you pressure-test it against buyer feedback. In practice, that means the same loss can be described three different ways depending on whether you ask the AE, the manager, or the buyer. The buyer is the one who decides, so the program has to be built around what buyers said after the decision, not what the internal team inferred from the outcome.
Practical rule: if the explanation only lives in a rep note, treat it as a hypothesis, not a finding.
The cost of ignoring this is cross-functional drift. Sales keeps coaching the wrong behavior, product keeps chasing the wrong request, customer success inherits a story that was never validated, and competitive intelligence keeps recycling stale assumptions. A mature program turns those separate interpretations into one evidence base that can move the roadmap and the messaging.
Defining Goals and KPIs That Hold Up to Board Scrutiny
A win-loss program loses credibility fast when it measures activity instead of business impact. If leadership only hears how many interviews were completed, the work gets parked with other research that sounds useful but never changes a decision. The better move is to anchor the program to one primary KPI, then build the rest of the dashboard around the revenue motion you want to improve.
The primary metric for your team is win rate, calculated as (Won Deals ÷ Total Opportunities) × 100. The formula is simple. The value comes from slicing it by region, industry, deal size, segment, competitor, and product line so you can see where performance changes most. Once you stop staring at the full book of business and start examining named segments, the program becomes something leaders can use.
Build the KPI sheet before the interviews start
A KPI sheet should fit on one page and answer three questions. What are we trying to improve, how will we segment performance, and what change would count as success in a QBR? If those answers are fuzzy, the analysis turns into a slide deck that gets ignored.
A practical stack usually includes one primary metric and a few secondary signals. Deal velocity, competitive displacement rate, no-decision rate, and recurrence of loss reasons all help explain whether the problem sits in the funnel, the field, or market response. Track only what you can act on. Teams that measure everything end up with dashboards that look busy and tell them very little.
For the KPI sheet, it helps to define:
- Primary outcome: the revenue metric the program is meant to improve.
- Segment cuts: the slices that matter most, such as vertical or competitor.
- Decision use: the meeting where the data will be reviewed, such as a QBR or pricing council.
- Owner: the person accountable for turning findings into action.
If you want a template that is easy to adapt, start with a key performance indicator report template like the one SigOS publishes for reporting structure. It keeps the output board-ready without burying the signal, and it forces the team to connect findings to revenue impact instead of leaving them as commentary. See the SigOS KPI report template.
Don't confuse research volume with executive relevance
A clean KPI sheet also protects you from a familiar failure mode, over-measuring the program itself. Leaders do not care how many calls were heard if the answer never reaches pricing, product, or enablement. They care whether the analysis changed the conversation about revenue quality.
Board-ready test: if you cannot connect the metric to pipeline conversion, pricing decisions, or roadmap prioritization, it belongs in a footnote, not the main dashboard.
Designing a Sampling Strategy That Survives the Statistical Reality Check
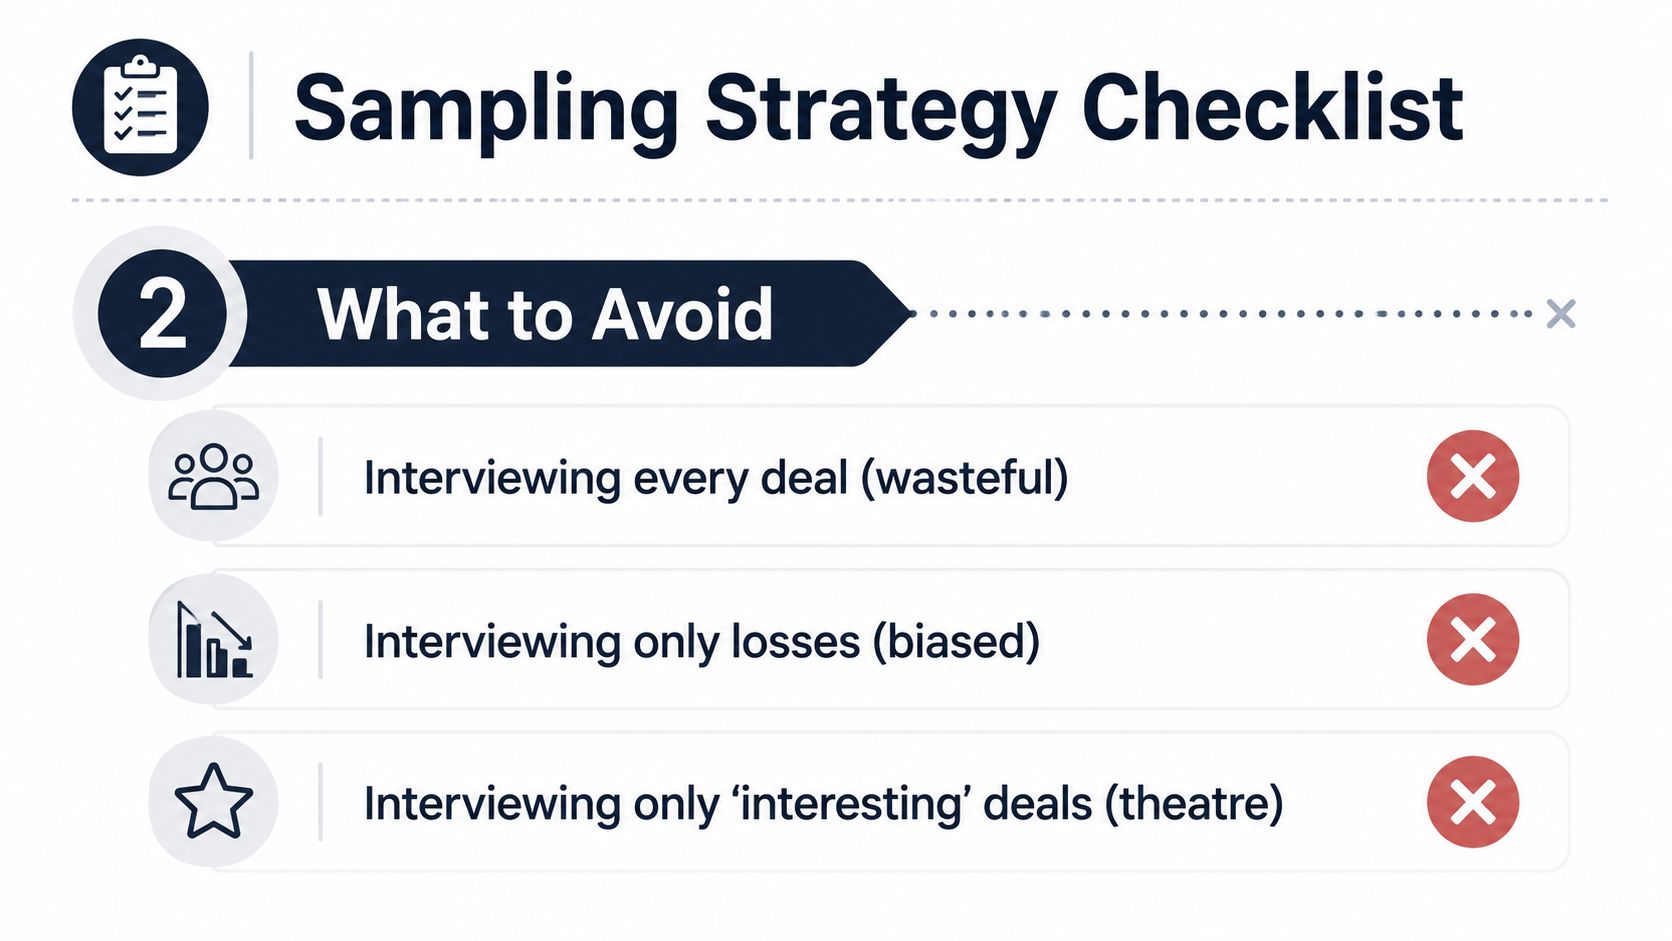
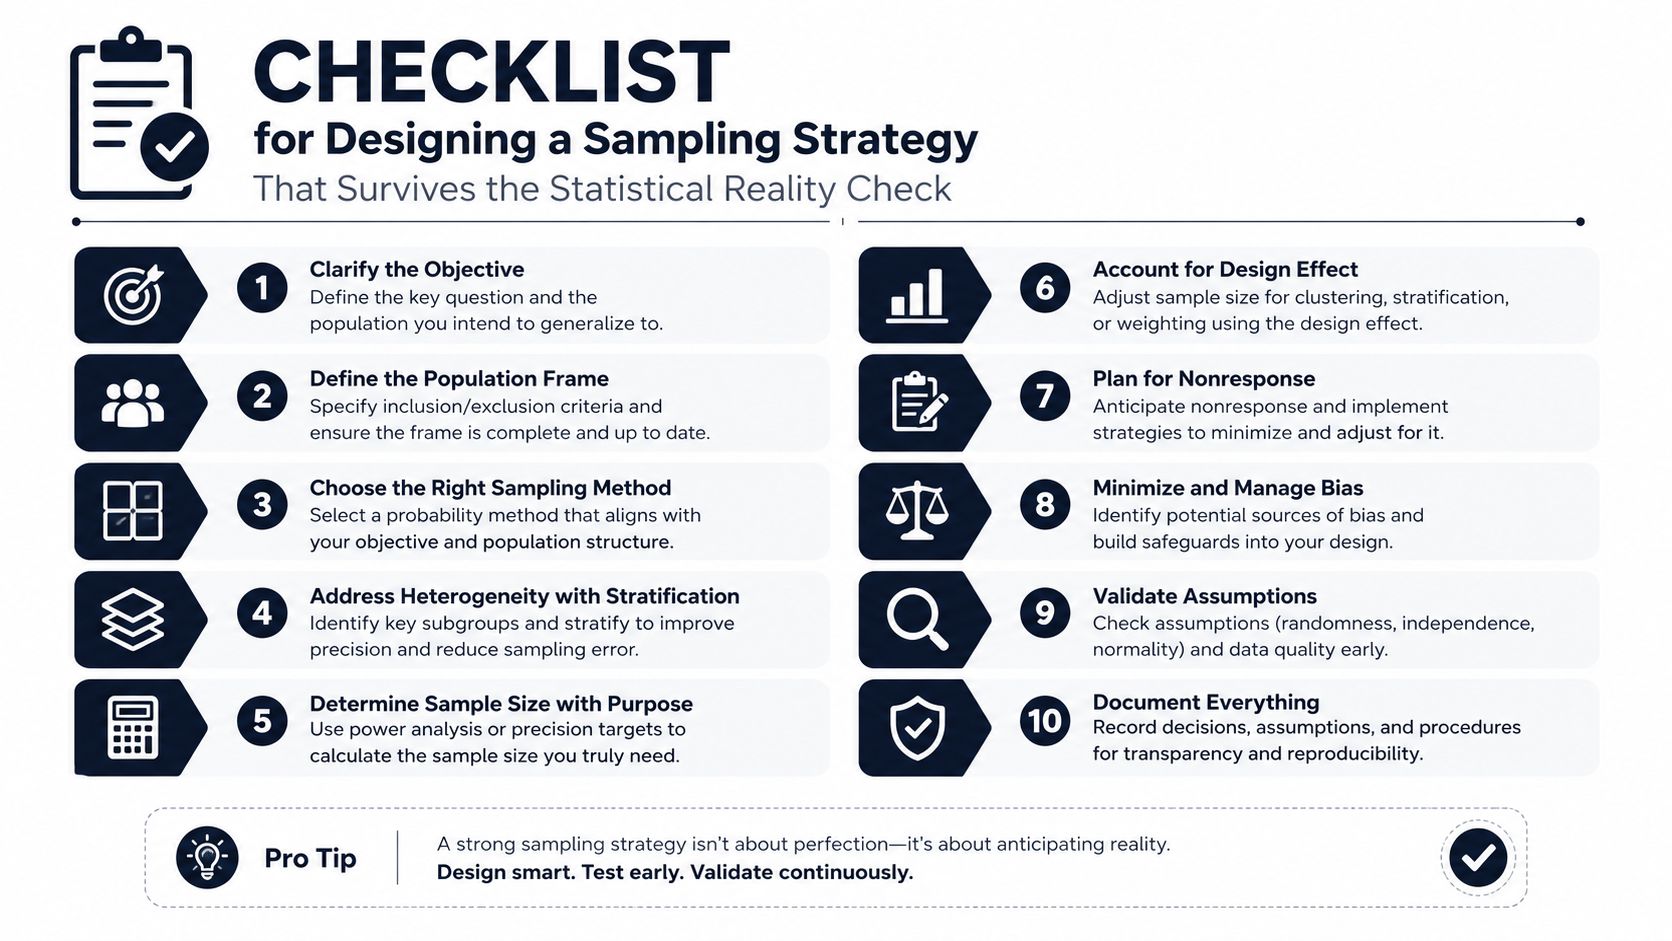
Sampling is where most programs get distorted. Interviewing every deal is wasteful, interviewing only losses is biased, and interviewing only the deals that look interesting turns the program into theatre. The goal is not to collect the most stories, it's to collect enough of the right deals to see patterns that hold up when leadership challenges them.
A solid baseline is at least 20 interviews, and one industry guide recommends 15 to 20 interviews per segment per quarter when you want meaningful confidence (Elevated Signal's win-loss analysis guidance). That doesn't mean every segment needs the same number of interviews, but it does mean small samples should be treated as directional, not definitive.
Use a stratified mix, not a random pile
The best programs balance wins, losses, and competitive deals instead of over-indexing on one outcome. That keeps the sample honest and makes it easier to see whether a theme shows up across outcomes or only in a specific part of the funnel. When the mix is too lopsided, every insight gets warped by outcome bias.
In practice, I'd rather see a smaller but balanced sample than a larger one that overweights “easy to reach” deals. Reps also tend to self-select which buyers to ask, which introduces another layer of bias, so the sample owner should refresh the list on a fixed cadence and not let the field curate the evidence. If the account team gets to choose the buyers, the findings will mirror the story they already believe.
Weight the sample where revenue is concentrated
Not every deal deserves equal attention. Large deals, strategic segments, and named competitor losses usually deserve more weight because they're closer to the revenue questions leadership cares about. That said, the program still needs enough breadth to avoid building a strategy around one dramatic account.
A practical sampling matrix usually includes:
- Outcome mix: wins, losses, and no-decision deals.
- Strategic weight: large deals and named verticals.
- Competitive weight: losses to specific competitors.
- Ownership rule: who selects, who refreshes, and who approves the final sample.
Document the logic every time. If someone challenges a finding later, you want to be able to show why that deal set was selected and why it wasn't just a pile of anecdotes from the loudest rep in the room. A defensible sample isn't glamorous, but it's what keeps the analysis credible.
Building an Interview Guide That Surfaces What Buyers Actually Say
The interview is where trust is won or lost. If the questions sound like a sales debrief, buyers answer politely and you learn nothing useful. If the questions are structured around their decision process, you get context, trade-offs, and the actual reason behind answers that would otherwise stop at “price was too high.”
A 20 to 30 minute guide works best when it's split into four blocks, context and decision process, evaluation criteria, vendor comparison, and future intent. That structure keeps the conversation focused without forcing the buyer through a script that feels like a survey in disguise. A practical template you can adapt is the kind of customer research framework SigOS publishes for interview planning, because the biggest difference between useful and useless interviews is usually the quality of the prompts, not the courtesy of the follow-up note (SigOS customer research template).
Ask in layers, not in labels
Start with what happened, then ask why it mattered, then ask what almost changed the outcome. That sequence gets you past the surface reason and into the actual decision driver. A buyer who says the price was too high may really be saying the procurement process was too slow, the implementation felt risky, or the ROI case never landed.
A strong guide usually includes questions like:
- Decision path: how the buyer narrowed the field and who influenced the shortlist.
- Evaluation criteria: what they compared, and what mattered most.
- Vendor comparison: what differentiated the final contenders.
- Future intent: what would have needed to change for the outcome to differ.
Practical rule: avoid “why didn't you choose us?” as the first move. Buyers answer that question with polite abstractions, not useful detail.
Don't skip stalled and no-decision deals
Many teams interview only outright losses, then wonder why the revenue leak still feels bigger than the findings. That's a mistake. No-decision outcomes belong in the dataset, and one recent guide notes they can account for up to 60% of pipeline (Corporate Visions implementation guide).
That matters because a stalled deal often contains the best diagnostic evidence. The buyer may have liked the product, but the internal decision process never resolved, the urgency disappeared, or implementation risk never got comfortable. If you only study competitor losses, you miss the larger pattern of hidden losses that never turn into a clear closed-lost record.
Synthesizing Qualitative Themes and Quantitative Signals into Actionable Findings
Raw interviews are not the deliverable. CRM exports, call notes, and transcript snippets are not the deliverable either. The deliverable is a synthesis that shows which themes recur, where they appear, and what they mean for revenue decisions. If product, CS, and pricing cannot act on it, the analysis is not finished yet.
The operating loop is straightforward. Scope the deals, collect buyer feedback, analyze patterns and common themes, then implement changes and track outcomes. Practitioner guidance recommends running buyer interviews within 30 days of deal closure because the signal weakens when action gets delayed (YouTube practitioner guidance on win-loss workflows). That timing is not cosmetic, it is how you keep the buyer's memory close to the decision.
Merge the evidence before you rank it
The strongest synthesis teams pull CRM fields, transcripts, support tickets, and interview notes into one tagged dataset. That lets you cross-check what reps said, what buyers said, and what appeared in the deal history. When a theme shows up in all three places, you have evidence that is harder to dismiss than a loose pattern.
The same discipline applies to attribution. A practical guide to causal inference helps teams avoid over-claiming from correlation, especially when a theme appears in only part of the sample and the path to the outcome is still murky. In win-loss work, that matters because polished storytelling can make thin evidence sound decisive.
Synthesis Matrix for Win-Loss Findings
| Theme | Frequency | Deal Size Impact | Recommended Owner | Revenue Estimate |
|---|---|---|---|---|
| Pricing friction | Recurring in late-stage losses | High | Pricing | Tie to deal-level pricing review |
| Integration concern | Repeated in technical evaluations | Medium to high | Product | Tie to roadmap and implementation messaging |
| Slow internal process | Common in stalled deals | Medium | Sales leadership | Tie to stage hygiene and mutual action plans |
| Competitor displacement | Concentrated in named competitor losses | High | Competitive intelligence | Tie to battlecards and objection handling |
Rank by recurrence and revenue weight
Do not let the loudest rep set the priority. Rank the themes by how often they recur and how much revenue they touch. A niche issue that appears in small deals should not outrank a pattern that keeps surfacing in strategic segments.
Useful filter: ask whether a theme changes a roadmap decision, a pricing decision, or a sales motion decision. If it does not change one of those, it probably is not a top-tier finding.
A single clean synthesis report should tell each function what to do next, not just what happened. That is the difference between research and operating intelligence.
Use the output to build a clear reporting artifact, not a loose summary. A sample data analysis report template helps teams structure findings so the signal, the source evidence, and the business implication stay together instead of drifting into slideware.
Operationalizing Findings Across Product, CS, Pricing, and Revenue Teams
Most win-loss decks die because they stop at “share findings.” Real operating value shows up when those findings land inside the systems teams already use. Product needs them in roadmap review, CS needs them in QBRs, pricing needs them in committee discussions, and revenue leaders need them in enablement and forecasting conversations.
The cleanest model is to turn each finding into a workflow item with an owner, a revenue impact score, and a clear destination. That could mean a Jira or Linear ticket for product, a CS play for onboarding or renewal risk, a pricing review note, or a new objection-handling asset for the field. If the issue is being tracked but nothing changes in the week-to-week operating rhythm, the program is still slideware.
Route each theme into the cadence that can act on it
Product managers don't need a full interview transcript. They need the recurring theme, the deal context, and a clear sense of how often it appears in the right segments. CS leaders don't need every quote either, they need the customer behavior pattern that predicts churn or expansion risk so they can adapt plays before renewal pressure hits.
A modern product intelligence layer can help because it ingests support tickets, chat transcripts, sales calls, and usage signals, then tags the patterns that correlate with churn, expansion, and revenue impact. That's the operational advantage, the program stops depending on quarterly recall and starts behaving like a continuous signal system. Prioritized issues can then be pushed into workflow tools like Jira or Linear with the revenue context attached, instead of sitting in a deck until the next planning meeting.
Give pricing and enablement a different output
Pricing reviews need a different lens than roadmap planning. If buyers are consistently reacting to packaging or perceived value, the pricing committee needs the pattern, the affected segment, and the deal size context. Sales enablement, by contrast, needs to know which claims are breaking down in live deals so it can update talk tracks, proof points, and competitive guidance.
That's why one static report is the wrong artifact. A pricing team should get a decision memo, not a transcript dump. A CS team should get a playbook trigger, not a generic summary.
Tie every action to revenue impact
If a finding doesn't connect to revenue, the prioritization discussion gets vague fast. The best teams translate each issue into a plain-language business effect, lost deal velocity, weaker expansion, or higher churn risk. That's also where AI-driven product intelligence tools become useful, because they can keep surfacing the same patterns between formal interview cycles instead of waiting for the next quarterly project.
Avoiding Common Failure Modes and Building a 90-Day Operating Cadence
Three failure modes kill most programs. The first is biased questioning, which gives you the answer you expected. The second is anecdote overload, which makes the deck sound rich and the decision path feel muddy. The third is the missing closed loop, where findings never change win rate, deal size, or revenue behavior.
A lot of teams think the fix is more interviews. It usually isn't. The fix is a tighter cadence, clearer ownership, and a workflow that forces the findings into action before they go stale. If you need help staffing the outreach and interview motion, a resource like Hire SDRs can be useful when the problem is bandwidth, not framework.
Days 1 to 30 set the structure
Use the first month to lock the scope, select the sample, and define the baseline KPI view. The owner confirms which segments matter, which deals are in, and how the sample will be refreshed. If the sampling logic is sloppy here, every later insight gets harder to defend.
By the end of this window, the team should have a sample list, an interview guide, a tagging taxonomy, and a review cadence. That gives the work enough structure to move without turning every deal into a debate.
Days 31 to 60 turn interviews into themes
This middle window is where the interviews happen, the notes get coded, and the patterns start to emerge. The output shouldn't be a giant raw-notes folder, it should be a working synthesis with themes ranked by recurrence and revenue impact. If a theme isn't strong enough to route to an owner, it's probably not ready for action.
Days 61 to 90 force the first measurable change
The final window should produce an exec readout, route the findings into the right workflow, and create one visible change in process, messaging, product review, or pricing discussion. That first change matters because it proves the program isn't just a research exercise. If it's useful, the field will feel it.
A continuous intelligence layer helps keep the cadence alive between formal cycles, especially when support, sales, and product signals keep changing. The point isn't perfect coverage. The point is a system that keeps learning after the initial report has been sent.
If you want a win-loss program that doesn't die in slides, use SigOS to connect buyer feedback, support signals, sales calls, and usage patterns into one revenue-aware system. Visit SigOS to see how continuous product intelligence can turn win-loss themes into prioritized actions for product, CS, and growth teams.
Keep Reading
More insights from our blog



Ready to find your hidden revenue leaks?
Start analyzing your customer feedback and discover insights that drive revenue.
Start Free Trial →