What Is Signal to Noise Ratio and Why It Matters
Learn what is signal to noise ratio, how to measure it, and how SaaS teams improve SNR to turn scattered customer feedback into churn-saving product decisions.
Signal to noise ratio compares how much useful information is present in a dataset versus how much irrelevant or random data surrounds it, and a higher ratio means the meaningful insights stand out clearly. In practice, that's the difference between a dashboard that helps you decide and a dashboard that just keeps you busy.
You've probably felt this in a planning meeting, a support review, or a product retro. The room is full of feedback, but only a small part of it changes the next decision.
The Plain-English Meaning of Signal to Noise Ratio
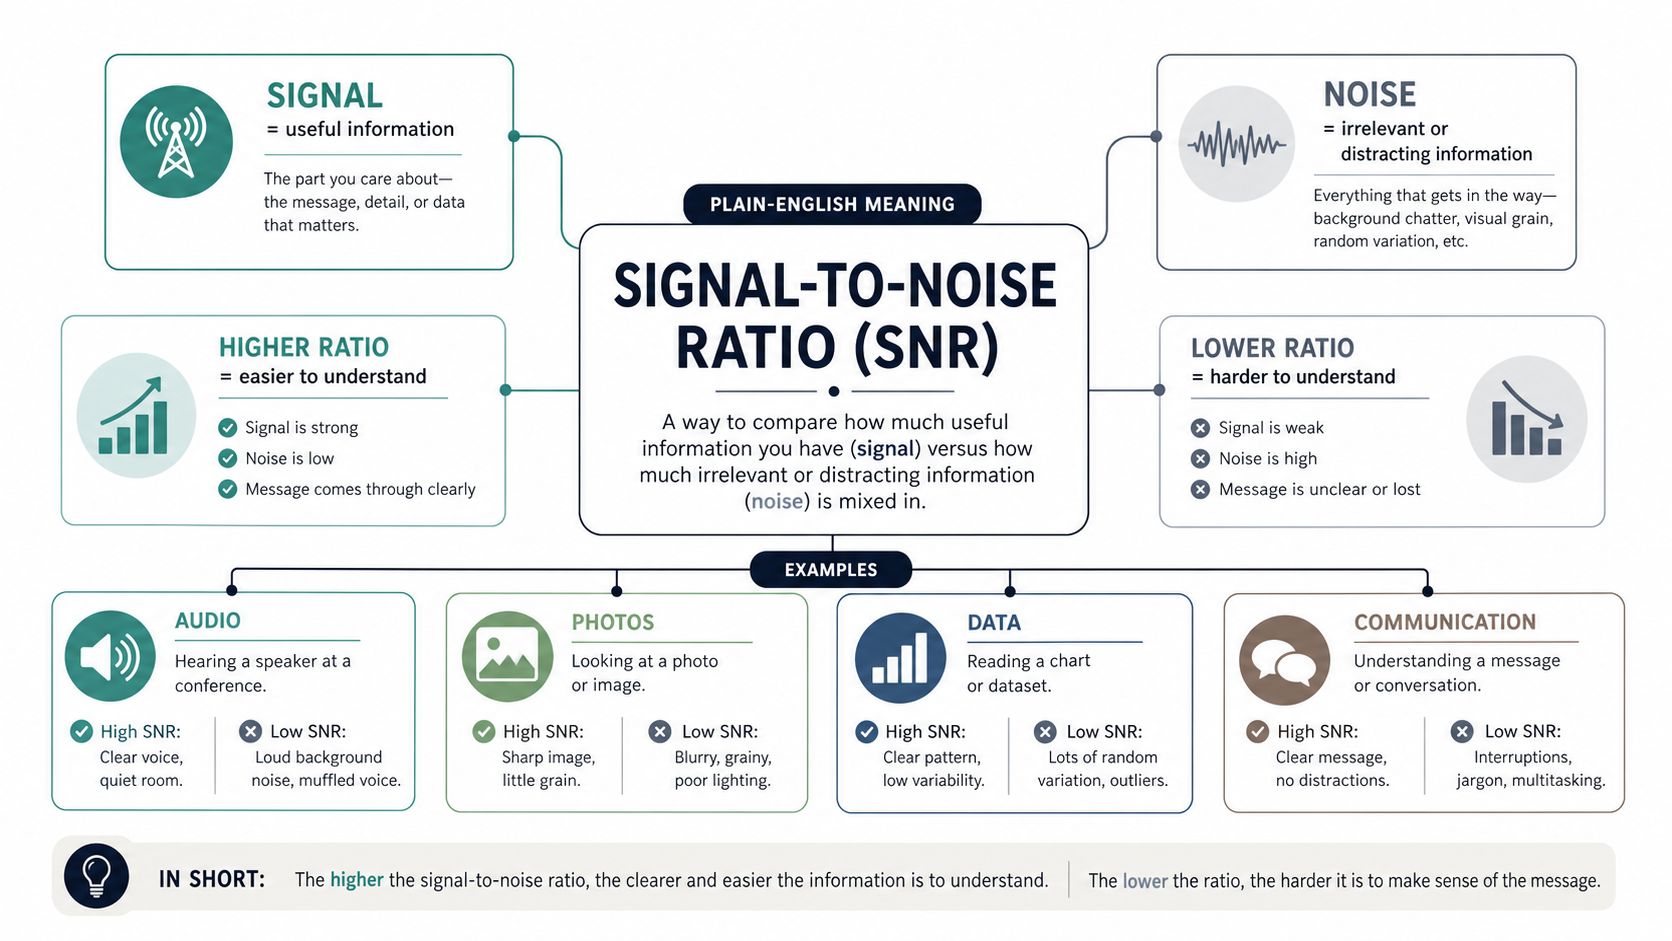
A product manager staring at hundreds of tickets, interview notes, and Slack threads doesn't need more raw input. They need to know which comments carry signal, the parts that point to a real pattern, and which ones are noise, the clutter that makes the pattern harder to see.
That's the plain-English meaning of signal to noise ratio. It asks a simple question, how much of what you're looking at is useful information, and how much is just background chatter?
Start with the thing you care about
If you're leading product work, the signal might be recurring friction from enterprise customers, repeated churn reasons, or a feature request that shows up across multiple accounts. Noise is the one-off complaint, the duplicate thread, the vague opinion with no context.
That framing matters because people often treat SNR like a fancy technical term. It's really a judgment call about clarity.
Practical rule: if a dashboard or feedback stream makes it harder to see the decision, its SNR is too low for the job you're trying to do.
Why the term matters even when the formula doesn't
SNR isn't just about electrical systems or image quality. The same idea works anywhere you're trying to separate useful patterns from clutter, including SaaS feedback pipelines, customer support triage, and revenue analysis.
The key is that SNR is relative, not absolute. You're not asking whether something is noisy in the abstract. You're asking whether the thing you care about is loud enough to stand out from everything else around it.
That's why teams can look at the same pile of feedback and draw different conclusions. One person sees a clear product problem. Another sees a wall of anecdotes.
A useful way to explain what is signal to noise ratio to a teammate is this, it's a measure of whether the important thing rises above the irrelevant thing. If it does, you can trust the pattern more. If it doesn't, you're still in sorting mode.
The Math and Units Behind SNR
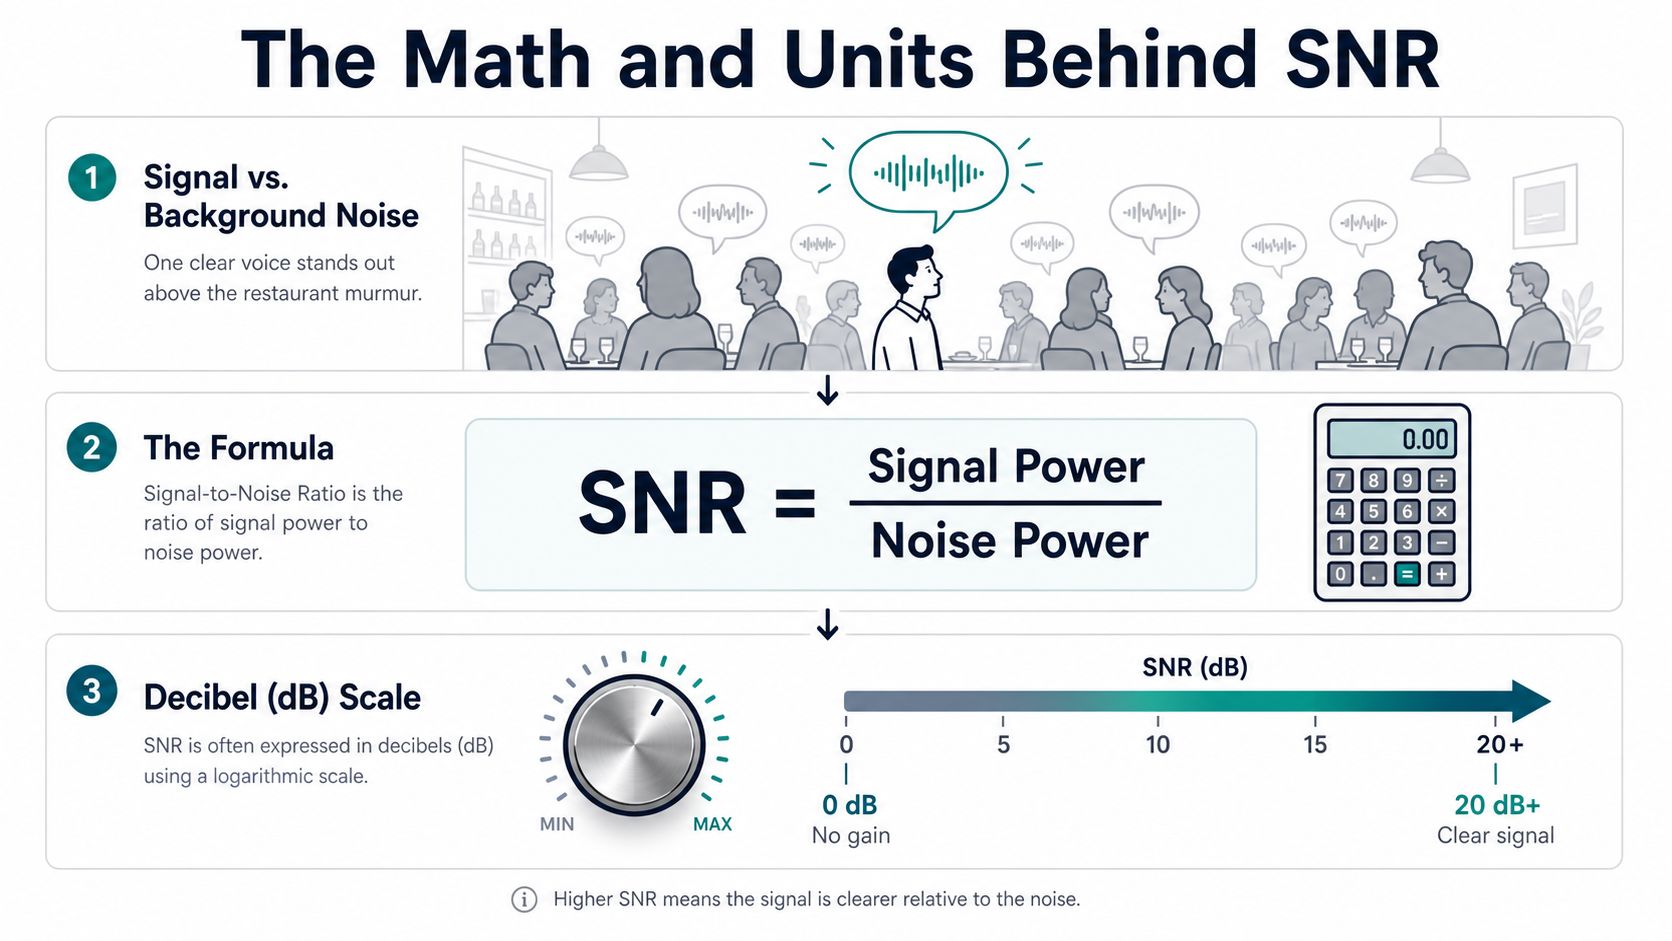
The formal version is simple enough to say out loud, even if the units underneath get a little technical. SNR equals signal divided by noise, which means you're comparing the strength of what you want against the strength of what you don't.
Think of a conversation in a crowded restaurant. If one person's voice is easy to hear over the room, the SNR is high. If the same voice disappears into the hum of plates, music, and other conversations, the SNR is low.
Why people use decibels
In engineering, people often express SNR in decibels, because decibels make it easier to compare very large and very small values on the same scale. You don't need the algebra here to understand the point. A higher number means the useful part stands out more clearly.
That's why the same underlying idea can be described in two ways, as a raw ratio or as a decibel value. The ratio is the concept. The decibel is the measuring stick.
A simple way to think about it is this:
- High SNR: the useful signal is easy to distinguish.
- Low SNR: the useful signal is buried.
- Decibel scale: a shorthand for comparing how far apart those two things are.
The scale is not the story
Two dashboards can show different-looking numbers and still be describing the same reality. One team might say the signal is strong, another might say the noise is weak, and both can be talking about the same ratio from different angles.
That's why SNR is better treated as a comparison than as a standalone score. The number only makes sense relative to the way you measured it.
If you want a lighter technical walkthrough, the logic in this hypothesis testing guide pairs well with SNR thinking, because both are about separating a real pattern from everything that could mislead you.
What a product leader should remember
For non-engineering teams, the important takeaway is not the unit. It's the relationship.
A useful metric isn't the one with the most precision. It's the one whose measurement method you actually trust.
If you're working in SaaS, that matters because the same ticket volume, same call transcript, or same feedback stream can produce very different SNR readings depending on how you slice it. The math looks tidy. The measurement process is where the mess starts.
How SNR Is Measured Across Different Domains
SNR sounds like a single concept, but the measurement changes by context. In radio and imaging, technical sources often define it as signal power divided by noise power. In MRI guidance, the method can use a signal region of interest and a background region, with corrections for the background's distribution, which means the headline number can shift depending on the protocol used. That's why the same SNR label can mean different things in different domains, even before you interpret the result (Signal-to-noise ratio).
Different fields, different measurement habits
Electronics teams usually care about whether a clean signal survives the surrounding electrical noise. Imaging teams care about whether useful detail survives sensor and background interference. Product analytics teams care about whether the pattern in customer feedback still holds after you remove duplicates, outliers, and low-context comments.
Those are all SNR problems, but they're not measured the same way. The measurement method is part of the result.
That's why it helps to think in terms of protocol. A dashboard can report a “feedback SNR,” but if one team counts every Slack mention and another only counts tagged support tickets, they're not measuring the same thing. The label may match. The decision quality may not.
Product teams need a measurement definition too
If you build a feedback dashboard without defining what counts as signal, you'll get a number that looks objective and behaves inconsistently. One stakeholder will trust executive escalation requests. Another will trust account-level churn patterns. A third will trust only behavior-linked evidence.
A clean way to handle that is to define the measurement first and the metric second. In practice, that means deciding which sources matter, which noise sources to exclude, and how to handle mixed-quality data before anyone starts comparing results.
For teams mapping those systems, data architecture diagrams are useful because they force the measurement path into the open. Once the flow is visible, the hidden assumptions are easier to spot.
You can hear the same logic in audio workflows too. If you're cleaning up recordings, a guide like SnapDial echo removal tips is useful because echo is not just “bad sound,” it's a measurement and cleanup problem that changes what the listener can trust.
The real lesson
SNR is not just a formula, it's a measurement agreement. The ratio itself matters, but the protocol often changes the number more than the math does. That's the part product teams miss when they import technical terms into SaaS reporting without defining the inputs.
SNR in the Real World of SaaS Product Teams
Support leaders, product managers, and growth teams run into SNR problems every day, even if they don't call them that. The issue is rarely lack of data. It's that the loudest data wins too easily.
A support lead sees a flood of tickets and has to decide whether a complaint is a real churn risk or just a noisy edge case. If the same issue appears across multiple accounts with the same pattern, the signal is getting stronger. If it shows up once in a long thread and never again, it may be important, but it isn't yet a pattern.
A product manager gets feature requests from sales, customers, and internal teams. The request that sounds most urgent often isn't the one that matters most. Low SNR makes every opinion feel equally weighty, which is how roadmaps get crowded with local drama instead of durable customer need.
A growth team faces the opposite problem. They may have plenty of usage data, but not enough context to know which behavior predicts expansion and which is just habitual activity. When the signal is weak, dashboards become decoration.
What low SNR feels like in practice
Low SNR feels like constant re-litigation. People keep asking the same questions because the evidence isn't clean enough to settle them. Meetings stretch longer, because every comment feels like it could matter.
It also changes politics. The noisiest account becomes the most visible account. The most emotional request gets mistaken for the most important request.
What high SNR feels like
High SNR feels calmer. Trends repeat. Teams can point to a small set of patterns and make decisions faster. The conversation shifts from “what did everyone say?” to “what is happening?”
The best product discussions don't have more opinions. They have fewer misleading ones.
That's why SNR is a useful operating idea for SaaS teams. It doesn't replace judgment. It improves the conditions for judgment.
Practical Ways to Improve SNR in Product Intelligence Pipelines
Raising SNR in product intelligence is less about chasing a perfect formula and more about improving the path from raw input to trusted insight. The earliest gains usually come from filtering. Spam, duplicates, and low-context feedback create a lot of visual and emotional clutter, so getting them out of the stream first makes everything downstream easier to read.
After that, teams need to structure what remains. If support tickets, call notes, and in-app feedback all arrive as undifferentiated text, analysts end up doing manual interpretation work that should have happened at ingestion. Tags, categories, and source labels don't make the signal stronger on their own, but they make the signal easier to compare.
Combine similar evidence instead of reading every item as unique
A common failure mode is treating every comment as a new idea. In reality, many comments are echoes of the same underlying issue. Clustering similar tickets, grouping related requests, and collapsing repeated complaints into one theme can make the true pattern easier to see.
That matters because repetition is not the same as importance. Sometimes a theme repeats because it affects many accounts. Sometimes it repeats because a small group is very loud. Aggregation helps separate those cases.
Weight the signal by business impact
A feedback stream gets much more useful when teams stop treating all sources equally. Revenue-bearing accounts, churn-sensitive segments, and expansion-ready users usually deserve more attention than anonymous one-off responses. Weighting by impact doesn't silence smaller customers, it just prevents every voice from carrying the same decision weight.
The strongest teams connect feedback to behavior. They look at whether a complaint also appears in usage drops, renewal risk, or expansion opportunity. That connection turns narrative data into operational data.
For teams working on these workflows, data quality issues are often the hidden reason SNR stays low. If the source data is inconsistent, no amount of dashboard polish will make the insights trustworthy.
Close the loop with continuous analysis
The last step is not a cleanup task, it's a discipline. Teams need to keep checking whether the same categories still matter, whether the sources have drifted, and whether the weighting rules still match current business priorities. Without that loop, yesterday's signal becomes tomorrow's noise.
A good SNR pipeline doesn't just make reports prettier. It makes decisions faster because the underlying evidence is cleaner.
Common Pitfalls and Misconceptions About SNR
The biggest myth is that more data automatically means better signal. It doesn't. More data can just mean more clutter, especially when the sources are inconsistent or the categories are vague.
Another common mistake is believing that averaging everything together solves the problem. Averaging can smooth a dashboard, but it can also hide the exact behavior you needed to notice. If one segment is struggling while the average looks fine, the average has become noise.
Volume is not the same as importance
Teams also confuse loudness with value. A flood of comments can feel like urgency, but volume alone doesn't tell you whether the issue affects retention, revenue, or customer trust. The loudest thread in Slack is often the least representative one.
That's why a single SNR number can mislead leaders. A tidy score can hide messy choices about what got included, what got excluded, and how the data was grouped. If those choices are fuzzy, the number is decorative.
Watch the measurement cost: if it takes too much effort to maintain the ratio, the team may be optimizing the dashboard instead of the decision.
There's also a subtle trap in how people use SNR language. They assume a higher ratio is always better, no matter what it costs to achieve. But if you have to discard important context to make the metric look cleaner, the result may be less useful even though the number improved.
The healthiest approach is to ask whether the cleaned-up signal still captures the decision you care about. If it doesn't, you've reduced noise by removing meaning, and that's not progress.
A Short Checklist for Product and Support Leaders
Before your next planning meeting, define what signal means for your team this quarter. If you can't say what good evidence looks like, you'll keep arguing over anecdotes instead of decisions.
Audit your feedback sources and ask which ones add noise without adding context. Then decide which sources deserve more weight because they're tied to revenue, retention, or expansion.
Review your dashboard with one question in mind, does it help the team act faster, or does it just make the room feel informed? If the answer is unclear, the SNR probably needs work.
Treat SNR as a weekly operating habit, not a once-a-quarter cleanup job. The teams that do this well usually make better calls because they spend less time sorting through clutter.
If you want a product intelligence workflow that helps your team keep the signal visible and the noise under control, A CTA for SigOS.
Keep Reading
More insights from our blog


Ready to find your hidden revenue leaks?
Start analyzing your customer feedback and discover insights that drive revenue.
Start Free Trial →