Mastering a b n testing for Smarter Product Experiments
Learn how to run effective a b n testing to validate product changes. This guide covers setup, statistical significance, pitfalls, and revenue impact.

Most product teams don’t have an experimentation problem. They have a decision problem.
A designer wants to simplify onboarding. Sales wants the pricing page to push annual plans harder. Support keeps surfacing the same complaint from trial users. Engineering has a cleaner backend approach that could make the product feel faster, but nobody wants to risk rollout without evidence. If you’re leading product, you’ve probably sat in that meeting where every idea sounds plausible and none of them has enough proof to win.
That’s where a b n testing becomes useful. Not as a buzzword, and not as a ritual where teams launch random variants and celebrate whichever chart turns green first. It gives you a disciplined way to compare more than one challenger at once, cut through opinion, and decide which change deserves rollout.
That matters because experimentation is no longer niche. Approximately 77% of firms globally conduct A/B testing on their websites, and the market is projected to reach up to $1.08 billion in revenue by 2025 according to VWO’s A/B testing statistics roundup. Teams aren’t adopting testing because it sounds modern. They’re adopting it because shipping without evidence is expensive.
The mistake is stopping at “Variant C won.”
A winning variant only matters if it changes a business outcome you care about. Better onboarding should improve activation quality, not just increase clicks on the next button. A better pricing page should shape revenue, not just inflate shallow engagement. A backend algorithm change should improve customer experience in a way the business can prioritize and defend.
Introduction Beyond the Coin Flip
A basic A/B test feels tidy. You have control and one challenger. Either the new thing wins or it doesn’t. That model works when the decision is binary.
Most product work isn’t binary.
You’re rarely choosing between just two ideas. You’re choosing between several messages, several layouts, several onboarding sequences, or several ways to frame value for different customer segments. In SaaS, the backlog is full of plausible improvements. The hard part isn’t generating ideas. It’s deciding which ideas are worth exposing to customers and which results deserve roadmap priority.
Where product teams usually get stuck
The common failure mode looks like this:
- Too many opinions: Marketing wants stronger copy, product wants less friction, and support wants better explanation.
- Too little precision: The team knows a funnel step underperforms, but not which change is most likely to fix it.
- Too much urgency: Leadership wants an answer fast, so someone picks the safest-looking option and calls it strategy.
That’s how teams ship cosmetic changes while larger revenue problems stay untouched.
Practical rule: If the team is debating three or four credible ways to solve one customer problem, a b n testing is usually the right frame.
A b n testing gives you one control and multiple challengers in the same experiment. Instead of asking, “Is this new idea better than what we have?” you ask, “Which of these realistic options earns the right to scale?”
Why the stakes are higher than they look
The cost of a weak experiment isn’t only technical waste. It shows up in roadmap distortion.
If you pick the wrong winner, product and engineering may spend a full cycle operationalizing a change that doesn’t improve retention, expansion, or conversion in any meaningful way. Worse, the team may build confidence around the wrong lesson. A weak result can harden into company belief surprisingly fast.
That’s why mature teams treat experimentation as part of product strategy, not a side task owned by growth alone. The test has to answer a business question. It has to protect against false confidence. And it has to produce a next decision that someone can defend in a planning meeting.
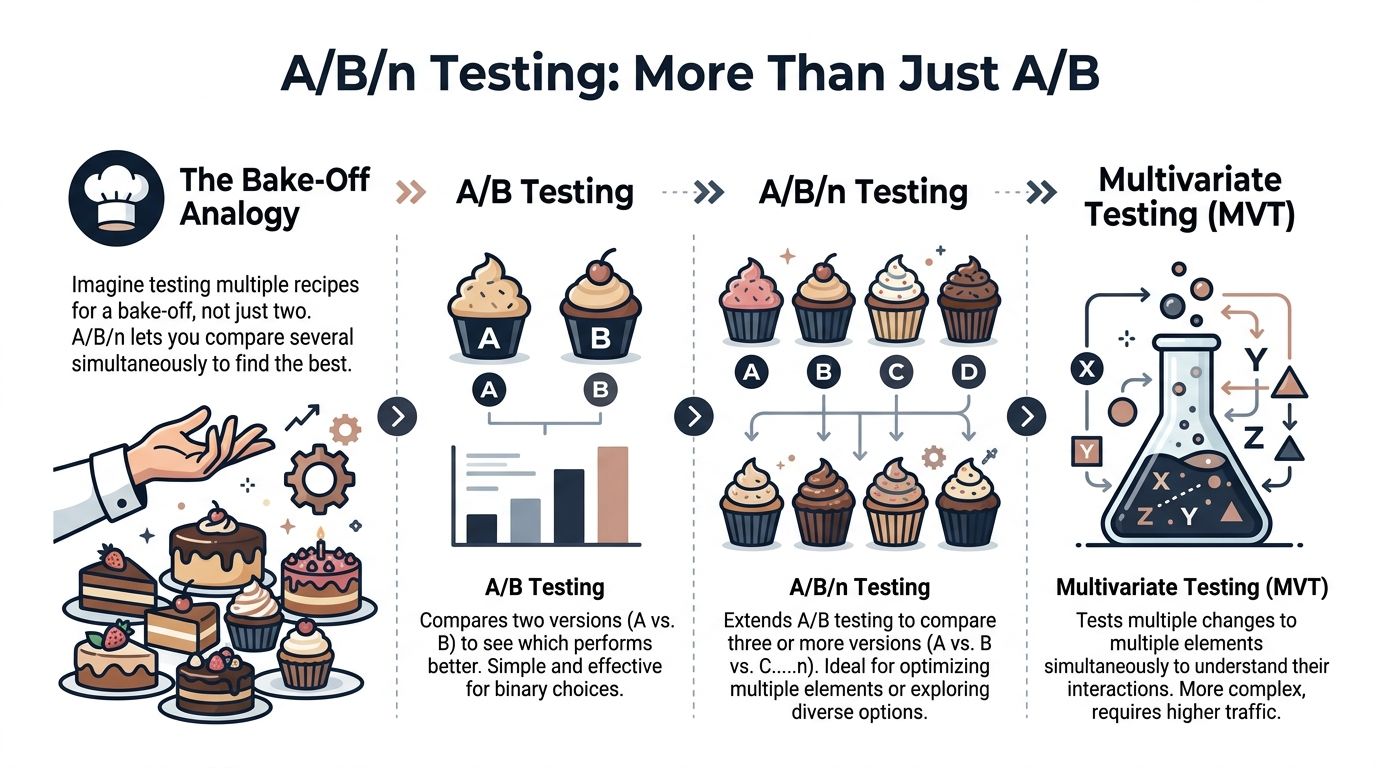
What Is A/B/n Testing and How It Compares
A/B/n testing is simple in concept. You show users a control plus multiple variants at the same time, then compare outcomes against a shared success metric.
If standard A/B testing is a two-recipe bake-off, a b n testing is putting four recipes on the table and letting customer behavior decide which one deserves the menu.
The practical definition
Use a b n testing when you have one problem and several credible solutions.
Examples:
- A pricing page with three headline directions
- An onboarding flow with multiple education patterns
- A signup form with several ways to reduce friction
- A feature announcement with different calls to action
If you’re working specifically on form optimization, this roundup of A/B testing forms for better conversions is useful because forms often look simple but hide some of the highest-friction moments in the funnel.
How it differs from standard A/B testing
Standard A/B testing compares one challenger against control. It’s cleaner, easier to analyze, and often the best place to start when the hypothesis is narrow.
A/B/n testing compares several challengers at once. That’s efficient when you’re choosing among multiple serious options, but it also raises the bar on traffic, analysis discipline, and experiment design.
Where multivariate testing is different
Multivariate testing isn’t just “more variants.” It tests combinations of changes across multiple page elements at the same time.
That sounds powerful, but it gets expensive fast. Testing three variables with three options each creates 27 combinations, so each combination gets only about 3.7% of traffic when split evenly, according to Glassbox on multivariate testing. That’s why multivariate testing often fails in practice for all but the highest-traffic programs.
Multivariate testing is what teams reach for when they want maximum learning. It often gives them minimum confidence instead.
A practical comparison table
| Criterion | A/B Testing | A/B/n Testing | Multivariate Testing (MVT) |
|---|---|---|---|
| Number of versions | Control plus one variant | Control plus several variants | Many combinations across multiple elements |
| Best use case | One focused hypothesis | Several plausible solutions to one problem | Interaction effects between multiple elements |
| Complexity | Low | Medium | High |
| Traffic demand | Lowest of the three | Higher than A/B | Highest by far |
| Analysis difficulty | Straightforward | More care needed | Easy to misuse |
| Good first step for most SaaS teams | Yes | Yes, if traffic supports it | Usually no |
When to use each one
A quick rule of thumb helps:
- Use A/B when you have one strong hypothesis.
- Use A/B/n when you have multiple realistic contenders and enough traffic to compare them responsibly.
- Use MVT only when your testing program is mature, traffic is abundant, and you specifically care about interaction effects.
Most SaaS teams should spend far more time on A/B and a b n testing than on MVT. It’s the difference between learning what customers prefer and drowning in combinations you can’t interpret.
Key Statistical Concepts to Understand
The easiest way to ruin an a b n testing program is to treat the tool’s dashboard as truth.
A graph showing one variant ahead doesn’t mean you’ve learned something reliable. It may only mean you looked too early, split traffic too thinly, or got seduced by random variation.

Sample size changes what you can detect
The most important idea is this. Sample size controls detectability.
According to A Smart Bear’s explanation of A/B testing statistics, the relationship between sample size and detectable differences is non-linear. A dramatic-looking result can still be inconclusive if the sample is too small. Their example is sharp: if one variant gets 6 clicks and another gets 1 click, the test is still inconclusive at N=7. With N=50, the winner needs nearly double the conversions of the loser to reach significance. The same source notes that 80% statistical power is the industry standard.
That’s why experienced teams decide sample size and stopping rules before launch.
What significance actually protects you from
Statistical significance isn’t a trophy. It’s a guardrail.
It helps protect you from declaring a winner when the observed difference may be noise. In product terms, it keeps you from rebuilding a page, changing onboarding, or rolling out a feature flag based on a mirage.
Here’s the practical implication for a b n testing. As you add variants, you increase the number of comparisons. That means more opportunities for a false positive. You can’t just sort the variants by conversion rate and crown the top line.
Three concepts every PM should hold onto
- Significance asks whether the result is likely real
If the answer is unclear, the safe interpretation is “we don’t know yet,” not “ship it anyway.”
- Power asks whether the test was capable of detecting a meaningful difference
A low-powered test can miss a useful change. It doesn’t prove the variant failed. It may prove the experiment was underbuilt.
- Stopping rules protect against peeking
If you check daily and stop when your favorite variant looks best, you increase the odds of fooling yourself.
Practical rule: Don’t launch a b n testing experiment unless you know the sample size target, the stopping point, and the metric that decides the outcome.
Why multiple comparisons are dangerous
In A/B, you’re usually making one clean comparison. In a b n testing, you’re making several.
Each added variant creates another path to accidental “success.” Teams often miss this because the product UI of many testing tools is designed to be friendly, not statistically skeptical. Friendly tools often create overconfident teams.
If you want a solid primer on the mechanics behind this, SigOS has a helpful article on how to do hypothesis testing that’s useful for PMs who need to interpret results without pretending to be statisticians.
What good practice looks like
A disciplined team usually does the following before launch:
- Sets one primary metric: Pick the metric that reflects the decision you’re making.
- Defines guardrail metrics: Watch for harm elsewhere, such as degraded activation quality or lower downstream retention.
- Commits to duration: Don’t stop because a chart looks exciting after a few days.
- Limits variants to what traffic can support: More options are not always more learning.
What bad practice looks like
Watch for these patterns:
| Behavior | Why it breaks the test |
|---|---|
| Checking results constantly | Encourages early stopping and false confidence |
| Changing the goal mid-test | Makes the result hard to interpret |
| Adding weak variants “just to see” | Dilutes traffic and lowers clarity |
| Calling the highest rate the winner | Ignores uncertainty and multiple comparisons |
The best product leaders I’ve worked with aren’t obsessed with fancy statistical language. They’re obsessed with not fooling themselves. That mindset matters more than any calculator.
A Practical Workflow for Your Next Experiment
Good a b n testing doesn’t start in the testing tool. It starts in the backlog, where too many teams mix customer pain, feature requests, and executive preferences into one shapeless pile.
The cleaner workflow is to move from problem to hypothesis to implementation choice.
Start with one business problem
Don’t begin with variants. Begin with a constraint or bottleneck.
Examples:
- Trial users don’t reach the product’s first meaningful outcome fast enough
- Pricing page visitors hesitate at the plan selection step
- New feature discovery is weak after launch
- Users experience confusion in a workflow that support keeps explaining manually
That gives the experiment a real job to do.
Build a hypothesis with a clear causal claim
A useful hypothesis has three parts:
- Observed problem
- Proposed change
- Expected business effect
For example, “Users stall during onboarding because setup asks for too much context too early. Replacing the current setup with guided presets, checklist setup, and deferred configuration should improve completion quality and increase activation.”
That’s already more valuable than “test some onboarding ideas.”
Choose variants with intent
Many teams overproduce. You don’t need five weak variants. You need a small set of sharp options that represent distinct bets.
A strong variant set usually includes:
- Control that reflects today’s experience
- Variant B as the lowest-risk improvement
- Variant C as a more opinionated alternative
- Variant D only if it represents a distinct mechanism
If two variants are almost the same, combine them or cut one.
Match the test method to the change
Product maturity becomes evident.
Client-side testing works for visible, interface-level changes. Headlines, CTA placement, plan labels, form friction, and message hierarchy fit here.
Server-side testing is different. It lets teams test changes deeper in the stack, including algorithms, feature flags, workflows, and backend logic. That matters because the highest-value product questions are often not cosmetic. As AB Tasty explains in its server-side testing overview, server-side testing enables full-stack experimentation and lets teams validate core product changes before a risky broader rollout.
The most valuable test in SaaS often isn’t a button color test. It’s whether a different product behavior changes customer outcomes.
Instrument the experiment properly
Before launch, confirm:
- Primary metric is explicit
- Guardrails are defined
- Exposure logging is accurate
- Segmentation rules are stable
- Rollout method is reversible
This is also the point where product managers benefit from lightweight analytical fluency. If you need a stronger operational foundation, this practical guide to Python programming for data analysis is useful for PMs and analysts who want to audit experiment data, clean event exports, or inspect anomalies without waiting on a dedicated data scientist.
A short walkthrough helps if your team needs a visual reset on experiment setup and interpretation:
A repeatable workflow in plain terms
| Step | What to do | What to avoid |
|---|---|---|
| Problem selection | Choose a bottleneck tied to revenue, retention, or activation | Testing whatever is easiest to mock up |
| Hypothesis | Make one causal claim | Writing vague “let’s improve conversions” goals |
| Variant design | Test distinct ideas | Creating minor cosmetic duplicates |
| Implementation | Use client-side or server-side appropriately | Forcing everything into front-end tests |
| Readout | Decide based on the predefined metric | Hunting for any metric that makes the result look good |
That workflow sounds simple because it is. The difficulty is enforcing it when the organization wants quick answers.
Real-World Examples of A/B/n Testing in SaaS
The easiest way to understand a b n testing is to look at situations where a product team has more than one plausible fix and can’t afford to guess.
Onboarding flow redesign
A SaaS company sees new users signing up but failing to reach their first useful outcome quickly enough. Support transcripts suggest confusion during setup, but the cause isn’t singular. Some users need guidance. Others want speed. Some don’t understand what data to connect first.
The team runs an a b n testing experiment with:
- Control using the current setup flow
- Variant B adding a guided checklist
- Variant C using role-based onboarding paths
- Variant D deferring advanced setup until after first success
The winning version might not be the one with the highest initial completion rate. It might be the one that produces the strongest downstream activation quality and fewer support-driven rescue moments.
That’s where product leaders need to connect experiment design with actual customer behavior. A useful companion read here is SigOS’s piece on data-driven design, especially if your team tends to optimize screens without validating the customer problem behind them.
Pricing page message testing
Another SaaS team knows the pricing page is doing a poor job of helping buyers choose. The sales team says prospects need more reassurance. Marketing thinks the page needs clearer differentiation. Product believes the issue is cognitive overload.
They don’t need one answer from a meeting. They need evidence.
So they test:
- Control with the existing pricing page
- Variant B with clearer plan comparison
- Variant C with stronger social proof and use-case framing
- Variant D with annual-plan emphasis and simplified package naming
This kind of test is useful because each version reflects a different hypothesis about buyer friction. If one variant wins, the team gains more than a better page. It learns what buyers need to move forward.
Feature adoption after launch
A common SaaS problem is feature invisibility. Teams build something meaningful, announce it once, then wonder why adoption lags.
A b n testing works well here because the promotion mechanism itself is usually uncertain. The product team may test:
| Variant | Promotion style | Underlying hypothesis |
|---|---|---|
| Control | Small in-app badge | Awareness alone may be enough |
| Variant B | Contextual tooltip at moment of need | Timing matters more than visibility |
| Variant C | Guided walkthrough | Users need help understanding value |
| Variant D | Task-based prompt tied to workflow | Relevance beats announcement |
The point isn’t just to find the prompt with the most clicks. It’s to learn which adoption pattern aligns with meaningful usage and ongoing value.
A winning experiment should teach you something reusable about user behavior, not just hand you a prettier dashboard.
These examples all share the same discipline. One business problem. Several credible approaches. One structured decision.
Common Pitfalls and How to Avoid Them
Most failed a b n testing programs don’t fail because the team lacked ideas. They fail because the team trusted noisy results, overbuilt the experiment, or tested complexity they couldn’t support.
A pre-mortem is useful here. Assume the experiment produced a misleading answer. What probably caused it?
Pitfall one, too many variants for available traffic
A/B/n testing creates optionality, but every extra variant splits traffic further. If the audience is limited, you end up with a test that feels ambitious and answers nothing.
The fix is blunt. Cut weak variants early.
If a variant doesn’t represent a distinct strategic bet, remove it before launch. You’ll learn more from three strong options than from six half-formed ones.
Pitfall two, stopping when the chart looks good
Teams love momentum. If Variant C jumps ahead in the first stretch, people want to call it.
That’s how false positives get promoted into roadmap work.
The fix is governance, not just math. Decide the stopping rule before launch, make it visible to everyone, and don’t let stakeholder excitement override it.
Pitfall three, ignoring external distortion
Seasonality, campaign traffic, launch announcements, pricing changes, and sales outreach can all contaminate interpretation.
A pricing page test running during a major promotional push is no longer just a pricing page test. It’s a mixed signal.
Use a simple checklist before reading results:
- Traffic source stability: Did acquisition mix change materially during the run?
- Campaign overlap: Did paid or lifecycle campaigns influence the same users?
- Product context: Did another release alter behavior upstream or downstream?
- Operational noise: Did outages, bugs, or support interventions distort normal usage?
Pitfall four, mistaking high-dimensional data for insight
This one is more subtle and more common than teams admit.
In SaaS environments, product teams often want to test or model behavior using many signals at once. Support tags, usage events, account traits, session patterns, feature flags, and message interactions pile up quickly. When the number of features exceeds the number of samples, you hit the large p, small n problem.
According to Statsig’s discussion of A/B testing in high-dimensional spaces, traditional A/B/n testing in that setting can produce overfitting and unreliable insights. The same source points to approaches like regularization and CUPED as ways to reduce variance and make smaller-sample analysis more trustworthy.
In plain language, if you throw too many variables at too little data, the model may learn noise and present it as pattern.
Pitfall five, running multivariate logic without multivariate traffic
Some teams say they’re doing a b n testing, but they’re sneaking multivariate complexity into variant design. Variant B changes messaging and layout. Variant C changes layout and pricing emphasis. Variant D changes onboarding copy and CTA order.
Now you don’t know what caused the result.
The fix is cleaner experiment construction. Each variant should express one coherent idea. If multiple elements change together, they should all support the same hypothesis.
Don’t ask one experiment to answer three different product questions.
A quick pre-mortem table
| Pitfall | What it looks like | Better move |
|---|---|---|
| Traffic dilution | Many variants, no clear readout | Fewer, stronger variants |
| Peeking | Calling winners too early | Predetermine stopping rules |
| Context contamination | Campaigns or launches overlap the test | Run during more stable periods |
| High-dimensional overfitting | Too many signals, weak trust in conclusions | Reduce features, use variance reduction methods |
| Variant confusion | Too many changes inside each challenger | Keep each variant strategically coherent |
The practical lesson is simple. Most experimentation mistakes happen before the first user ever sees a variant.
Connecting Test Results to Revenue and Product Strategy
A team ships a winning variant on Friday. By Monday, the uplift is in the recap deck, but nobody has answered the hard questions. Is the gain large enough to justify rollout work? Does it improve revenue from the right customers? Should it change what gets built next quarter?
Those questions are where experimentation starts to earn its keep.

From result to operating decision
Post-test analysis should end with a decision memo, not a screenshot of the dashboard. The job is to translate a measured lift into an operating call the business can act on.
That usually means answering five questions:
- Who changed behavior? New accounts, high-intent buyers, self-serve users, or existing customers?
- What metric moved downstream? Activation, paid conversion, retention, expansion, support load, or sales efficiency?
- What is the likely revenue effect? More pipeline, better close quality, stronger retention, or larger account growth?
- What does rollout cost? Engineering hardening, analytics updates, QA, documentation, and support training.
- What should change in the roadmap? Ship broadly, release to a segment, queue a follow-up test, or drop the idea.
It is often at this juncture that weak readouts usually fall apart. They stop at clickthrough or form completion and skip the economics. A variant can lift a local metric while bringing in lower-fit customers, creating more onboarding friction, or pulling demand forward without improving retention.
Build the business case, not just the recap
A useful post-test readout has four parts.
- Observed behavior changeState the metric shift and the segment where it showed up.
- Commercial interpretationExplain why that behavior matters. Faster activation may matter because activated accounts retain better. A pricing-page lift may matter only if those users convert to plans with healthy margins.
- Implementation decisionRecommend full rollout, segmented rollout, further validation, or no launch.
- Portfolio impactSpell out what moves up or down the roadmap because of the result.
Good teams also write down the trade-offs. If a variant improves conversion but increases support tickets, note it. If rollout requires backend work that delays a larger retention project, note that too. Product strategy is a resource allocation exercise, and experiment results need to compete on those terms.
If your team needs a cleaner finance layer for that conversation, SigOS provides a practical return on investment template for turning product changes into a prioritization case leadership can review.
What strong teams do after a win
The next move depends on the kind of signal you found.
A pricing test that wins with enterprise traffic but not self-serve traffic points to segmentation, not a blanket rollout. An onboarding variant that lifts activation but has no retention effect may deserve one follow-up experiment, not a full rebuild of the setup flow. A recommendation change that improves expansion in larger accounts may justify infrastructure investment because the downstream value is high.
That is the key strategic use of a b n testing. It helps teams decide where additional effort will pay back, and where a nice-looking result should stay small.
Platforms like SigOS help on both sides of that equation. Before the test, they help teams choose problems tied to churn, expansion, and revenue quality instead of chasing surface-level conversion ideas. After the test, they help connect the winning behavior to account value, customer risk, and the size of the business opportunity. That makes it easier to defend the rollout, or reject it, with discipline.
A winning variant matters less than a clear decision backed by evidence and economics.
Keep Reading
More insights from our blog


Ready to find your hidden revenue leaks?
Start analyzing your customer feedback and discover insights that drive revenue.
Start Free Trial →