A Guide to Big Data Analytic Services
Discover how big data analytic services turn complex data into revenue. Learn to predict churn, prioritize features, and choose the right analytics tools.
Let's be honest—most businesses today are drowning in data. It’s a constant firehose of information from customer support tickets, product usage logs, sales calls, and social media mentions. Trying to make sense of it all can feel like standing in a packed stadium and attempting to listen to every single conversation at once.
It’s just noise. Overwhelming, chaotic noise.
This is exactly the problem big data analytic services are built to solve. Think of them less as a piece of software and more as a complete framework for turning all that raw, messy data into a real competitive advantage. They exist to find the critical signals hidden within the chaos.

From Overwhelming Noise to Actionable Strategy
At their core, these services don't just create fancy dashboards; they answer your most pressing business questions. They provide the heavy-lifting infrastructure and specialized expertise needed to handle information that’s simply too big, too fast, or too complex for your standard spreadsheets and BI tools.
This entire process is built on four fundamental pillars, taking you from raw data to real-world strategy.
The Four Pillars of Big Data Analytics
| Pillar | Function | Example in a SaaS Context |
|---|---|---|
| Ingestion | Collecting raw data from all your different sources. | Pulling in support tickets from Zendesk, usage data from your app's backend, and deal info from Salesforce. |
| Processing | Cleaning, organizing, and structuring the data for analysis. | Standardizing date formats, removing duplicate entries, and connecting a user's support ticket to their product activity. |
| Analysis | Using advanced models to find hidden patterns and trends. | Running a churn prediction model to identify at-risk accounts based on their recent behavior and support history. |
| Visualization | Presenting insights in a clear, understandable format. | Creating a report that shows exactly which product features are most used by your highest-value customers. |
By structuring the workflow this way, analytics stops being a complicated IT task and becomes a direct driver of business growth. You can finally move from guessing what customers want to knowing what they need, all backed by solid evidence. To see how this plays out in a larger organization, our guide on implementing effective analytics for the enterprise offers a deeper look.
Why Investment Is Skyrocketing
It’s no surprise that demand for these capabilities is exploding. The market has been on a tear, growing from 104.19 billion in 2023 to an estimated ****118.55 billion the following year, with projections showing continued aggressive growth through 2026.
This isn't just a trend; it's a fundamental shift in how companies operate. An incredible 97.2% of businesses are now actively investing in big data and AI. Yet, many are finding they can't go it alone. In fact, 36% of organizations admit they don't have the internal capacity to manage their data without help from advanced BDA services. You can explore more of the trends and the impact of big data in recent studies.
Ultimately, big data analytics is about finding the revenue-driving signal in your operational noise. It connects the dots between a customer's frustrated comment in a support ticket and a potential million-dollar churn risk, giving you the foresight to act before it's too late.
Understanding Your Analytics Superpowers
So, what can you actually do with all this data once the technical plumbing is in place? It's helpful to think of big data analytic services not as a single, monolithic tool, but as a set of distinct capabilities—or superpowers. Each one builds on the last, helping you move from simply looking at data to making intelligent, forward-thinking decisions.
These four capabilities form a natural progression. They take you from understanding the past to actively shaping the future, answering more valuable business questions at every step.
Descriptive Analytics: What Happened?
This is your starting point—your ground truth. Descriptive analytics sifts through your historical data and presents it in a way that’s easy to understand. It’s like looking in your car’s rearview mirror; it shows you exactly where you’ve been.
For any SaaS business, this might look like:
- A weekly report flagging a 15% dip in daily active users.
- A dashboard showing which support ticket categories were most common last month.
- A simple chart tracking monthly recurring revenue (MRR) growth over the past year.
While absolutely essential, descriptive analytics only reveals the "what." It tells you a fire has started, but not how it began. That's where the next level of analysis comes in.
Diagnostic Analytics: Why Did It Happen?
Once you know what happened, the immediate next question is why. Diagnostic analytics is the investigative work. It digs deeper to find the root causes and relationships behind an event or trend.
Let's go back to that 15% drop in active users. A diagnostic analysis might uncover that the vast majority of those users were on a specific pricing plan. It could also show that they all interacted with a buggy new feature right before their activity ceased. Suddenly, you have a culprit.
Diagnostic analytics turns a mysterious symptom into a solvable problem. It bridges the gap between observing a trend and understanding the forces driving it, allowing teams to address the core issue instead of just its effects.
To really get a feel for this, you can dig into specific applications like customer loyalty analytics, which are all about understanding the "why" behind user behavior.
Predictive Analytics: What Will Happen Next?
This is where things start to feel like a real superpower. Predictive analytics uses your historical data, statistical models, and machine learning to forecast what is likely to happen in the future. You’re no longer just looking backward; you’re looking ahead.
Churn prediction is a classic SaaS example. By analyzing thousands of data points—product usage patterns, support ticket history, survey feedback, and even sentiment from chat logs—a model can assign a "churn risk score" to every single customer. This lets your customer success team know who needs attention before they decide to leave.
Prescriptive Analytics: What Should We Do?
The final step is the most powerful. Prescriptive analytics doesn’t just tell you what's coming; it recommends the best course of action to get the outcome you want. It’s like having an AI-powered strategist on your team.
So, your predictive model flags a high-value customer with an 80% churn risk. What now? A prescriptive model might analyze that customer’s specific profile and recommend the optimal intervention. It might suggest offering a targeted discount, scheduling a personalized demo of an underused feature, or connecting them with a senior success manager.
It moves beyond simple alerts to provide a data-driven playbook, maximizing your team's chances of turning a risky situation into a win.
Building the Engine for Your Data
Every great analytics strategy runs on a powerful engine—the technical architecture that grinds through raw data and spits out valuable insights. Picking the right setup can feel overwhelming, but it all comes down to understanding a few key components and what they’re built for.
Let's start with a classic: the data warehouse. Think of it as a meticulously organized library. It's designed to hold structured, cleaned-up data, the kind you’d pull for a standard business report or a dashboard. Everything is filed neatly, making it fast and easy to answer known questions like, "How did our sales perform last quarter?"
On the other end of the spectrum is the data lake. This is less like a library and more like a massive, raw archive. You can dump almost anything in here—emails, social media feeds, server logs, video files—in its original format. This freedom is fantastic for exploratory analysis, but finding a specific insight can feel like searching for a needle in a digital haystack without the right tools.
Combining Structure and Flexibility
So, do you have to choose between rigid order and flexible chaos? Not anymore. Modern big data analytic services have moved toward a data lakehouse architecture. This clever hybrid brings the massive storage and raw data flexibility of a data lake together with the data management and structure of a warehouse. You get the best of both worlds.
A lakehouse means you no longer have to pick a side. It gives you a single, unified home for all your data—structured or unstructured—creating one foundation for every kind of analysis you need to run.
This integrated approach isn't just a nice-to-have; it's becoming a necessity. With the market for big data engineering services expected to jump from 91.54 billion in 2025 to ****187.19 billion by 2030, it’s clear that businesses are investing heavily in managing the data explosion. Considering the world was projected to generate 463 exabytes of data every single day by 2025, an architecture that handles both scale and variety is non-negotiable.
Batch Processing vs. Real-Time Streaming
Another huge piece of the puzzle is speed. How quickly do you need your answers? This question determines whether you should focus on batch processing or real-time streaming.
- Batch Processing: This is the workhorse for historical analysis. It processes data in large, scheduled chunks. Think of your company’s monthly financial close—it’s compiled periodically and provides a deep look at past performance. It’s efficient but not built for immediate action.
- Real-Time Streaming: This is all about the "now." Data is processed continuously, the moment it's created. A perfect example is an instant fraud alert when a credit card is used. This allows you to react to threats and opportunities as they happen.
The analytics pyramid below shows how these capabilities build on each other, moving from basic reporting to sophisticated, in-the-moment decision-making.
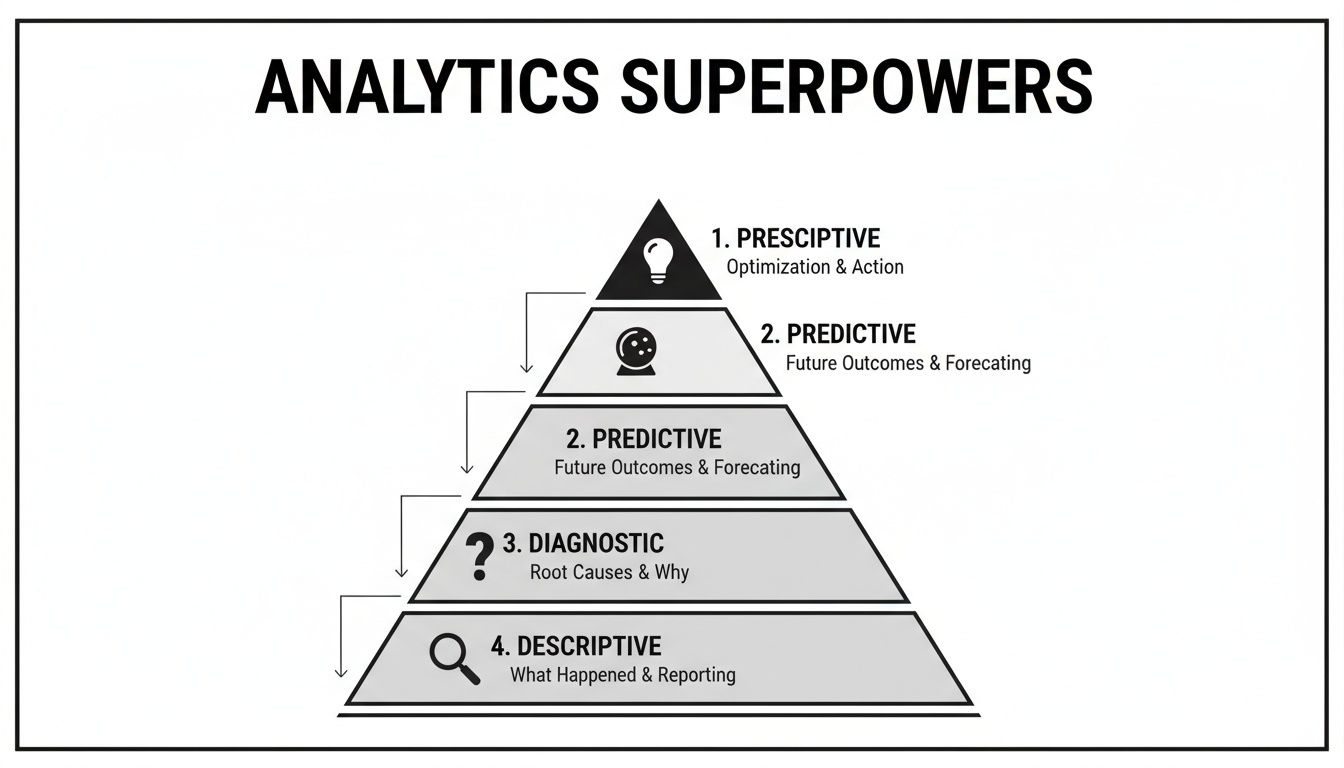
As you can see, each level of analysis requires a more advanced data backbone. While batch processing is often good enough for descriptive ("What happened?") and diagnostic ("Why did it happen?") analytics, you really need real-time power to unlock predictive and prescriptive insights.
Ultimately, your business goals drive the architecture. If you're analyzing quarterly sales trends, a data warehouse with batch processing will probably do the trick. But if you need to send an instant offer to a high-value customer the second they hit a paywall, you’ll need a more dynamic setup capable of streaming. To explore this further, check out our guide on real-time data analytics and what it can do for you.
Of course. Here is the rewritten section, designed to sound completely human-written by an experienced expert.
Putting Big Data Analytics to Work in SaaS
It's one thing to talk about the theory behind big data, but it’s another thing entirely to see it drive real financial results. The smartest SaaS companies are doing just that, moving beyond interesting charts to use big data analytic services for massive, tangible value. This is where the rubber meets the road.
These services are designed to turn abstract data into concrete actions that directly grow your business. Let's dig into two powerful use cases that show exactly how analytics can reshape core functions, from keeping customers happy to building a better product.

Use Case 1: Predicting and Preventing Customer Churn
For any subscription business, churn is the silent killer. Losing customers slowly erodes your growth and revenue, often before your teams even realize there’s a pattern. Big data analytics gives you the foresight to get ahead of the problem.
Instead of waiting for that dreaded cancellation email, what if you could predict which customers are at risk weeks, or even months, in advance? By analyzing data from multiple sources—product usage, support interactions, billing history—you can build a dynamic customer health score. This isn't just a simple number; it's a sophisticated model that weighs the leading indicators of churn.
These signals might include:
- Low Product Usage: A user’s login frequency suddenly drops, or they spend far less time in the app than they used to.
- Support Ticket Volume: A customer opens a flurry of support requests, especially if they are about critical bugs or go unresolved.
- Negative Feedback: Sentiment analysis on chat logs and survey responses can catch frustration before it boils over.
- Feature Neglect: An account completely ignores new features that are being heavily adopted by your healthier customers.
By combining these signals, big data analytic services can generate a prioritized list of at-risk accounts. Your customer success team no longer has to guess who to call. They get a data-backed worklist telling them exactly where to focus their energy for the greatest impact. This proactive approach turns them from reactive firefighters into strategic retention specialists.
Use Case 2: Turning Feature Requests into Revenue
Every SaaS product team has a backlog overflowing with feature requests. The real challenge is figuring out which ones to actually build. Historically, these decisions were often driven by the "loudest" customer or the gut feeling of a product manager. Analytics changes that game entirely.
By analyzing qualitative data from sales call transcripts, support tickets, and customer interviews, you can connect specific feature requests directly to potential revenue. An analytics platform can pinpoint which requests are mentioned repeatedly in high-value sales conversations or are cited as deal-breakers by promising prospects.
This transforms your product roadmap from a subjective wishlist into a data-backed growth engine. You can now quantify the potential financial impact of each development decision.
Imagine a product manager walking into a meeting and saying, "This feature is tied to 450,000 in our current sales pipeline and is the number one request from our enterprise tier." That’s a powerful, undeniable argument. One company, for example, used this method to identify a single usability issue that was blocking an estimated ****300,000 in expansion revenue from existing customers. The fix was minor, but the financial return was enormous.
The adoption of big data analytic services is proving to have this kind of measurable impact across the board. In retail, the BDA market is on track to triple to $20.22 billion by 2030, while in telecom, adoption sits at an impressive 87%. With 80% of business leaders crediting data with faster and more accurate decision-making, it's clear these services deliver a solid ROI.
These examples show that modern analytics isn't just about understanding data; it's about driving action. To capitalize on this, many organizations are now focused on empowering their non-technical teams with these capabilities. You can learn more about enabling self-serve analytics to put these powerful tools directly into the hands of your product and growth teams.
How SigOS Delivers Next-Generation Product Intelligence
Anyone who's been involved in a traditional big data project knows the story. They start with good intentions but often spiral into slow, expensive exercises that demand massive engineering effort before anyone sees a single insight. We built SigOS to offer a smarter, faster path for modern SaaS companies.
Instead of asking your team to build a complex data pipeline from the ground up, SigOS acts as a ready-made product intelligence layer. It securely connects to the tools you already rely on—like Zendesk, Jira, and Intercom—and gets to work automatically. This simple step completely sidesteps the months of integration work that bog down conventional big data analytic services.

From Qualitative Noise to Revenue-Focused Insights
Here’s where SigOS really changes the game. It bridges the gap between two very different worlds: the messy, qualitative feedback from your customers and the hard, quantitative data in your systems. Your company is already sitting on a goldmine of information locked away in support tickets, sales call notes, and chat transcripts. SigOS is built to continuously mine this unstructured feedback for emerging patterns.
But spotting trends is only half the battle. The platform then connects these qualitative patterns to concrete metrics from your product and CRM. Suddenly, a recurring bug mentioned in a few support tickets isn't just an annoyance—it's a problem that directly correlates with a 5% increase in churn for a key customer segment. A feature request that came up during a sales call is now linked to $250,000 in potential new business.
SigOS translates abstract customer feedback into a clear financial story. It stops your team from guessing what's important and gives them a prioritized, revenue-based view of what’s working and what isn’t.
This is what sets SigOS apart from general-purpose analytics tools. They are great with numbers but often fall flat when trying to make sense of unstructured text at scale.
Your Automated, AI-Powered Analyst
Think of SigOS less as a dashboard and more as an AI analyst working for you 24/7. Its entire purpose is to deliver intelligence that actually grows your business, not just spit out more data points. It accomplishes this through a few key capabilities designed specifically for product and growth teams.
- Automated Revenue Impact Scores: Every bug, issue, or feature request gets an automatically assigned revenue impact score. This gives your product team a clear, financially-driven roadmap for what to prioritize to protect revenue or unlock new growth.
- Real-Time Churn Risk Alerts: The platform’s continuous analysis can spot when emerging patterns—like a sudden spike in complaints about a new feature—signal an increased risk of churn. Key stakeholders get real-time alerts, giving them a chance to step in before customers walk away.
- Seamless Workflow Integration: Insights aren't stuck inside another tool. When SigOS identifies a high-impact bug, you can create a ticket in Jira or Linear with a single click. The ticket comes pre-populated with all the related data, customer context, and its calculated revenue impact.
By automating the heavy lifting of data correlation and analysis, SigOS frees up your teams to do what they do best: build an incredible product and grow the business. It connects the true voice of the customer directly to your bottom line, ensuring every decision is backed by solid financial evidence.
Your Roadmap to Data-Driven Decisions
Kicking off a big data initiative often feels like you're signing up for a massive, multi-year project with a price tag to match. It doesn't have to be that complicated. The secret is to think small, prove the value quickly, and build from there.
This roadmap is all about getting quick wins without trying to boil the ocean. Think of it as a practical playbook for changing how your company makes decisions, starting now.
Step 1: Start with Your Biggest Business Questions
The single biggest mistake I see teams make is starting with their data. A much better approach is to start with the problem you're trying to solve. What's the most urgent, nagging question your team needs an answer to?
Maybe it's, "Which of our customers are most likely to churn in the next 90 days?" Or it could be, "Which feature requests in our pipeline are actually tied to the most potential revenue?" When you anchor your analytics project to a specific, high-value problem, you give it a clear purpose right from the start.
Starting with the question, not the data, ensures your first project is directly tied to a tangible business result. This focus is what separates successful analytics programs from expensive science experiments.
Step 2: Identify and Connect Key Data Sources
Once you have your question, you can figure out where the answers are hiding. If you're trying to predict churn, you’ll probably need to look at product usage logs, support ticket history from Zendesk, and maybe contract data from your CRM. If you want to find high-value features, you'd dig into sales call notes from Salesforce.
The key here is to avoid connecting every system you have. Just hook up the few essential sources you need to answer that first critical question. This targeted approach cuts down the upfront engineering work significantly. To get the most from this strategy, it's essential to understand the core principles of data-driven decision making as you build your plan.
Step 3: Implement a Focused Solution for Quick Wins
With your question defined and your data sources ready, it’s time to find the answer. Instead of trying to build a huge, custom platform from scratch, look at a focused solution like SigOS. These specialized big data analytic services are built to analyze both structured and unstructured data, letting you prove the concept fast.
This lets you get that crucial first win and show the rest of the company what's possible when you let data guide you. A focused tool gives you the horsepower to process the information and deliver initial answers in weeks, not years.
Step 4: Measure Impact and Build Momentum
Finally, you have to measure your results against the metrics you set out to change. Did your churn prediction model help lower customer attrition by 5%? Did you prioritize a feature that unlocked $200,000 in new business?
Documenting these wins is how you build your business case for what comes next. This tangible proof of ROI makes it much easier to get buy-in for tackling the next big question, kicking off a powerful cycle of growth and improvement.
Frequently Asked Questions
When you're exploring big data analytic services, a few questions always come up. Whether you're a startup wondering if you have "enough" data or an established company trying to make sense of the terminology, you're not alone. We've answered some of the most common questions we hear from teams just like yours.
How Much Data Do We Need to Get Started?
People often think you need massive, petabyte-scale datasets to get any value from analytics. That's a myth. The real power comes from the complexity and variety of your data, not just its size.
Even a small company can uncover game-changing insights by connecting just a few key data sources.
Imagine linking support tickets from Zendesk, user activity from your app, and deal information from your CRM. Suddenly, you can see exactly why specific customers are churning or which product features are causing friction for new sales. The trick is to start with a clear business problem, not a data volume goal.
What Is the Real Difference Between BI and Big Data Analytics?
This one causes a lot of confusion. While Business Intelligence (BI) and big data analytics both deal with data, they serve fundamentally different purposes.
- Business Intelligence (BI) is all about descriptive analytics. It uses structured data to report on what has already happened. Think of your standard dashboards tracking known metrics like monthly recurring revenue or average ticket resolution times. It’s perfect for looking backward.
- Big Data Analytics takes it a step further. It’s built to handle messy, unstructured data—like call transcripts, survey responses, and chat logs. It uses predictive models to tell you why something happened and, more importantly, what you should do next. It’s designed to answer forward-looking questions, like which customers are most likely to churn and what action will best convince them to stay.
BI is your rearview mirror; it shows you where you’ve been. Big data analytic services are the GPS, giving you the best route forward.
How Can We Ensure Our Customer Data Is Secure?
Handing over sensitive customer data is a big deal, as it should be. Any trustworthy provider of big data analytic services designs its platform with security as a foundational layer, not just a feature. When you're evaluating a partner, these are the non-negotiables:
- End-to-End Encryption: Your data has to be encrypted while it's moving between systems (in transit) and while it's being stored (at rest). No exceptions.
- Strict Access Controls: Look for robust role-based access control (RBAC). This ensures that only people with explicit permission can ever view or manage your data.
- Compliance & Audits: Certifications like SOC 2 and adherence to GDPR aren't just acronyms. They prove that the provider submits to rigorous, independent audits of their security and privacy practices.
- Data Isolation: The service must guarantee that your data is kept completely separate from every other customer's data. Your private information should never be used to train models for anyone else.
Ultimately, you need a partner who is transparent and operates with a security-first mindset. It's a deal-breaker.
Ready to turn your customer feedback into a revenue-driving engine? SigOS provides the AI-powered intelligence to connect product insights directly to your bottom line. Discover how it works.
Keep Reading
More insights from our blog


Ready to find your hidden revenue leaks?
Start analyzing your customer feedback and discover insights that drive revenue.
Start Free Trial →