Churn Analysis Report: Template, Metrics, and Examples
Build a churn analysis report that actually drives action. Get the key metrics, sections, data sources, visualization examples, and recommendations you need
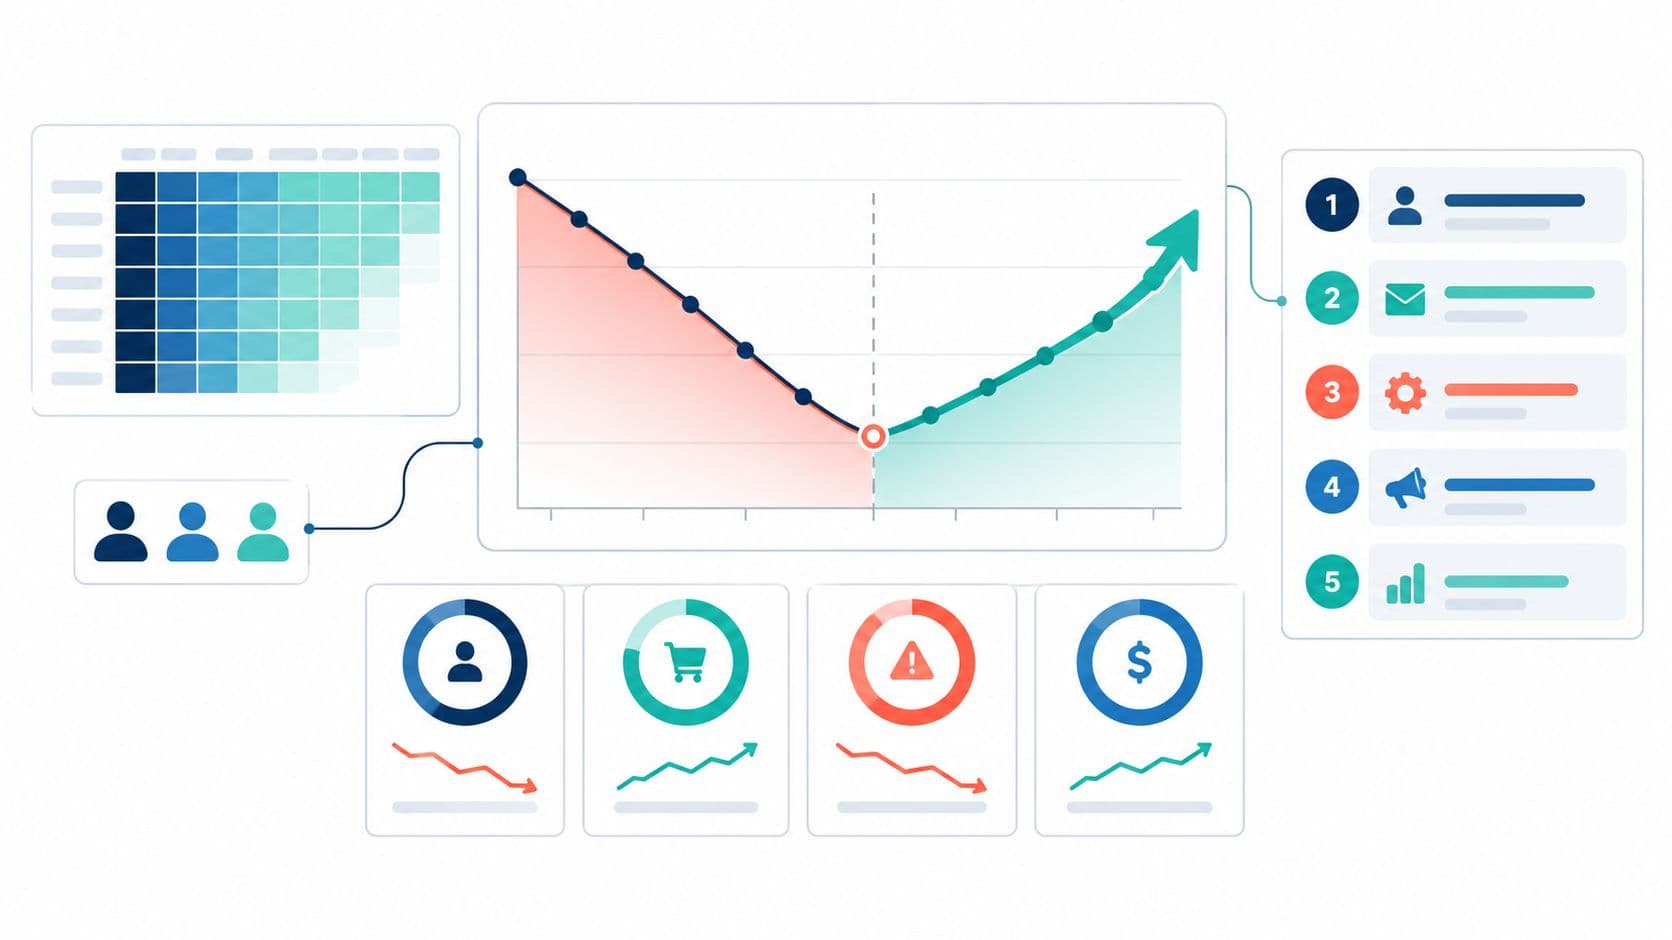
A monthly review ends with the churn rate on screen and a familiar question from the executive team: “Which customers are driving the loss?” The slide shows one blended figure. It can't distinguish a wave of small-account cancellations from a few large customers cutting spend, so nobody leaves the meeting knowing which problem to tackle.
That's what separates a useful churn analysis report from a dashboard refresh. The report has to reconcile customer losses with revenue movement, show where risk concentrates, and give someone a specific next action to own. If a metric looks reassuring but conceals a serious revenue leak, the report should make that visible before the meeting ends.
Why Most Churn Reports Fail in the Executive Review
The blended number in that meeting could be accurate and still be useless. Logo churn might be steady while a high-value segment downgrades or cancels. Or the customer count might fall while expansion from retained accounts offsets some of the lost revenue. Without the separate views, leaders can't tell whether they're facing a retention problem, an expansion problem, or both.
Three reporting habits create this blind spot:
- Blended metrics hide direction. One customer churn rate treats every account equally, even though account value and revenue movement differ.
- Descriptive numbers lack causal evidence. A report can show that usage fell before cancellation without proving that the decline caused the departure. Timing and context matter.
- The meeting has no decision frame. A list of charts doesn't say which customers to contact, who should do it, or what outcome would justify the effort.
A decision document answers more than “What changed?” It connects the change to affected customers and recurring revenue, flags uncertainty in the underlying data, and recommends an intervention with an owner and a way to judge the result.
Practical rule: If an executive can't point to the customer segment, revenue exposure, and next owner after reading a chart, the chart hasn't finished its job.
A report earns its place in the review by making the trade-off clear. Retention teams can't spend equal effort on every account. Product teams can't treat every usage decline as a defect. The report should make the next reasonable action easier to choose, not ask leaders to infer it from a blended rate.
Core Churn Metrics and How to Calculate Them
Start by naming the metric, defining its population, and writing down the formula. These measures answer different questions, so don't combine them into one headline called “churn.”
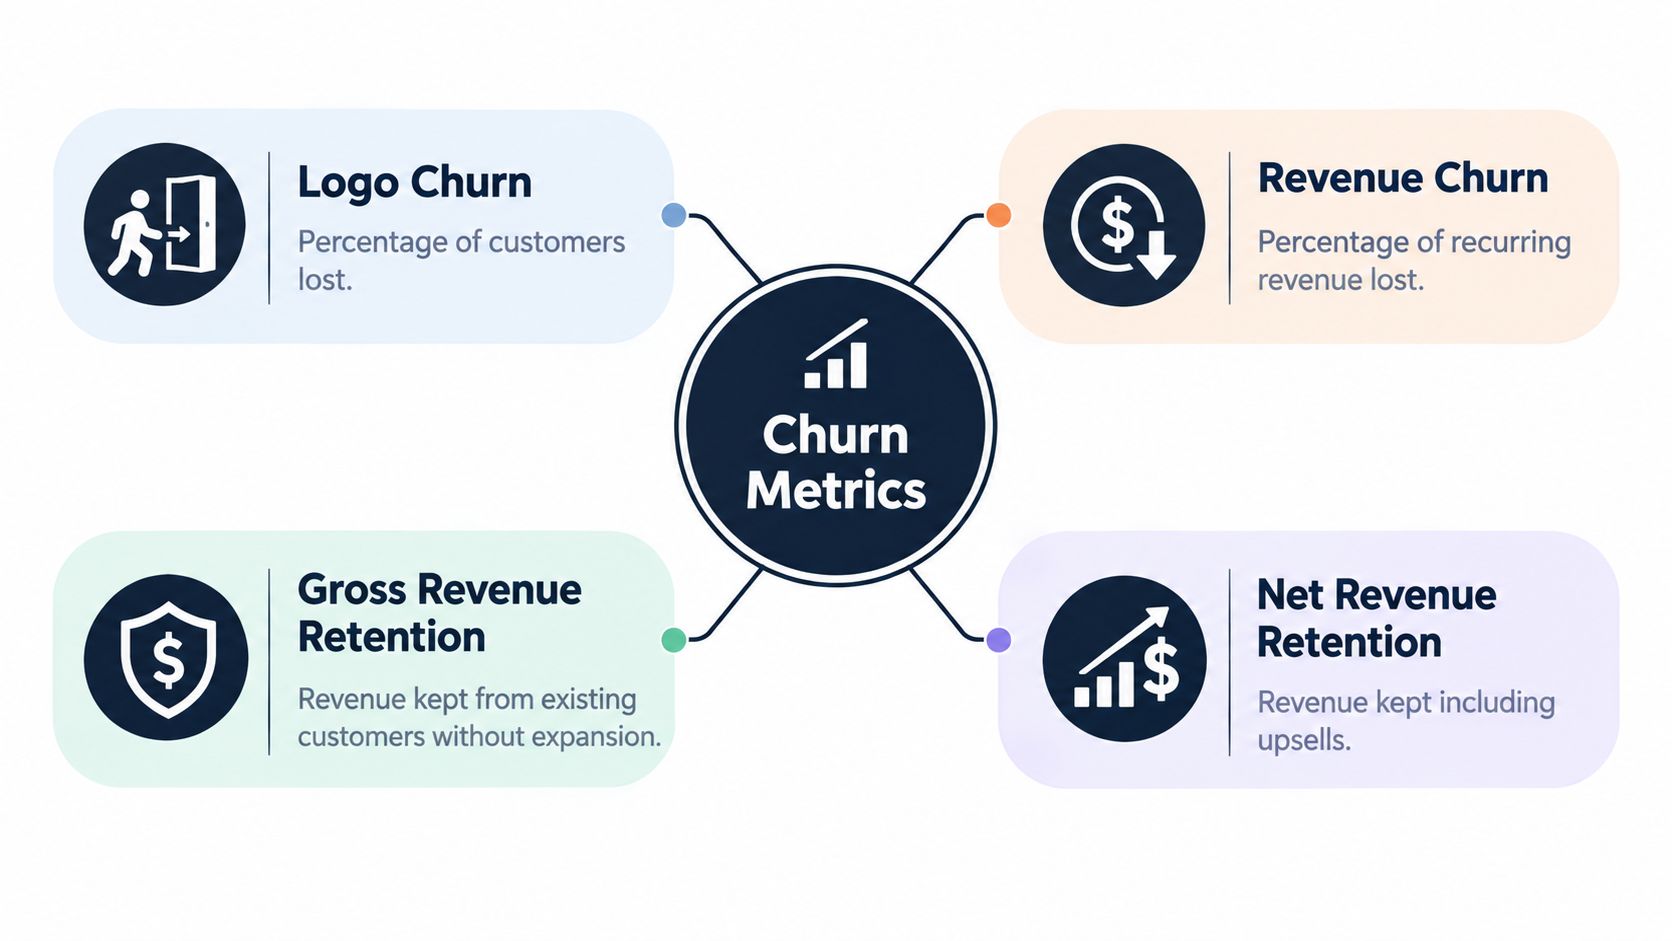
- Logo churn measures customers lost: customers lost during the period divided by customers at the start of the period.
- Revenue churn measures recurring revenue lost through cancellations, downgrades, or contractions, relative to starting recurring revenue.
- Gross revenue retention (GRR) measures how much starting recurring revenue remains after churn and contraction. It excludes expansion, so it can't exceed 100%.
- Net revenue retention (NRR) measures how much starting recurring revenue remains after churn and contraction, with expansion from retained customers included. It can exceed 100%.
The revenue reconciliation is:
GRR or NRR = (starting MRR − churn MRR − contraction MRR + expansion MRR) ÷ starting MRR
For GRR, leave expansion out of the numerator. For NRR, include it. This reconciliation helps an executive see why the ending balance changed rather than trusting a single rate. A detailed reference for subscription and customer-support measures can help teams align their reporting vocabulary, but the report still needs to define its own calculations.
Reconcile the same period from start to finish
For a worked monthly example, use symbols rather than pretend portfolio data. Let starting MRR be S, churn MRR be C, contraction MRR be D, and expansion MRR be E. Ending MRR is S − C − D + E. Revenue churn reflects the losses relative to S; GRR reflects what remains after C and D; NRR adds E back into the retained revenue calculation.
Then state the reporting rules beside the result. Define the denominator, observation window, cancellation effective date, treatment of pauses and failed payments, and whether new customers are excluded. A cancellation recorded in a different month from its effective date can move churn between reporting periods. A pause treated as churn in one report and as active in another makes comparisons unreliable.
Every headline should also show customer count, affected ARR or MRR, and a data-quality or confidence flag. Add the absolute revenue opportunity associated with an intervention where it can be estimated. The metric definitions and the bridge from starting to ending recurring revenue should be easy to audit, including the rows that don't reconcile cleanly.
Cohort Retention and Survival Analysis
A period churn rate combines customers with different histories. Some may have joined recently, some may be approaching renewal, and some may have been active for years. That makes a single period comparison hard to interpret, especially when annual contracts or mid-period entries affect how long each account has been observed.
A cohort retention curve follows a defined group, such as customers who signed up in the same month, across later periods. A cohort table makes it possible to compare groups at the same point in their lifecycle. Build views not only by signup month but also by segment, plan, geography, contract term, acquisition channel, and product adoption level. A cohort can look healthy in aggregate while a specific plan or acquisition channel struggles.
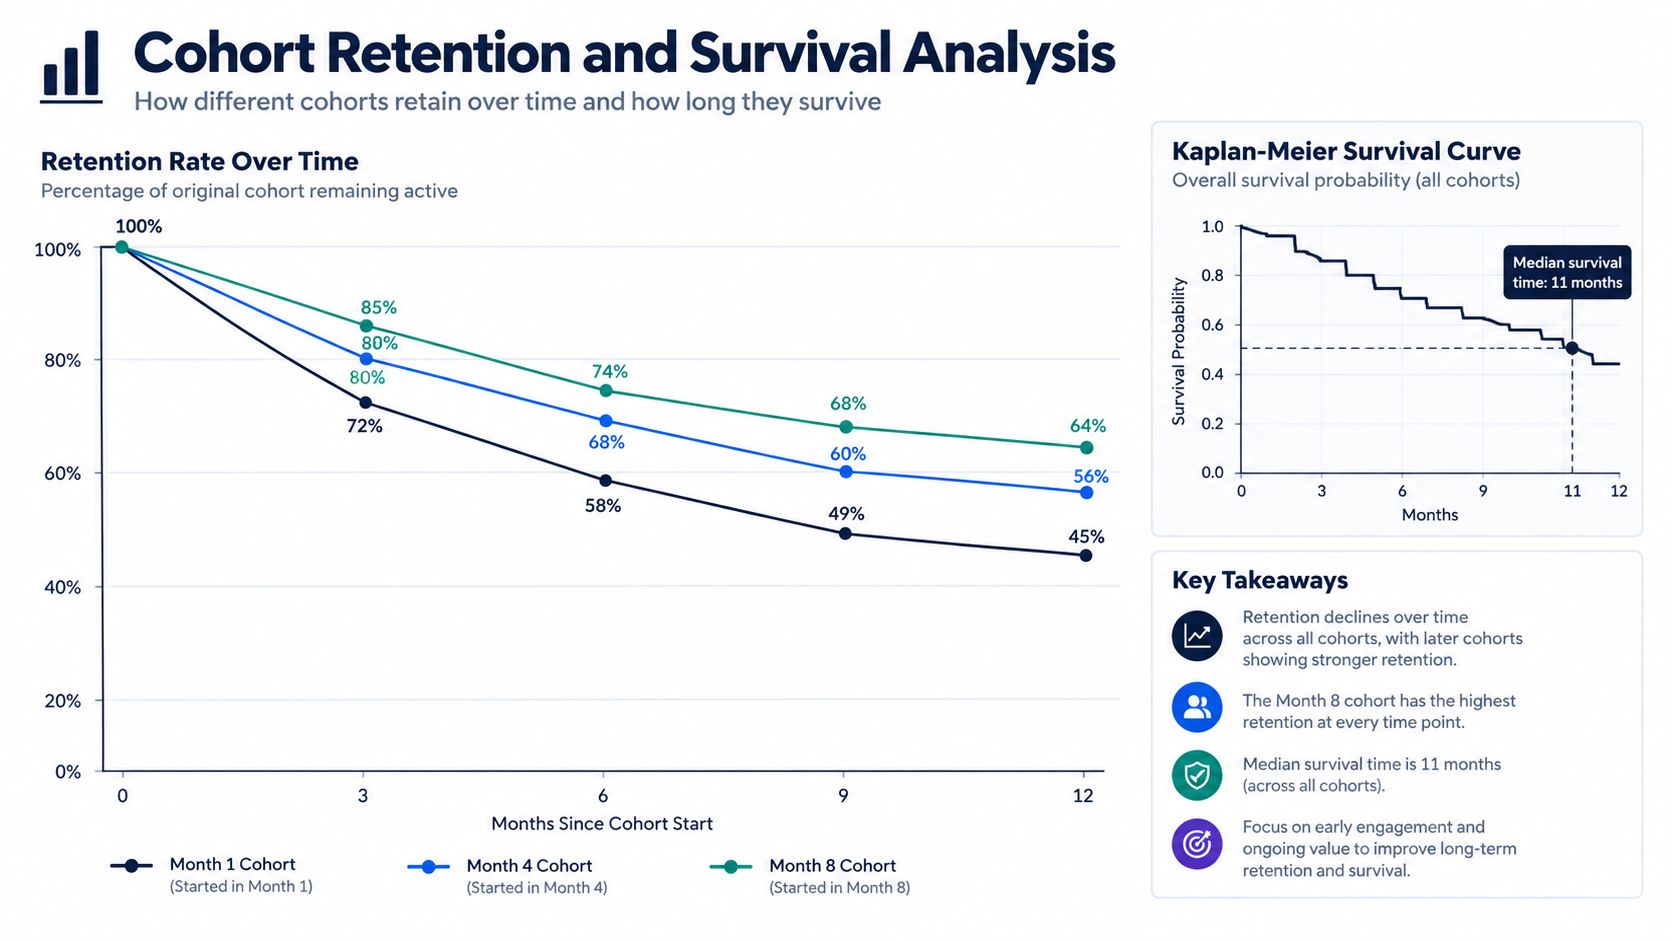
Survival analysis, including Kaplan–Meier estimates, handles unequal observation periods by estimating the probability that an account remains active over time. Accounts that haven't churned by the end of the observation window are censored: they're still active, but their eventual outcome isn't yet known. Treating them as churned would distort the analysis.
Hazard rates show how the risk of churn changes over time. Segment them by tenure, plan, contract length, usage intensity, support volume, unresolved defects, and feature adoption. If the analysis shows that risk clusters after onboarding rather than near renewal, the report should shift attention toward activation and early product value. Use cohort analysis to understand retention patterns to guide the structure of those comparisons.
A cohort chart is most useful when the team can connect its shape to a decision. A steep early decline might warrant an onboarding investigation; a change around renewal might call for a closer look at renewal readiness. Those are hypotheses to test against account histories, not causes to assume from the curve alone.
Why a Single Churn Number Misleads
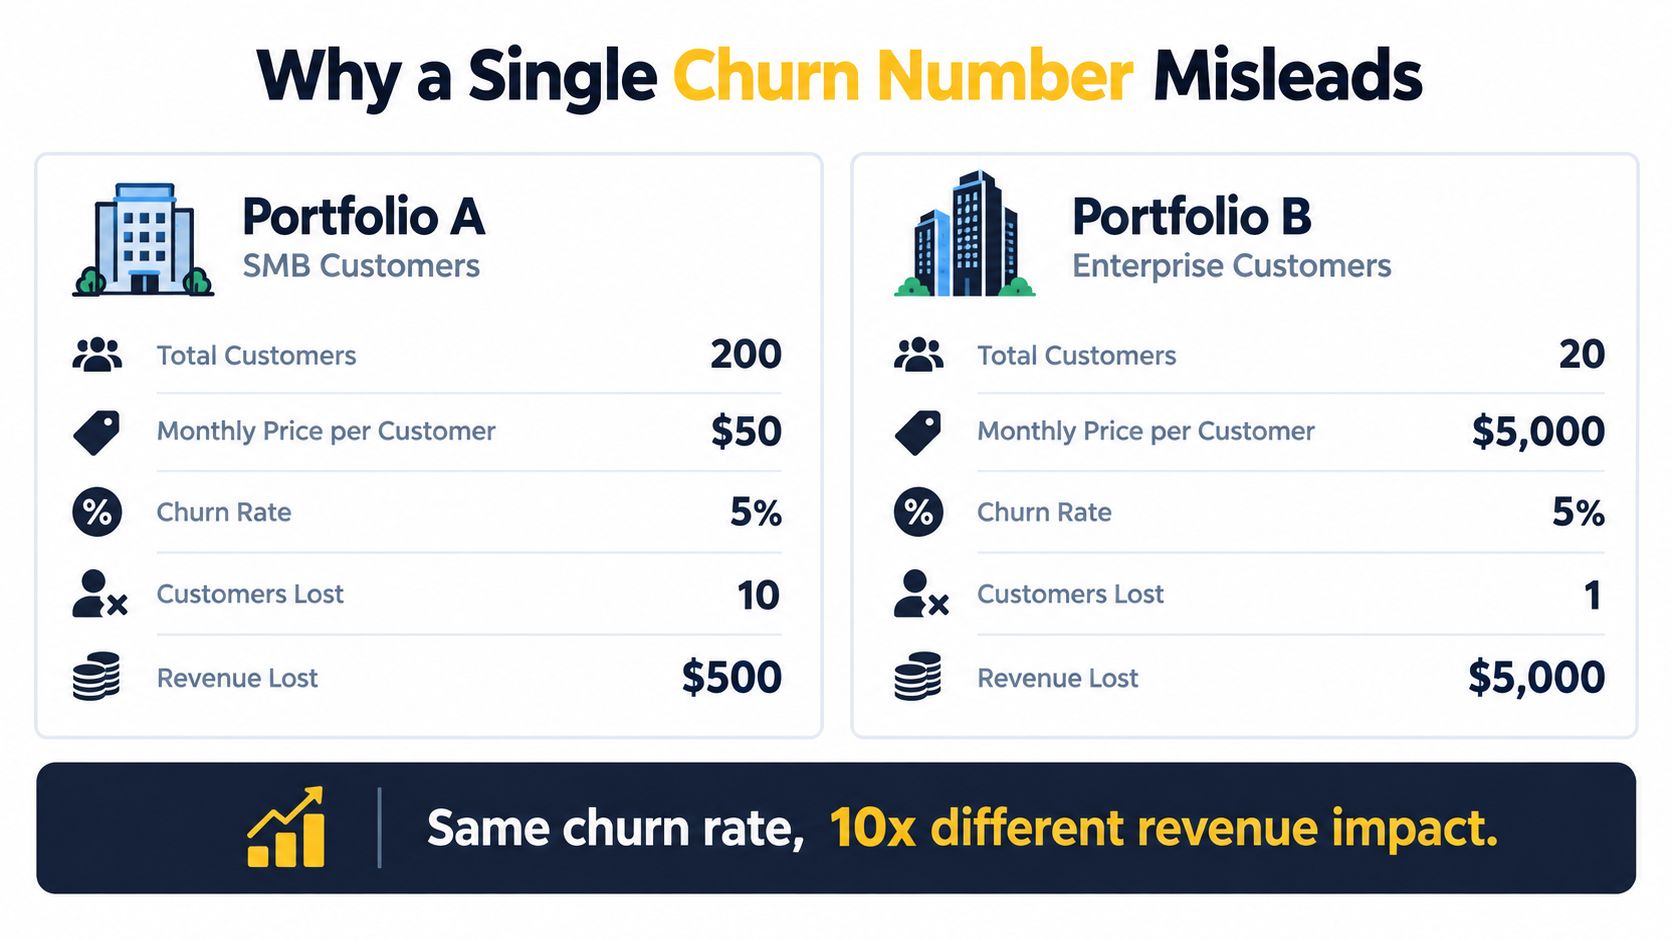
Two portfolios can post the same logo churn and face very different business problems. In one, many small accounts leave while retained enterprise customers expand. In the other, most customers stay, but a small number of large accounts cancel or contract. The headline rate can't tell leadership which portfolio has the more serious revenue exposure.
The difference is why a revenue bridge belongs beside the customer count. The first portfolio may have a high logo churn rate and still retain or grow recurring revenue. The second may have low logo churn but weak NRR because cancellations and downgrades outweigh expansion. These aren't interchangeable outcomes, and they don't call for the same intervention.
A benchmark can offer context, but it can't replace portfolio analysis. Stripe cites approximately 3%–7% monthly churn as an SMB SaaS range, while noting that definitions and customer mix vary materially (Stripe's discussion of retention and churn). Treat that as a directional comparison, not a universal target. A company with annual contracts or a different customer mix shouldn't treat a monthly SMB range as its operating standard.
Before leaders act on any headline churn number, put these beside it:
- Customer losses and revenue losses, so the report shows whether the same accounts drive both.
- GRR and NRR, to distinguish retained starting revenue from retained revenue plus expansion.
- Renewal size, contribution margin, and expansion potential, to clarify the economics of intervention.
- Concentration exposure, so a small set of large accounts doesn't disappear inside a broad average.
The Eight-Section Churn Analysis Report Template
A reliable report gives each section one job. Executives need the decision summary; analysts need the calculation details; customer success, product, and finance need evidence they can act on.
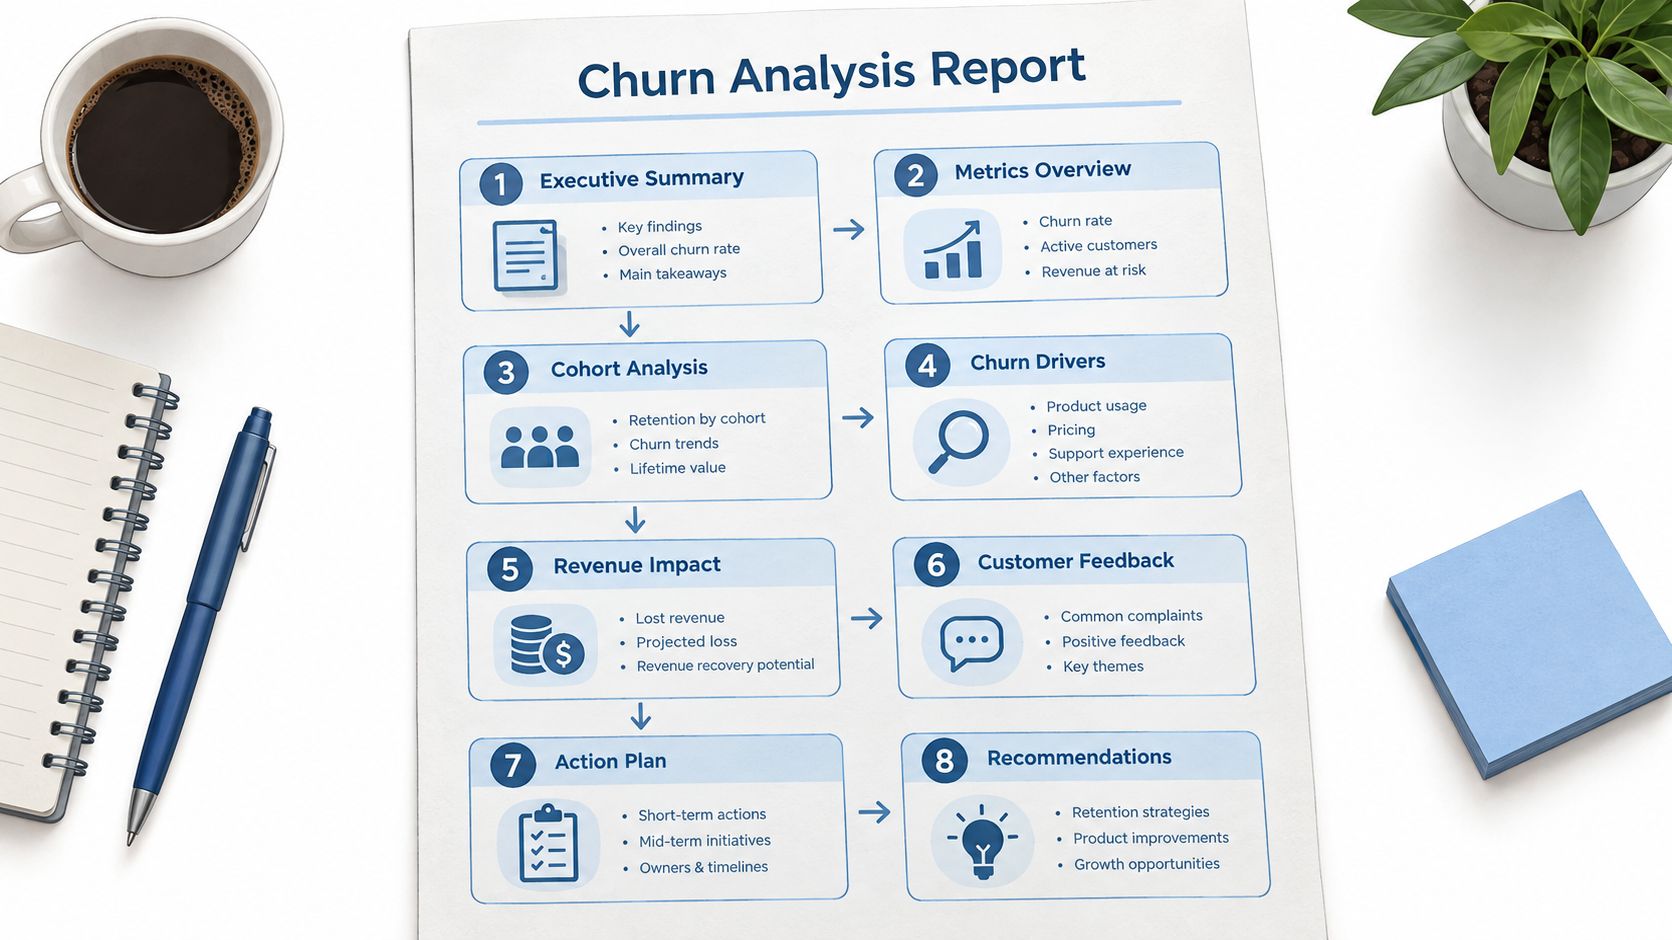
- Executive summary. For leadership: state the retention change, revenue exposure, and decision required.
- Metric reconciliation. For finance and analytics: show how starting revenue became ending revenue, and settle the definitions behind each rate.
- Cohort and segment view. For product and customer success: identify where retention differs and which group deserves investigation.
- Voluntary versus involuntary split. For revenue operations and billing: distinguish customer decisions from payment-related loss, since the fixes differ.
- Leading indicators and risk output. For customer-facing teams: show which accounts appear at risk and what evidence supports each flag.
- Causal evidence. For product and success leaders: connect event timing, customer feedback, and account outcomes without confusing correlation with cause.
- Recommended actions. For named owners: specify the target segment, opportunity, intervention, and success measure.
- Appendix and data-quality notes. For analysts and reviewers: document definitions, exclusions, unresolved discrepancies, and limitations.
Keep the executive summary short enough to use in the meeting, but don't hide the reconciliation or caveats in an appendix when they change the conclusion. The template is a decision sequence: establish what happened, show where it happened, explain what the evidence can support, then assign the next move.
Data Sources and How to Wire Them Together
Billing and subscription records anchor revenue churn, GRR, NRR, and the revenue bridge. Product analytics adds usage and feature-adoption context for cohort and risk views. Support tickets and chat transcripts can reveal friction or recurring defects, while CRM data supplies renewal status, account ownership, and expansion context. Exit feedback and customer conversations help investigate why an account left, but they should be interpreted alongside observed behavior and contract events.
The join that often breaks first is identity resolution. Billing may store a company account, product analytics may identify individual users, support may attach conversations to contacts, and CRM may contain a parent account with multiple subscriptions. If those entities aren't mapped consistently, an apparent decline in product usage may reflect only incomplete user-to-account matching.
Document the decisions that affect the results: how pauses and refunds are treated, whether taxes are included in revenue, how currencies are converted, and which timestamp determines cancellation. Put unresolved mapping issues in the appendix rather than treating incomplete records as complete.
A clean chart built on a broken account join is still a broken analysis.
The report should make its data lineage reviewable. Analysts need to know which systems feed each metric and which records were excluded; leaders need to see whether those exclusions could change the recommended action.
Visualizations That Make the Report Readable
Choose each visual to answer a specific question. For the executive summary, use an NRR bridge that starts with recurring revenue and separates churn, contraction, and expansion. Label the absolute impact of each movement so leaders can see what changed without reverse-engineering the chart.
For retention over time, use a cohort heatmap when readers need to compare many signup groups across lifecycle periods. Use a line chart when the shape of one or a few cohorts matters more than scanning a grid. A Kaplan–Meier curve belongs where different observation times or censored accounts affect the interpretation.
For churn mix, a stacked bar can separate voluntary from involuntary loss and compare segments side by side. For leading indicators, use a feature-by-segment table or dashboard that shows the signal, affected accounts, associated recurring revenue, and what a team can do about it. For recommendations, rank actions by absolute revenue opportunity and show the owner and intervention window.
Pie charts rarely help with churn decisions. They emphasize shares of a whole, but don't show timing, account value, or the difference between contraction and cancellation. Add affected ARR or MRR and a clear period to each visual, and annotate the intervention window where the team can use one.
Evaluating the Churn Risk Model
Accuracy can look reassuring while concealing a model that doesn't help a retention team choose accounts. If most customers don't churn in a given evaluation set, a model can appear accurate by predicting that nobody will leave. That result doesn't tell a team whether its risk-ranked list is useful or whether an intervention saves revenue.
Report precision and recall to show the quality and coverage of churn flags. Include calibration, so predicted probabilities can be compared with observed outcomes, and lift versus random targeting, so teams can judge whether the model improves prioritization. Most important for an operating decision, connect model performance to expected revenue saved, accounting for whether an intervention can plausibly change the outcome.
Keep model evaluation time-separated: train on earlier periods and test on later ones. Otherwise, the model may learn signals recorded after churn, such as cancellation activity or a final support escalation, and appear more predictive than it would be in live use. Model validation techniques can help teams examine those evaluation choices.
Rank accounts by expected loss: predicted churn probability multiplied by recurring revenue and intervention-adjusted recoverability. This prioritizes accounts that represent meaningful exposure and may still be saveable. A high risk score alone isn't an action plan; the report should show why the account is flagged and which team can intervene.
From Correlation to Causation in Churn Analysis
A customer's usage might decline before cancellation, but that doesn't establish that low usage caused the departure. The decline could be a symptom of an unresolved product problem, a changing use case, a budget constraint, or a decision already made. Acting on the symptom without checking the sequence can waste retention effort.
Build an event timeline for each segment under investigation. Put usage changes, feature adoption, support conversations, product incidents, pricing events, renewal discussions, and cancellation dates in order. Separate voluntary cancellation from failed payment, and distinguish temporary usage decline from a formal cancellation. Then ask whether the proposed cause appears before the outcome, and whether it occurs more often among comparable accounts that churn than among those that remain.
AI-native products make that distinction especially important. One analysis of 3,500 software-company websites reported 40% median GRR for AI-native products, compared with 82% median NRR for B2B SaaS, and found sharp variation by price point (ChartMogul's analysis of AI-native retention). Those measures aren't directly comparable: GRR excludes expansion, while NRR includes it. The contrast is a warning against treating adoption of AI as proof of customer stickiness or comparing unlike metrics as if they were the same.
Test candidate explanations within comparable cohorts and check whether a signal precedes churn rather than appearing only after the customer has decided to leave. Understanding correlation analysis is useful when teams need to separate an observed association from a defensible causal explanation.
Action-Driven Recommendations and Feedback Loops
A finding becomes useful when it leads to a decision someone can carry out and review. “Improve onboarding” is too broad. A stronger recommendation identifies the affected segment, the evidence behind the concern, the customer-facing or product change, and the revenue opportunity attached to addressing it.
Write each action so the owner can tell what success means:
- Target: Which cohort, plan, or account type should receive the intervention?
- Evidence: What observed behavior or customer feedback supports the action?
- Opportunity: What absolute ARR or MRR could the intervention protect or recover?
- Owner and timing: Who will act, and when should the team review progress?
- Outcome measure: Which retention or expansion metric will show whether the action helped?
Estimate expected churn reduction or NRR lift only when the team has evidence to support the estimate; otherwise state the opportunity qualitatively and make the uncertainty explicit. Where possible, compare an intervention group with a suitable holdout or use an A/B test. If that isn't practical, document the limitation and look for a credible comparison rather than claiming the change caused every improvement that followed.
Set a review point before launching. Expand an intervention when the outcome and evidence justify more investment; revise or stop it when the intended segment doesn't respond. That feedback loop turns the next churn analysis into an evaluation of prior decisions, not another disconnected set of charts.
Quick-Reference Card for the Churn Analysis Report
Keep these definitions beside the report so teams don't silently swap formulas or populations:
- Logo churn: customers lost ÷ customers at the start of the period.
- Revenue churn: recurring revenue lost through cancellation, downgrade, or contraction ÷ starting recurring revenue.
- GRR: starting recurring revenue less churn and contraction, divided by starting recurring revenue; excludes expansion.
- NRR: starting recurring revenue less churn and contraction plus expansion, divided by starting recurring revenue.
- Revenue reconciliation: starting MRR − churn MRR − contraction MRR + expansion MRR = ending MRR.
Include a customer- and revenue-weighted view, cohort retention, segment comparisons, voluntary versus involuntary churn, risk-ranked accounts, and an action list. Label the denominator, observation window, exclusions, and data-quality caveats. The table below is the minimum set that turns those definitions into decisions.
| Table | What it proves | Action-driving column |
|---|---|---|
| Revenue reconciliation | How starting MRR became ending MRR | Absolute churn, contraction, and expansion impact |
| Cohort and segment retention | Where retention differs across customer groups | Segment owner and intervention window |
| Voluntary versus involuntary churn | Whether losses reflect cancellation or payment failure | Recovery or retention action |
| Risk-ranked accounts | Which accounts represent potential exposure | Expected loss and recoverability |
| Recommended actions | What the team will change and evaluate | Owner, opportunity, and outcome measure |
Prepare your next churn review around the accounts and revenue behind the headline rate, then assign an owner to the most actionable finding. SigOS helps product and growth teams connect support feedback, sales conversations, and usage patterns with churn-related signals and revenue context. Use it to surface customer issues worth investigating and turn the evidence into a prioritized follow-up.
Keep Reading
More insights from our blog



Ready to find your hidden revenue leaks?
Start analyzing your customer feedback and discover insights that drive revenue.
Start Free Trial →