Business Impact Metrics: Drive SaaS Revenue & Reduce Churn
Stop guessing. Select, calculate, and report on business impact metrics. Drive churn reduction and revenue growth for SaaS teams.

Your backlog probably looks familiar.
Support says a bug is hurting renewals. Sales says three feature requests are blocking deals. Customer success wants a workflow fix for one strategic account. Engineering wants time for reliability work. Leadership asks for a clean explanation of what matters most, and too often the answer is a mix of ticket counts, opinions, and whoever argued best in the last meeting.
That's where many teams get stuck. They have data, but not decision-quality data. They can tell you how many tickets came in, how many users touched a feature, or how many story points a team closed. They can't tell you which issue is likely to hurt expansion, which friction point is tied to downgrade behavior, or which feedback theme deserves immediate investment because it has direct revenue consequences.
The shift is simple to describe and hard to operationalize. Stop asking, “How loud is this problem?” Start asking, “What is this problem worth?”
That's what business impact metrics do. They tie product work to business outcomes that finance, leadership, and go-to-market teams already care about: churn, expansion, conversion, retention, and revenue at risk. They replace vanity metrics with prioritization logic.
From Gut Feel to Revenue-Driven Why You Need Business Impact Metrics
Most SaaS teams don't suffer from a lack of metrics. They suffer from too many disconnected ones.
A dashboard says adoption is up. Support volume is flat. NPS comments are mixed. A large customer is unhappy. Sales wants roadmap commitments. Product analytics shows feature usage, but not whether the right users are succeeding or whether failures in a core workflow are creating downstream churn risk. None of that gives you a confident answer to a simple executive question: what should we fix first?
What vanity metrics miss
Vanity metrics are attractive because they're easy to collect and easy to present. Ticket counts, page views, feature clicks, backlog size, release velocity, and raw satisfaction scores all have some value. The problem is that on their own, they don't tell you what the business stands to lose or gain.
A spike in support tickets may signal a serious product problem, or it may reflect a temporary onboarding issue for low-value accounts. A frequently requested feature may matter a lot, or it may come from a vocal segment that rarely expands. A drop in usage may be harmless in one area and dangerous in another.
Business impact metrics answer the question behind the metric. They connect an event, issue, or behavior to an economic outcome.
Practical rule: If a metric can't help you defend a roadmap decision to a CFO, it probably isn't enough on its own.
That's why the move away from ad hoc reporting matters. A McKinsey survey on data-driven enterprises found that companies that consistently monitored a small set of outcome-oriented metrics such as revenue growth and customer churn were about 2.1 times more likely to report above-average profitability.
What changes when teams track outcomes
Once teams start organizing around impact, prioritization meetings get less political.
Instead of debating whether thirty tickets are “a lot,” you ask which accounts submitted them, whether those accounts are up for renewal, whether the issue affects a critical workflow, and whether the affected cohort shows signs of downgrade or expansion loss. The conversation moves from noise to exposure.
A useful way to think about it is this:
- Vanity metrics describe activity
- Operational metrics describe process
- Business impact metrics describe consequence
That last category is what makes product work legible across the company. It's also what turns customer feedback from anecdote into evidence.
If your team is still reporting effort without business consequence, start by tightening your metrics and reporting practices. You don't need more dashboards. You need fewer metrics with sharper meaning.
A Framework for Connecting Product Work to Revenue
The strongest product organizations don't build a giant scorecard full of unrelated KPIs. They use a small framework that forces every initiative to answer the same question: how does this connect to revenue quality?
That framework usually has three working parts. Revenue impact. Churn risk. Engagement-to-revenue mapping. If one of those is missing, teams drift back toward feature factories and ticket triage.
Revenue impact
Start with the direct financial question. If this issue disappeared, or if this feature shipped well, where would the business see the effect?
For a self-serve SaaS product, that might mean trial-to-paid conversion, upgrade adoption, or reduced refund and downgrade behavior. For an enterprise motion, it often means blocked deals, renewal friction, delayed expansion, or lower seat growth inside existing accounts.
Often, many teams overcomplicate things. They try to model every variable at once. In practice, a good revenue impact view can begin with a short list:
- Revenue at risk from unresolved issues
- Expansion opportunity linked to requested capabilities
- Conversion impact from friction in key journeys
- Account value exposure by segment or tier
If you're evaluating whether an initiative is worth the engineering cost, a structured ROI model helps. I like the framing in Matil's ROI calculation guide because it pushes teams to define benefits, costs, and assumptions clearly instead of hand-waving them.
Churn risk
This pillar is where product teams often underinvest. They know churn matters, but they don't connect it to product behavior early enough.
In subscription businesses, that's a costly blind spot. The CLV:CAC ratio has become a foundational SaaS metric, and a healthy benchmark is often described as at least 3:1 in the For Entrepreneurs guide to SaaS metrics. That rule of thumb matters because churn and expansion aren't just customer success concerns. They shape capital efficiency.
When I review roadmap items, I want to know whether a problem is merely annoying or whether it threatens the economics of acquiring and keeping customers. Those are different categories of work.
A bug in a non-core workflow is an inconvenience. A bug that breaks habit formation in the first month is a retention problem.
Engagement-to-revenue mapping
Engagement is useful only when it's tied to value creation. “Users clicked this feature” doesn't help much. “Accounts that complete this workflow renew cleanly and expand later” is a very different signal.
That mapping requires discipline. Teams need to define which user actions represent successful value realization, then trace those actions upward into business metrics and roadmap investments. If you need a strong planning structure for that translation layer, this product roadmap development guide is a practical reference.
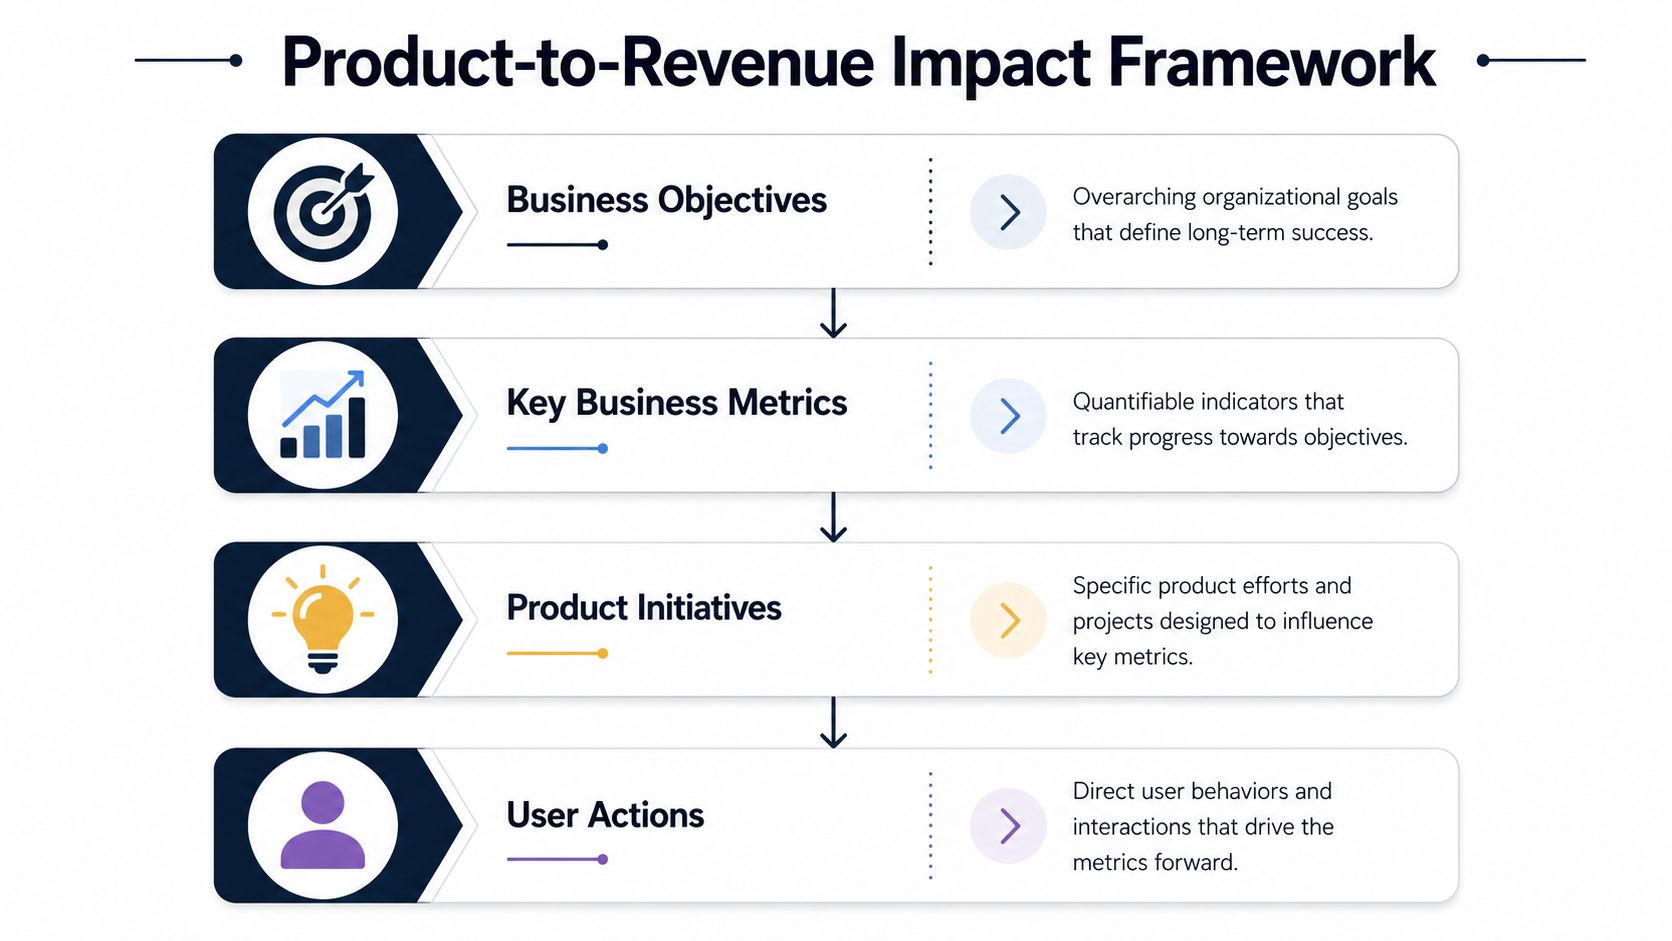
A simple way to frame the model is below.
| Layer | What to ask | Example output |
|---|---|---|
| Business objective | What commercial outcome matters most? | Retention, expansion, conversion quality |
| Key metric | How will we know movement happened? | Churn, upgrade behavior, revenue at risk |
| Product initiative | What are we changing? | Fix a workflow bug, improve onboarding, ship capability |
| User action | What behavior should change? | Complete setup, adopt feature, finish core task |
Teams that skip the bottom row struggle. Without a defined user behavior change, “impact” stays abstract.
How to Calculate the Dollar Value of Customer Feedback
Customer feedback becomes useful for prioritization when it stops living as isolated text. The job is to turn comments, tickets, call notes, and chat transcripts into signals with economic meaning.
That doesn't mean pretending every complaint has a perfect revenue model behind it. It means using a consistent method so that “annoying bug” becomes “likely retention risk in a high-value workflow” or “frequent request from expansion-prone accounts.”
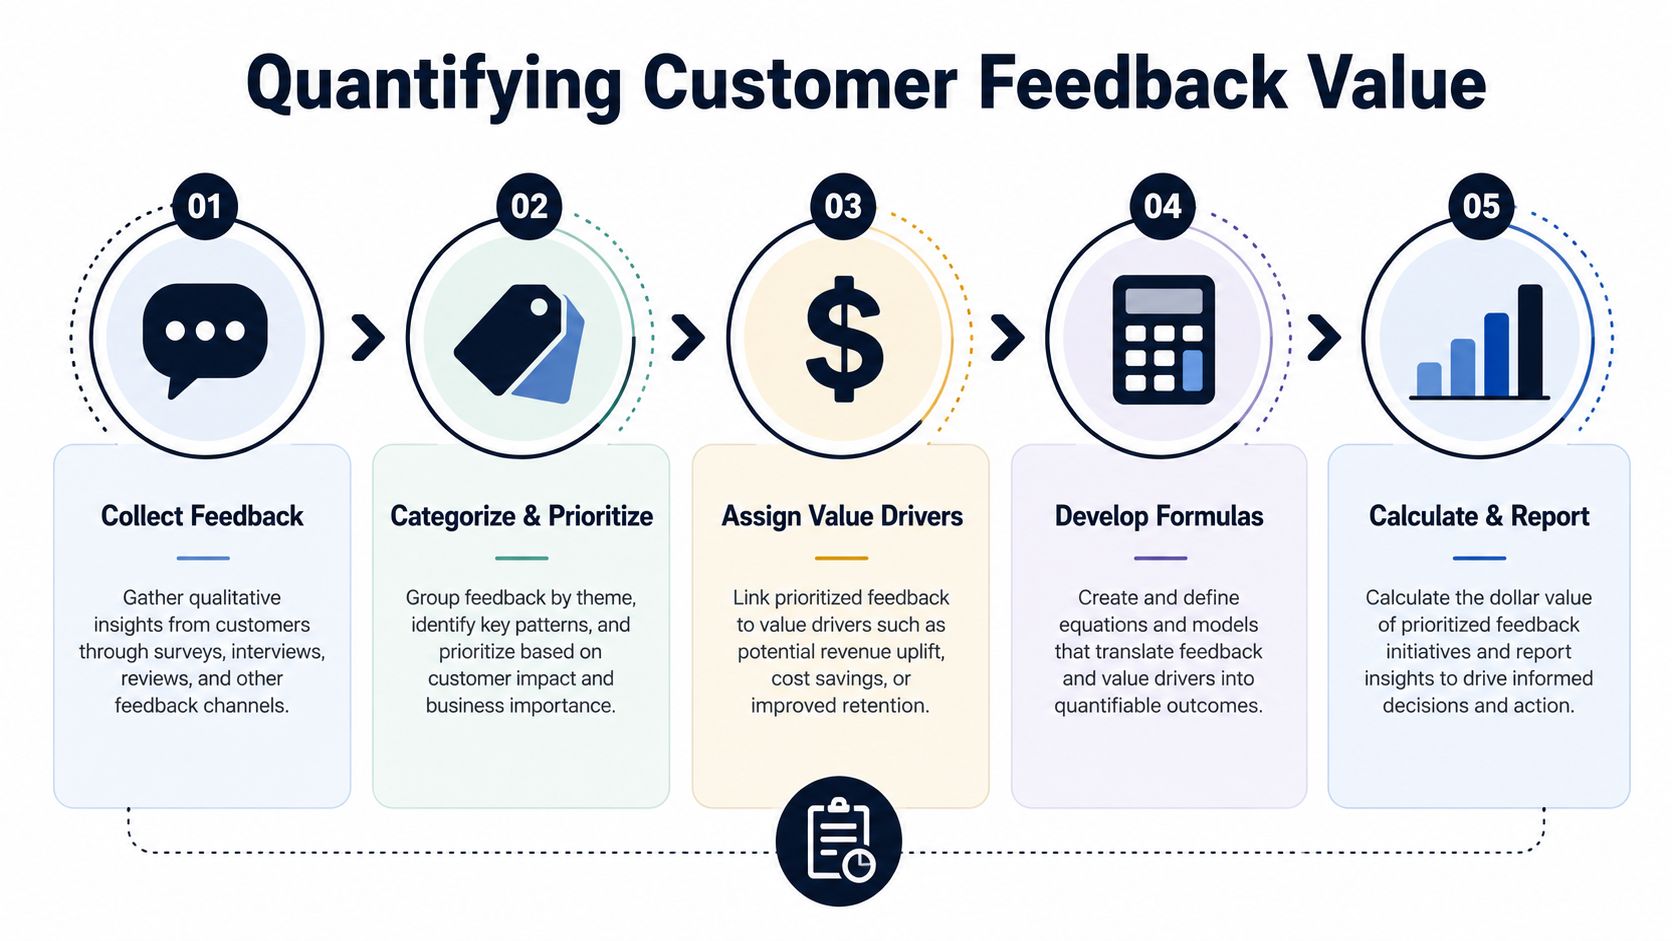
Step one is grouping feedback by issue, not by channel
Organizations often look at Zendesk in one place, Gong call notes in another, Jira in another, and product analytics somewhere else. That structure mirrors systems, not customer problems.
You need to normalize feedback into recurring themes such as:
- Critical workflow failures
- Missing capabilities tied to sales objections
- Usability friction in onboarding
- Performance or reliability complaints
- Reporting gaps for admin users
Once feedback is grouped, enrich each theme with account context. Which segment is affected? Are these new customers, renewal-stage customers, or accounts with expansion history? Is the issue tied to a core workflow or an edge case?
A theme with fewer mentions can deserve higher priority if it affects larger contracts or more expansion-ready accounts.
Step two is attaching value drivers
Every feedback theme should be mapped to one primary business effect.
Some examples:
| Feedback pattern | Likely value driver |
|---|---|
| Repeated complaints about setup complexity | Slower activation, lower conversion quality |
| Tickets about broken core workflow | Churn risk, downgrade risk |
| Sales call objections around a missing integration | Deal risk, delayed expansion |
| Complaints from admins about reporting limits | Renewal friction, seat growth limits |
Teams often get stuck here because they want precision before they act. Don't. Start with directional logic, then refine.
If a workflow is mission-critical and failure appears repeatedly in support and usage drop-off, treat it as retention-sensitive. If requests come from accounts already growing or from late-stage opportunities, treat them as expansion-sensitive.
Step three is using practical formulas
You don't need advanced econometrics to get started. You need a consistent score that combines frequency, customer value, and likely commercial effect.
A simple internal model can look like this:
- Issue frequency scoreHow often does the theme appear across support, calls, chats, and feedback forms?
- Account value scoreAre the affected customers low-touch self-serve users, mid-market accounts, or strategic enterprise customers?
- Workflow criticality scoreDoes the issue affect a nice-to-have feature or a core task tied to adoption and renewal?
- Business effect categoryIs the likely consequence churn, downgrade, expansion loss, conversion friction, or sales-cycle drag?
- Confidence scoreHow strong is the evidence from usage data, account history, and recurring feedback?
Don't force fake precision. A useful directional score beats a “scientific” model built on weak inputs.
The strongest evidence comes when feedback patterns align with observed outcomes. The NetSuite discussion of business metrics notes that leading SaaS vendors found unresolved high-frequency issues in critical workflows correlated with 2.3× higher churn risk in the following quarter and a 15 to 23 percent reduction in expansion revenue per affected cohort.
That's the bridge many teams miss. Support patterns are not just service signals. In the right workflow, they're commercial risk indicators.
Later in the process, a deeper analysis workflow helps teams operationalize this consistently. A practical starting point is to standardize how you analyze customer feedback so product, support, and growth classify issues the same way.
Here's a useful walkthrough for teams that want to think more concretely about the mechanics of tying signals to business value:
A real prioritization example
Take a recurring complaint in a billing or checkout flow.
Support hears that users can't complete a key task reliably. Sales reports prospects asking whether the workflow is dependable. Product analytics shows abandonment after the same step. Customer success flags frustration from accounts approaching renewal.
A weak product process labels this “checkout bug” and puts it in the backlog.
A better process asks:
- Who is affected? New buyers, existing admins, high-value accounts, or low-value edge cases?
- Where does it occur? A peripheral feature or a workflow that determines activation and habit formation?
- What happens next? Do affected accounts abandon the task, submit repeat tickets, stop using adjacent features, or delay expansion?
- What commercial event is nearby? Trial conversion, renewal, upsell conversation, procurement review?
That combination gives you a prioritization case leadership can understand. Not because you guessed a dramatic dollar amount, but because you connected qualitative pain to observable revenue pathways.
Building Your Business Impact Reporting Dashboard
Once the team agrees on what matters, the next failure mode is operational. The logic stays in spreadsheets, PM notes, and one-off Slack threads. Two months later, the old habits return.
A working dashboard fixes that, but only if it pulls from systems that reflect the customer journey end to end.
What data has to be connected
Most business impact reporting in SaaS requires inputs from at least four categories of systems:
- CRM and billing systems such as Salesforce or HubSpot, where account stage, contract value, renewal timing, and expansion history live
- Support platforms such as Zendesk or Intercom, where customers describe pain in their own words
- Product analytics tools such as Amplitude or Mixpanel, where drop-off, abandonment, and successful completion patterns show up
- Engineering trackers such as Jira, Linear, or GitHub, where ownership and delivery status are visible
The dashboard shouldn't mirror org charts. It should mirror decisions. That means a product leader should be able to see one issue theme, the accounts tied to it, the affected behavior, the likely business consequence, and current remediation status in one place.
What the dashboard should show
A dashboard built for action usually has a short set of views, not dozens.
I'd include these:
- Top revenue-risk issues ranked by affected accounts, workflow criticality, and commercial exposure
- Expansion blockers showing recurring requests from high-potential or late-stage accounts
- Emerging churn themes where support, usage, and account health signals line up
- Time-to-resolution by business severity so engineering effort reflects business stakes
- Closed-loop outcomes showing whether a resolved issue changed the customer behavior you expected
Teams often overload the page with raw operational stats. Resist that. Ticket volume and cycle time matter, but only in context.
If a dashboard can't tell you what deserves an executive escalation this week, it's a reporting tool, not a decision tool.
Instrumentation trade-offs that matter
Not every team can build a perfect model immediately. That's fine. But a few choices matter early.
First, define a shared issue taxonomy. If support calls something “sync bug,” product labels it “data import error,” and engineering logs it as “queue timeout,” your reporting won't hold.
Second, preserve customer language alongside internal labels. The commercial value often sits in how customers frame the pain, especially in renewal calls and sales objections.
Third, include operational health where performance problems are part of the product experience. For teams trying to connect technical quality to business outcomes, resources like PageSpeed Plus for web vitals monitoring are useful because they show how to monitor experience-level degradation before it turns into a larger customer problem.
A strong dashboard doesn't just report the past. It shortens the path from customer signal to roadmap action.
From Data to Decisions Turning Metrics into Action
The hardest part isn't calculating business impact metrics. It's forcing the organization to use them when priorities collide.
Sales still wants speed. Engineering still wants stability. Product still has strategic bets that won't map cleanly to this quarter's revenue pressure. That tension doesn't go away. Better metrics just make the trade-offs explicit.
How good teams use the data
When business impact metrics are working, they change how weekly and monthly decisions get made.
Product review meetings stop revolving around loud anecdotes. Roadmap debates shift toward account exposure, workflow criticality, and commercial timing. Support and success teams gain a credible way to escalate recurring pain without relying on emotional urgency. Engineering gets a stronger case for reliability work when the affected workflows are tied to renewals or expansion.
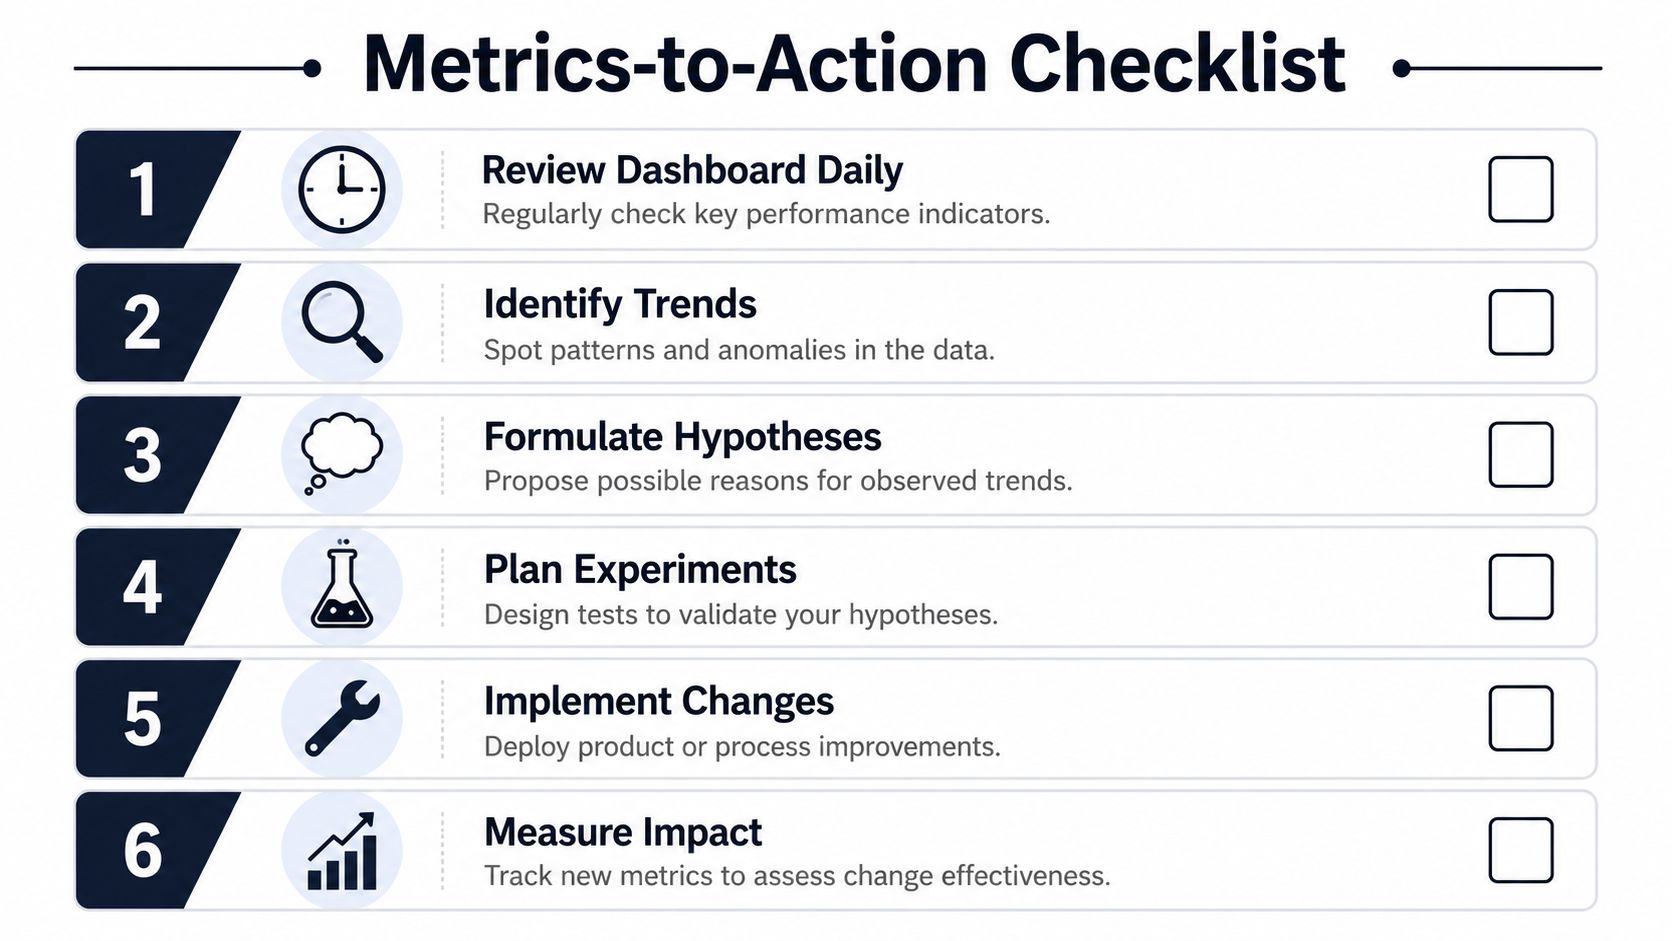
A simple operating checklist helps:
- Rank the top issues by business consequenceDon't start with ticket volume. Start with likely churn, expansion loss, or conversion friction.
- Review high-risk items with cross-functional ownersProduct, support, success, sales, and engineering should see the same issue list and the same evidence.
- Tie roadmap changes to expected business movementEvery major fix or feature should have a stated reason in business terms.
- Close the loop after deliveryCheck whether the customer behavior moved. If it didn't, improve the model.
Where targeted improvements pay off
The point of all this work is not prettier reporting. It's better intervention.
Research on customer experience ROI suggests that significant CX improvements can move revenue and customer satisfaction by 10 to 20 percent, but only when the changes are targeted based on measurable impact, as discussed in this customer impact measurement article. That matches what product leaders see in practice. Broad “improve the experience” programs rarely hold up. Focused fixes in the right journey often do.
If your leadership team needs help thinking about KPI design more broadly, this guide to data-driven business growth is a helpful companion. It's useful because it reinforces the core discipline: metrics matter only when they change decisions.
What to change first
If you're trying to shift culture, don't relaunch your entire planning process at once.
Start with one workflow that clearly matters to revenue. Activation, onboarding, checkout, billing, or a high-usage admin task are usually better candidates than niche features. Build one cross-functional score around that area. Review it weekly. Use it in roadmap decisions. Show the before-and-after reasoning.
Once the organization sees a bug move from “support noise” to “renewal protection,” adoption gets easier.
Frequently Asked Questions About Business Impact Metrics
What if we don't have clean data yet
Start with one feedback stream and one business outcome. Support tickets tied to renewal-stage accounts are often enough to begin. You don't need a perfect warehouse model to improve prioritization. You need a repeatable way to classify issues, identify affected accounts, and compare those patterns with observable customer behavior.
How do we use business impact metrics in a pre-revenue product
Use them as value-proxy metrics. In an early-stage product, that usually means activation, successful completion of a core workflow, repeat usage in the right cohort, and strong signals from design partners or pilot users. The principle stays the same. Track behaviors that indicate future commercial value, not just raw activity.
How do we get leadership buy-in
Don't pitch this as “better analytics.” Pitch it as better capital allocation.
Executives already understand churn, expansion, conversion, and retention. Frame the change around making roadmap trade-offs legible in those terms. One clear example beats a dense framework deck. Show how a recurring feedback theme affected an important workflow, which accounts were exposed, and what the team changed because of it.
The fastest way to earn buy-in is to reframe one backlog item in revenue terms and be right about why it mattered.
Should every initiative have a dollar figure
No. Some work is strategic, foundational, or risk-reducing in ways that aren't cleanly quantifiable upfront. The discipline is not “everything must have a precise number.” The discipline is “everything should have a clear business rationale.” Use direct economic estimates where you can. Use structured qualitative reasoning where you can't.
How often should we review these metrics
Often enough to influence decisions while there's still time to act. For most SaaS teams, that means a lightweight weekly review for emerging issues and a deeper monthly review tied to roadmap and revenue planning.
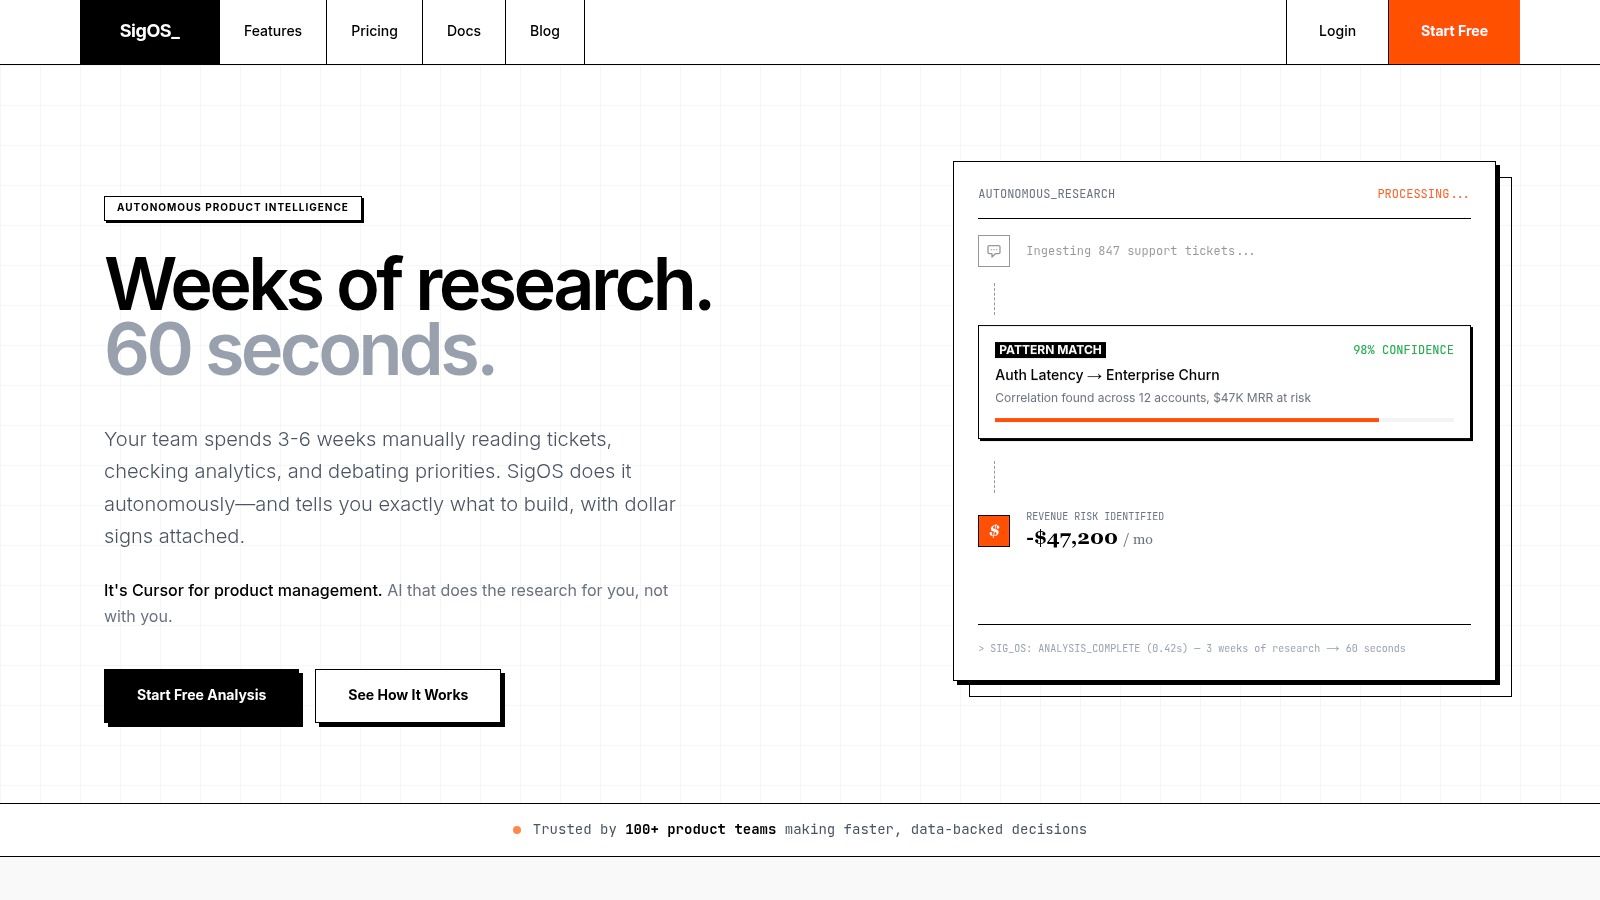
If your team is drowning in support tickets, call notes, feature requests, and conflicting roadmap opinions, SigOS helps turn that noise into prioritized business impact. It connects customer feedback with behavioral and revenue signals so product, support, and growth teams can see which issues are tied to churn risk, expansion opportunity, and real money.
Keep Reading
More insights from our blog


Ready to find your hidden revenue leaks?
Start analyzing your customer feedback and discover insights that drive revenue.
Start Free Trial →