Leading vs Lagging Indicators: A Guide for SaaS Teams
Understand the difference between leading vs lagging indicators to predict churn and drive growth. This guide gives SaaS examples and shows how to use them.
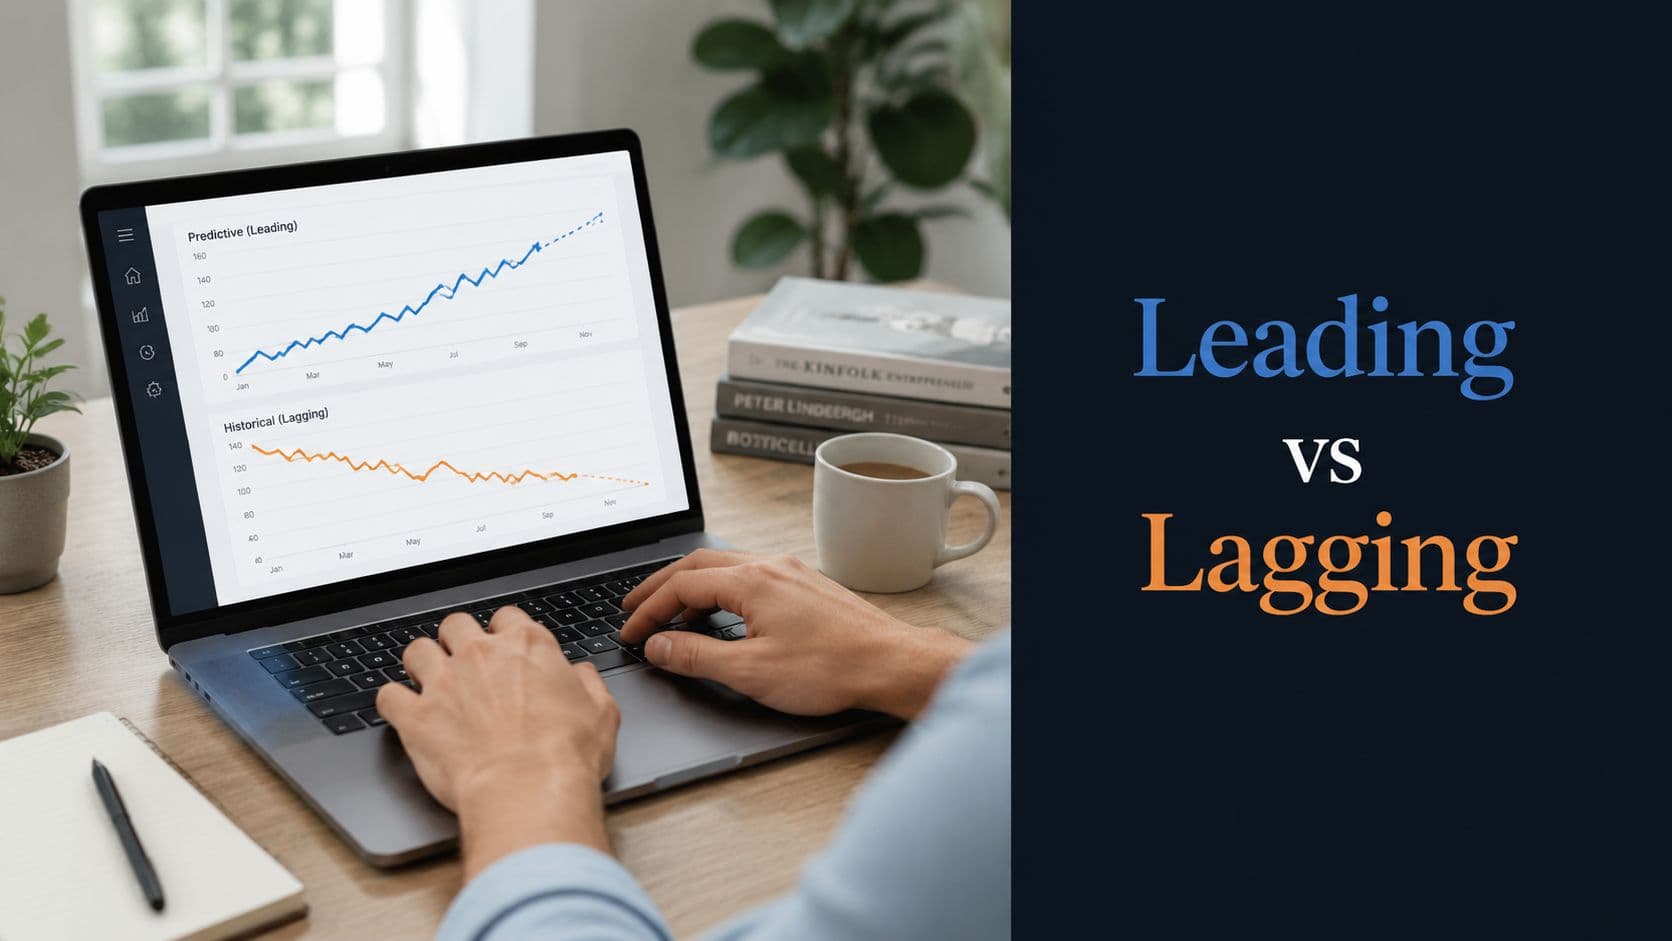
Your churn review is on the calendar. Revenue retention is down, support volume is up, and everyone in the room already knows the uncomfortable truth. The dashboard is accurate, but it's late.
That's the trap many SaaS teams fall into. They build reporting systems that are strong at documenting outcomes and weak at shaping them. Revenue, renewals, profit, retention, and churn all matter. But if those are the first metrics your team sees, you're managing the business after the result has already landed.
The core issue in leading vs lagging indicators isn't measurement. It's timing. And timing has a revenue cost. When teams optimize the wrong “early” metrics, they waste roadmap cycles, support effort, marketing spend, and executive attention on signals that don't move churn, expansion, or renewal outcomes.
Why Your KPIs Are Always a Step Behind
A familiar pattern shows up in product reviews.
A team launches a feature, adoption looks decent, and the weekly recap sounds positive. Then a quarter later, the retention cohort underperforms. Customer success starts surfacing the same complaints. Support leaders notice repeat ticket themes. Finance sees the effect in renewals. Suddenly everyone is trying to explain a number that was set in motion weeks earlier.
That's what lagging indicators do. They confirm reality, but they rarely give you enough time to change it.
The rear-view problem
When a SaaS team relies mostly on churn, renewal rate, expansion revenue, or profit, the business starts operating in rear-view mode. Those metrics are essential for board reporting and quarterly accountability, but they don't tell a PM what to fix on Tuesday morning.
A support leader sees the same problem. If the only service metric that matters is ticket backlog at month end, the team reacts after the customer experience has already deteriorated. By then, the damage isn't abstract. Accounts are frustrated, renewals are harder, and product credibility drops.
Teams usually don't have a data problem. They have an intervention problem. They see the outcome after the window to prevent it has closed.
What safety research gets right
One of the clearest lessons comes from workplace safety. A peer-reviewed study found that the number of accidents at work was used in almost 97% of surveyed companies, yet those common lagging measures didn't differ significantly between higher- and lower-performing firms, which suggests that measuring past outcomes alone isn't enough to improve future performance (peer-reviewed safety research).
That lesson maps directly to SaaS.
If your dashboard mostly tells you what already happened, you'll get better at reporting bad news, not preventing it. You'll know churn rose. You won't know early enough which behaviors, defects, onboarding gaps, or support patterns predicted it.
The revenue cost of delay
The financial implications become tangible. Misaligned teams often spend months optimizing a metric because it feels predictive. More feature clicks. More sessions. More article views. More trial signups.
But if those signals don't correlate with the lagging outcome you care about, the company pays twice. First in wasted effort. Then again when churn or stalled expansion shows up later.
That's why leading vs lagging indicators matters far beyond analytics hygiene. It's a capital allocation decision.
Understanding Leading and Lagging Indicators
The cleanest way to think about these metrics is simple.
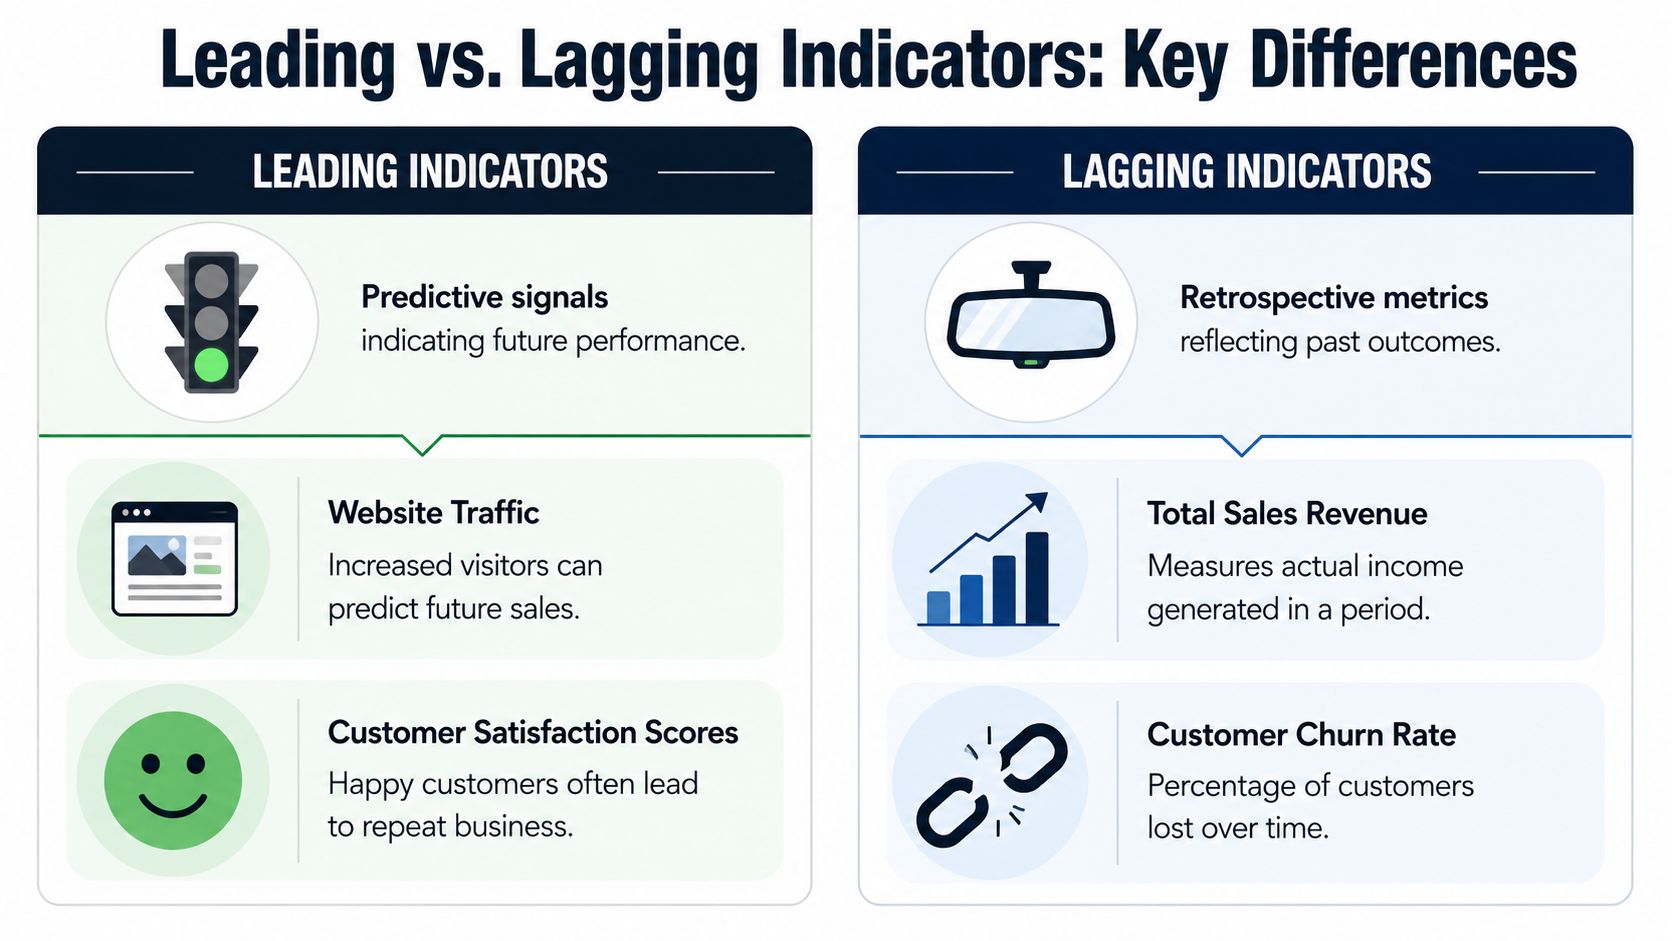
Leading indicators are signals you can influence now that may predict a later result. Lagging indicators are outcome measures that confirm what already happened.
A diet analogy works because it's concrete. Exercise frequency and food choices are leading indicators. The number on the scale is a lagging indicator. You can change today's workout. You can't instantly change next month's weight trend.
What each indicator type does well
Lagging indicators are the easier category to trust because they describe finished results. In SaaS, common examples include revenue, profit, subscription renewals, and retention rates, which makes them useful for final performance reporting but less useful for early intervention, as described in BMC's overview of leading and lagging metrics.
Leading indicators are more operational. They sit closer to day-to-day behavior. They might include activation milestones, repeat usage of a core workflow, successful onboarding completion, or the frequency of support contacts about one workflow. Those metrics matter because teams can act on them while there's still time to change the outcome.
A practical mental model
Use this split when you build dashboards:
- Lagging indicators answer outcome questions. Did we retain the account? Did revenue expand? Did churn increase?
- Leading indicators answer intervention questions. What should product, support, or growth do this week to change the likely outcome?
- Both are necessary. One tells you whether you won. The other tells you what to work on before the game ends.
For teams building OKRs, this is often the pitfall for many goal systems. They choose outcomes but never define the controllable inputs that should move them. If you want a practical framework, this guide on leading indicators for smarter OKRs is useful because it pushes teams to connect operational behavior to strategic goals.
Practical rule: If a team can't directly influence a metric during the current work cycle, it's probably not the right operating KPI for weekly management.
Why teams confuse the two
The confusion usually starts when a metric feels early but isn't predictive.
Session duration can look like a leading signal. So can article views, trial signups, or feature clicks. But those are only useful if they connect to a later business result. A metric isn't “leading” because it happens first. It's leading because it helps you anticipate a specific outcome with enough time to act.
That distinction is where most dashboards break.
The Critical Comparison Predictive vs Proven
The struggle is not with definitions. It is with trust.
A leadership team trusts lagging indicators because they're proven. Finance can close the month and report renewals, churn, profit, and realized revenue with confidence. Product and support teams need something different. They need signals that are earlier, messier, and still useful enough to drive action.
The tension in leading vs lagging indicators comes from this exact trade-off. One category helps you predict. The other helps you prove.
Leading vs Lagging Indicators at a Glance
| Attribute | Leading Indicators | Lagging Indicators |
|---|---|---|
| Time focus | Future-oriented | Past-oriented |
| Primary job | Predict what may happen | Confirm what did happen |
| Typical form | Inputs, behaviors, early signals | Outputs, results, confirmed outcomes |
| Team usefulness | Best for weekly intervention | Best for monthly or quarterly reporting |
| Ease of influence | Usually easier to influence directly | Usually hard to change in the short term |
| Reliability | Directional and hypothesis-driven | More definitive and stable |
| Risk | Can become noise if not validated | Can arrive too late for prevention |
| SaaS examples | Activation behavior, feature adoption patterns, onboarding completion, support issue themes | Revenue, churn, retention, subscription renewals, profit |
Why predictive metrics matter
Economists have dealt with this problem for decades. A widely used benchmark is the Conference Board's Leading Economic Index, which dates to 1960, was redesigned in 1996, and uses 10 components to anticipate turning points in the business cycle. It fell sharply ahead of major downturns such as the 2008–2009 financial crisis, which is why practitioners treat it as a forward-looking signal rather than a retrospective report (Investopedia's summary of the LEI and indicator types).
SaaS teams need the same discipline. If macro investors don't wait for lagging confirmation before adjusting, product leaders shouldn't wait for confirmed churn before investigating the behaviors that precede it.
Where each type breaks down
Leading indicators fail when teams skip validation. They pick an input metric because it's available, visible, or easy to improve. Then they assume movement in that metric means the business is healthier.
Lagging indicators fail when teams use them as operating controls. Revenue and retention are too delayed to guide most weekly decisions. They're scorecards, not steering wheels.
A good operating system treats them differently:
- Use leading indicators for intervention. Product, support, and growth teams should review them frequently.
- Use lagging indicators for accountability. Leadership should review them on a slower cadence and use them to assess whether interventions worked.
- Pair them explicitly. Every leading metric should point to one lagging outcome that matters.
If a metric predicts nothing important, it's not leading. It's just early.
The balanced view
The strongest teams don't argue about which category matters more. They design a chain of evidence.
They start with the outcome they need, such as lower churn or stronger expansion. Then they identify the few behaviors, events, or operational signals that consistently show up before that outcome moves. That's what makes the metric useful. Not its popularity. Not its visibility on a dashboard. Its relationship to money.
Real World Examples for SaaS and Support Teams
The best way to use leading vs lagging indicators is to frame them as operating hypotheses.
Not “we track lots of metrics.” More like: if this early behavior improves, we expect this business outcome to improve later. That mindset forces discipline.
Product example with feature retention
A product team wants stronger long-term adoption of a new workflow. The lagging indicator is 90-day feature retention. That tells leadership whether the feature became part of the customer's real process.
The leading indicator shouldn't be total clicks. That's too broad. A better candidate is the number of weekly active users who complete the feature's core job successfully and return to it within a short period. That's a stronger operational signal because it captures repeated value, not curiosity.
The working hypothesis is straightforward: improve successful repeat use early, and long-term retention should improve later.
Support example with ticket prevention
A support leader is trying to reduce tickets tied to one confusing setup step. The lagging indicator is a drop in ticket volume for that topic over time.
A potential leading indicator is a rise in knowledge base views for the exact article that explains the issue, paired with fewer follow-up contacts from users who viewed it. That pairing matters. Article views alone can mean confusion is growing. But article use followed by fewer repeat contacts can indicate prevention is working.
Support data becomes commercially useful. Ticket themes often surface product friction earlier than renewal data does.
Customer success example with renewal risk
A customer success team wants to reduce avoidable churn in an upcoming renewal cohort. The lagging indicator is the actual renewal outcome.
A stronger leading indicator might be a pattern of reduced engagement with a core workflow combined with an increase in support friction around the same account segment. Neither signal alone is enough. Together they can form a practical renewal risk hypothesis that teams can act on before commercial discussions harden.
Good indicator pairs are specific enough to trigger action. “Engagement is down” is vague. “Accounts failing to complete the core workflow after onboarding need intervention this week” is usable.
Growth example with expansion
A growth team wants more expansion from existing accounts. The lagging indicator is expansion revenue.
A useful leading indicator could be increased adoption of the product area that usually precedes seat growth, multi-team rollout, or premium workflow usage. Again, the key is not the metric itself. The key is whether that behavior historically shows up before expansion for the right customer segment.
This is what experienced operators learn the hard way. The same metric can be valuable for one goal and useless for another. App downloads might matter for top-of-funnel awareness. They are usually a poor operating signal for enterprise renewals.
How to Select and Validate Your Indicators
Most bad KPI systems come from one mistake. Teams promote a hunch into a dashboard before proving that it relates to an outcome.
A metric becomes operationally useful only when you can show a measurable relationship between the early signal and the later result. In product analytics, that means validating the candidate indicator against a lagging outcome such as churn, retention, or revenue, as explained in Amplitude's discussion of leading and lagging indicators.
Start with the outcome, not the activity
If the business goal is lower churn, begin there. If the goal is more expansion, begin there. Don't start with a list of available product events and hope one becomes meaningful later.
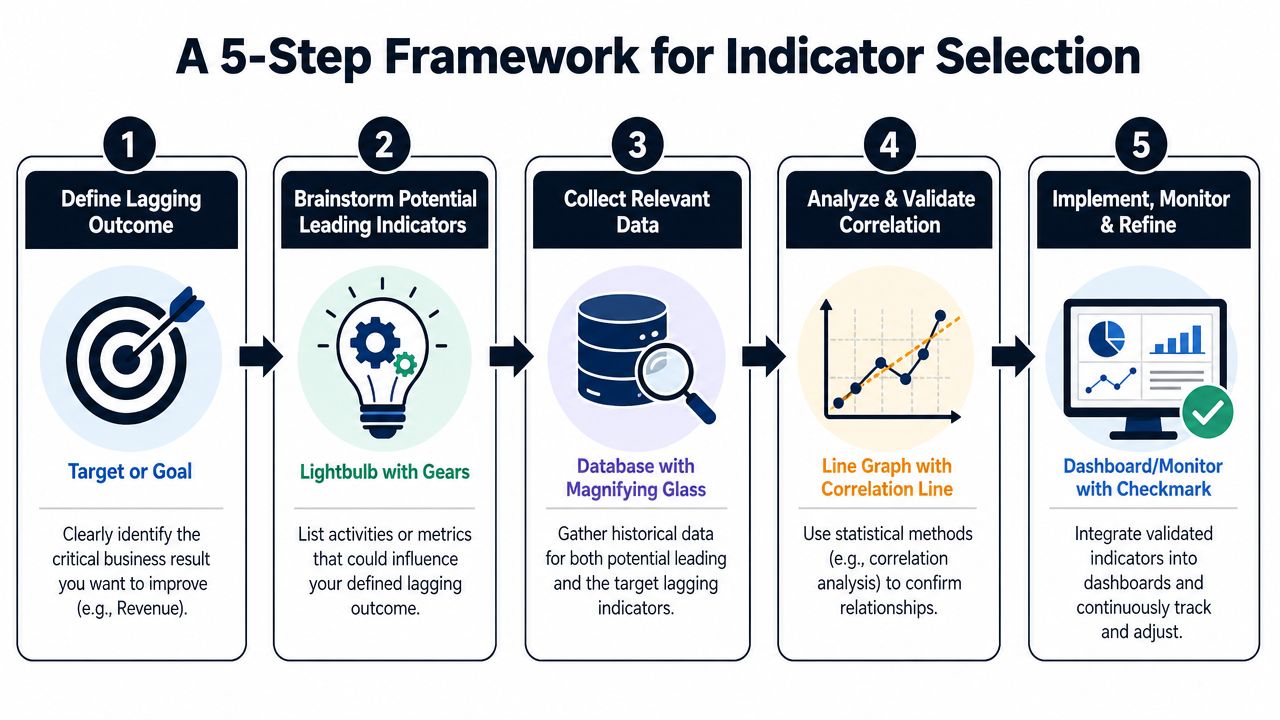
A simple sequence works well:
- Choose one lagging outcome. Pick the result that matters commercially, such as churn, retention, renewals, or expansion.
- List plausible predictors. Product behaviors, onboarding milestones, support patterns, and account signals are all fair candidates.
- Pull historical data. You need both the candidate leading metric and the outcome it's supposed to predict.
- Test the relationship. If the signal doesn't hold up, drop it.
- Operationalize only the validated few. Most dashboards should get smaller, not bigger.
What to look for during validation
The practical question is never “does this metric move?” It's “does this metric move before the result we care about, in a way that helps us act?”
That means checking for:
- Timing fit. Does the signal appear early enough for the team to intervene?
- Segment consistency. Does it work across the customer group you care about, or only in one corner of the business?
- Actionability. Can product, support, success, or growth realistically influence it?
- Stability. Does it keep its predictive value after a release, pricing change, or go-to-market shift?
One helpful operating habit is to keep a short written hypothesis beside every leading metric on the dashboard. If nobody can explain why the metric should predict the outcome, it probably shouldn't be there.
Build a review loop
Validation is not a one-time setup project. Metrics decay.
A signal that once predicted retention can become less useful after market conditions change, customer mix shifts, or the product matures. Teams that revisit their KPI logic regularly make better decisions than teams that inherit dashboards and never question them.
For product and support organizations building more disciplined reporting, this guide to metrics and reporting systems is a useful reference point for tightening ownership and review cadence.
Operator advice: Treat every leading indicator as a hypothesis under probation. It earns trust through repeated relationship to an outcome, not by looking plausible in a planning deck.
The AI Advantage Discovering Indicators That Drive Revenue
The hardest part of leading vs lagging indicators isn't understanding the theory. It's finding valid signal inside messy operating data.
Most SaaS companies have the relevant inputs scattered across Zendesk tickets, Intercom chats, call notes, CRM fields, feature events, onboarding logs, and warehouse tables. A human analyst can inspect some of that. They can't continuously test all of it with enough speed to support weekly product and revenue decisions.
That's where the hidden financial cost shows up. Teams optimize the wrong early metrics because those are the easiest ones to see.
The cost of misaligned indicator pairs
A misaligned pair looks harmless at first. A team picks an “early” metric that seems directionally positive, then allocates roadmap time, support effort, or lifecycle campaigns around it. Months later, the lagging KPI doesn't move.
The problem isn't just analytical sloppiness. It's wasted investment.
A 2024 McKinsey study on AI in product management found that 45% of product teams fail to achieve ROI because their predictive models are trained on low-correlation leading indicators. That's the clearest expression of signal-to-noise cost in modern product work. If the model learns from weak indicators, the team makes weak decisions.
Why manual analysis hits a wall
Humans are good at hypothesis generation. They're bad at continuously scanning large volumes of qualitative and behavioral data for changing relationships.
Support leaders might spot a ticket pattern before product sees it in churn. PMs may notice onboarding friction before finance sees it in retention. But in larger SaaS environments, the volume and fragmentation of evidence create a bottleneck. By the time someone consolidates the signal, the quarter is half gone.
This is why AI-driven analysis is no longer a “nice to have” for mature product organizations. It's becoming necessary infrastructure for identifying which combinations of usage patterns, complaint themes, and account behaviors map to revenue outcomes.
For leaders building planning systems around this capability, this piece on AI strategies for leadership goal setting is a strong complement because it connects AI-assisted decision making to operational goal design.
What AI should actually do
The useful application isn't “AI writes a summary of your dashboard.” It's much more specific.
AI should help teams:
- Detect patterns across sources. Connect support friction, behavioral drop-off, and account-level outcomes.
- Rank signals by business relevance. Not every anomaly deserves roadmap attention.
- Expose weak proxies. If a favorite metric stops correlating with churn or expansion, teams need to know quickly.
- Shorten the feedback loop. The faster the organization can test and replace weak indicators, the less money it wastes.
A strong product intelligence setup also changes the conversation inside leadership meetings. Instead of debating whose intuition is right, teams can focus on which signals show the clearest relationship to retention, expansion, or revenue risk.
If you're evaluating what that looks like in product practice, this overview of AI for product development is a useful starting point.
Your Implementation Checklist
A bigger KPI library isn't the typical requirement. Instead, a smaller, sharper system tied to revenue outcomes is essential.
Use this checklist to put the framework into practice.
Quarterly setup
- Pick one lagging KPI per goal. Choose the business result that matters most this quarter, such as churn, renewals, retention, or expansion.
- Write the commercial question in plain language. “What predicts preventable churn in our mid-market accounts?” is much better than “improve health score framework.”
- Gather a cross-functional group. Product, support, customer success, growth, and data should each bring candidate signals.
Indicator selection
- Shortlist only plausible drivers. Focus on behaviors or operational patterns your teams can influence.
- Test historical relationships. Review whether each candidate signal consistently shows up before the outcome you care about.
- Cut vanity metrics early. If a metric is easy to improve but doesn't help predict the lagging KPI, remove it.
Operating cadence
- Assign one owner per indicator pair. Someone should be accountable for reviewing the signal and recommending action.
- Track leading indicators frequently. Use them for weekly intervention, not monthly retrospectives.
- Review lagging outcomes on a slower cadence. That's where you confirm whether the intervention worked.
- Revalidate regularly. A signal that worked last quarter may not hold next quarter.
For teams formalizing dashboards and stakeholder reporting, this key performance indicator report template can help translate the framework into a repeatable management process.
The goal isn't to predict everything. It's to stop spending time on early signals that don't move the outcome that pays the bills.
If your team is drowning in tickets, usage data, and conflicting KPI debates, SigOS helps you find which signals correlate with churn, expansion, and revenue impact. Instead of optimizing noise, you can prioritize the issues and opportunities most likely to change the business outcome before the lagging metrics arrive.
Keep Reading
More insights from our blog


Ready to find your hidden revenue leaks?
Start analyzing your customer feedback and discover insights that drive revenue.
Start Free Trial →