Mastering The CAC To LTV Ratio For Sustainable SaaS Growth
Unlock sustainable growth with our guide on the CAC to LTV ratio. Learn to calculate, interpret, and improve this vital SaaS metric with actionable strategies.

At its core, the CAC to LTV ratio compares two fundamental numbers: how much it costs to get a new customer (Customer Acquisition Cost) and how much that customer is worth to your business over time (Lifetime Value).
For a SaaS company to be healthy, the goal is to hit a 3:1 ratio. This means for every single dollar you spend to bring a customer in the door, you should expect to get at least three dollars back.
Your SaaS Health Score: What The CAC to LTV Ratio Reveals
Think of the CAC to LTV ratio as the ultimate health score for your company's growth engine. It’s not just another vanity metric; it tells you if you're building a sustainable, profitable business or just burning through cash on a treadmill.
This single ratio answers the most critical question for any subscription company: Is our customer acquisition strategy actually fueling the business, or is it slowly draining the tank?
It’s a lot like a car's fuel efficiency. You need to know how many miles you get per gallon to understand the cost of a trip. Similarly, your CAC to LTV ratio tells you exactly how much value you get for every dollar you put into your marketing and sales machine. It’s the clearest way to measure the ROI of your entire go-to-market strategy.
Understanding The Core Benchmarks
The LTV/CAC ratio has become the gold standard for measuring profitability in SaaS. Industry-wide, a 3:1 ratio is seen as the magic number—the minimum threshold for sustainable growth.
If your ratio dips below 1:1, you're in trouble. It means you are actively losing money on every new customer you sign. That’s a business model with a very short shelf life.
This quick reference table can help you interpret your CAC to LTV ratio and decide what to do next.
CAC To LTV Ratio Health Check
| Ratio | What It Means | Recommended Action |
|---|---|---|
| 1:1 or less | You're losing money. For every customer you acquire, your business is going backward financially. The model is broken. | Hit the brakes. Immediately pause unprofitable campaigns and re-evaluate your pricing, audience targeting, and onboarding. |
| 2:1 | You're treading water. You’re likely breaking even but have very little margin for error or reinvestment. It's not a path to long-term growth. | Optimize. Focus on increasing LTV through retention and finding more efficient acquisition channels. You're close, but work is needed. |
| 3:1 | You have a healthy business. This is the target for most SaaS companies. Your GTM strategy is working, and you have a solid, profitable model. | Scale with confidence. You've found a working formula. Continue monitoring and look for opportunities to cautiously increase your investment in growth. |
| 4:1+ | You have an excellent business. Your model is highly efficient, and you're generating significant returns on your acquisition spend. | Press the accelerator. You've found a gold mine. It's time to invest more aggressively in your marketing and sales efforts to capture more market share. |
A ratio above 3:1 isn't just good—it's a signal that you've built a powerful growth engine ready for more fuel.
This infographic breaks it down visually.
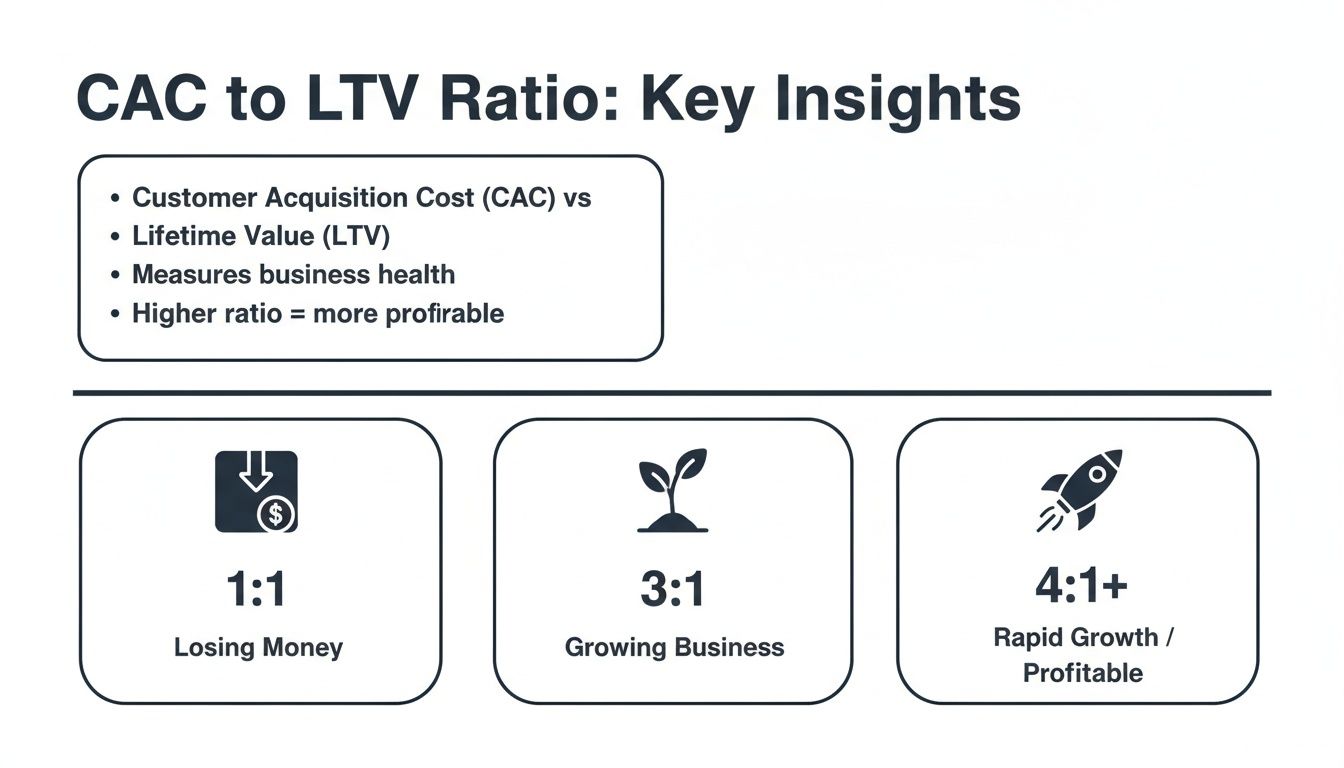
As you can see, a 1:1 ratio is a red flag. A 3:1 ratio means you're on the right track. And a 4:1 ratio or higher is a green light to pour more resources into growth.
Why This Ratio Is a Strategic Tool
Beyond just a health check, this ratio is one of the most powerful strategic tools a founder or growth leader has. It creates a common language across product, marketing, and sales, aligning everyone on the shared goal of profitable growth.
When you truly understand this metric, you can make much smarter decisions.
- Validate your pricing model: Is your LTV too low? It might be a clear sign that your prices aren't high enough to support your acquisition costs.
- Optimize marketing spend: The ratio helps you see which channels are bringing in profitable customers and which are just wasting your budget.
- Prioritize product development: It forces you to focus on retention and expansion revenue, pushing teams to build the features that keep customers happy and encourage them to upgrade.
Getting this ratio right is fundamental to building a business that lasts. For a deeper dive into improving this key metric, you can Master Your CAC LTV Ratio for Shopify Growth. It's a fantastic guide that breaks down everything you need to know.
How To Calculate CAC And LTV Without The Guesswork
Alright, let's move from theory to action. This is where the CAC to LTV ratio really starts to work for you. To make smart, confident decisions, you have to be able to trust your numbers. Let's walk through how to calculate both Customer Acquisition Cost (CAC) and Customer Lifetime Value (LTV) precisely, so you can ditch the guesswork for good.
Calculating A Fully Loaded Customer Acquisition Cost
One of the most common mistakes I see is businesses calculating CAC using only their ad spend. This gives you a dangerously incomplete picture. A true, "fully loaded" CAC has to account for every single dollar you spend to land a new customer.
Think of it this way: your CAC is the total cost of your growth engine divided by the output it produced. In SaaS, this means adding up all your sales and marketing expenses over a set period and dividing that by the number of new customers you brought in. If a company spends 500,000 in a year on all its sales and marketing efforts and signs up 5,000 new customers, its CAC is a straightforward ****100. For a deeper dive on this, Wall Street Prep has some great resources.
The formula itself is simple:
CAC = (Total Sales & Marketing Expenses) / (Number of New Customers Acquired)
The trick is getting the "Total Sales & Marketing Expenses" part right. To do that, you have to include:
- Marketing Spend: Every penny spent on ads, content, events, and campaign management.
- Sales Expenses: Salaries, commissions, and bonuses for your entire sales team.
- Team Salaries: The portion of salaries for anyone involved in acquisition—marketing, SDRs, and even customer success if they play a role.
- Tool & Software Costs: Your CRM, marketing automation, analytics tools, and any other tech that powers your go-to-market machine.
Let's make this real with a quick example.
SaaS Company Example: "ConnectSphere"
Imagine ConnectSphere looked at their spending last quarter:
- Marketing & Ad Spend: $40,000
- Sales & Marketing Salaries: $50,000
- Commissions & Bonuses: $10,000
- Software & Tool Costs: $5,000
Their total acquisition spend was $105,000. If they brought in 300 new customers during that time, their fully loaded CAC is:
**105,000 / 300 = **350 per customer
That $350 is the real, honest cost to acquire one customer.
Calculating Customer Lifetime Value The Right Way
Now for the other side of the coin. Customer Lifetime Value (LTV) is your prediction of the total revenue a single customer will generate for you over their entire relationship with your company. A simplistic LTV calculation can be just as misleading as a shallow CAC, so it’s crucial to factor in your profit margins and churn rate.
There are a few ways to get to LTV, but a reliable method for most SaaS businesses leans on your Average Revenue Per Account (ARPA) and customer churn. If you want to explore other models, check out our guide on calculating lifetime value for SaaS.
Here’s what you’ll need to pull together:
- Average Revenue Per Account (ARPA): What's the average amount of revenue you get from each customer per month? Just divide your Monthly Recurring Revenue (MRR) by your total customer count.
- Gross Margin %: Not every dollar of revenue is profit. You have to subtract your cost of goods sold (COGS)—things like hosting, third-party data services, and direct support costs.
- Customer Churn Rate: What percentage of your customers leave each month? This is your monthly customer churn rate.
With those three numbers, you can use this formula:
LTV = (ARPA * Gross Margin %) / Customer Churn Rate
Let's go back to our friends at ConnectSphere.
ConnectSphere LTV Calculation
Let's assume these are their core metrics:
- ARPA: $100 per month
- Gross Margin: 80% (meaning it costs them 20 to deliver their 100 service)
- Monthly Customer Churn Rate: 2%
Now, we just plug those into the formula:
LTV = (100 * 0.80) / 0.02 LTV = ****80 / 0.02 LTV = $4,000
So, the total expected lifetime value of a ConnectSphere customer is 4,000. When you put that next to their ****350 CAC, you suddenly have a very powerful story about the health and sustainability of their business.
Interpreting Your Ratio Beyond The 3:1 Benchmark
Getting a handle on your CAC to LTV ratio is a massive first step. But the real magic happens when you learn to read between the lines. While 3:1 is the number everyone talks about, treating it as some universal law of SaaS is a classic rookie mistake.
Your "ideal" ratio isn't a static target. It’s a moving one that depends entirely on your industry, business model, and, most importantly, your stage of growth. Context is everything here. An early-stage startup burning cash to grab market share might be perfectly happy with a 2:1 ratio for a while, betting that they can expand that LTV down the road. In contrast, a mature public company might face pressure from investors to maintain a solid 4:1 or even 5:1.
Beyond The Blended Average
One of the most dangerous traps you can fall into is looking at a single, "blended" LTV:CAC ratio for your whole business. This single number is just an average, and averages are brilliant at hiding the truth. It can easily mask your most profitable customer segments while completely obscuring the channels that are quietly bleeding you dry.
Think about a SaaS company with a blended ratio of 3.5:1. On the surface, that looks pretty healthy. But when they slice the data, they uncover two totally different stories:
- Organic Search: This channel is a goldmine, bringing in high-value enterprise clients with an incredible 8:1 ratio.
- Paid Social Ads: This channel is a money pit, attracting low-value SMB customers with a dismal 1.5:1 ratio.
That "healthy" blended average made them feel successful. In reality, their profitable organic channel was just subsidizing a failing paid ads strategy. Without segmenting the ratio, they would have kept pouring good money after bad.
Context Is King: Industry and Business Model
Not all SaaS companies are built the same, so why would their target ratios be? The right LTV to CAC can swing wildly based on who you're selling to and the mechanics of your business.
- Enterprise SaaS: If you're selling big annual contracts to massive companies, you'll naturally have a long sales cycle and a high CAC. But the LTV is usually enormous, with high contract values and sticky customers. Here, you're often looking for ratios of 5:1 or even higher to justify the effort.
- SMB SaaS: For businesses serving the small-and-mighty crowd, both CAC and LTV are typically lower, and churn is higher. In this world, hitting a solid 3:1 is a great goal. Anything dipping below that is a signal that something needs to change, fast.
This is exactly why comparing your numbers to an irrelevant benchmark is so misleading. An SMB-focused business chasing an enterprise-level 5:1 might starve its growth channels, while an enterprise company settling for 3:1 is probably leaving a ton of money on the table.
Key Takeaway: Stop thinking of your LTV:CAC ratio as a single number on a report. Think of it as a dashboard, with different dials for every marketing channel, customer persona, and pricing plan. That segmented view is where the truly actionable insights live.
Common Interpretation Pitfalls to Avoid
The relationship between Customer Lifetime Value and Customer Acquisition Cost is a cornerstone of modern SaaS profitability. Industry research from sources like Klipfolio consistently shows that companies holding a 3:1 ratio or better are built for sustainable growth. To use the metric properly, you have to sidestep a few common mistakes that can lead your strategy astray.
Mistake #1: Ignoring the Payback Period A fantastic LTV to CAC ratio looks great on paper, but it doesn't mean much if it takes you three years to earn back your acquisition costs. A long payback period can create serious cash flow crunches, even when the long-term economics seem sound. Always look at your ratio in tandem with your customer payback period.
Mistake #2: Applying a Single LTV to All Customers Just like CAC varies by channel, LTV varies dramatically by customer segment. A customer locked into an annual plan has a completely different lifetime value than someone on a flexible monthly plan. Enterprise clients aren't the same as prosumers. Calculating and interpreting your LTV for each distinct segment isn't optional—it's essential for making smart decisions.
Actionable Strategies To Improve Your CAC To LTV Ratio
Okay, you've run the numbers and you have your CAC to LTV ratio. Now what? The real magic happens when you turn that data into a concrete plan for growth.
Improving your CAC to LTV isn't about finding one silver bullet. Think of it as a scale with two sides. On one side, you have your Customer Acquisition Cost (CAC), and on the other, your Customer Lifetime Value (LTV). To tip the scale in your favor, you have two options: push down on the CAC side or lift up the LTV side.
The most durable companies do both. Driving down acquisition costs makes your growth engine run leaner and meaner, while increasing lifetime value makes every single customer you bring in that much more profitable over the long haul.
Let's dig into the playbook for both.

Strategies To Decrease Your Customer Acquisition Cost
A high CAC is like a hole in your company's gas tank—it burns through cash and severely limits how far and fast you can go. The mission is simple: acquire better customers, more efficiently.
Here are a few proven ways to get that cost down:
- Dial in your ad targeting. Stop spraying your ad budget across audiences that will never convert. Get hyper-specific. Use your ideal customer profile to build laser-focused ad campaigns on the platforms where your best customers actually hang out.
- Plug the leaks in your funnel. A leaky conversion funnel is an incredibly expensive problem. You're paying to get people to the door, only to watch them walk away. A/B test everything: your landing page headlines, your call-to-action buttons, your signup forms. Even a tiny bump in your conversion rate from 1% to 2% literally cuts your CAC in half for that channel.
- Invest in organic growth loops. Paid ads give you a quick hit, but organic channels are what build a long-term, defensible business. Content marketing and SEO take time and effort to spin up, but once they're going, they create a powerful, sustainable flow of high-intent leads. A single great article can bring in new customers for years, consistently lowering your blended CAC over time.
- Weaponize your happy customers. Who better to sell your product than the people who already love it? A well-designed referral program turns your existing customers into a volunteer marketing team. These referrals are often your highest-quality leads, and they come in at a fraction of the cost of traditional paid advertising.
Strategies To Increase Your Customer Lifetime Value
Getting a customer to sign up is just the first step. The real, sustainable profit is unlocked by keeping them around and growing their accounts over time. Honestly, this is where you can often make the biggest, most lasting impact on your CAC to LTV ratio.
Boosting LTV is all about retention and expansion. You need to nail the customer experience and create clear pathways for them to get more value—and for you to generate more revenue.
1. Create a Flawless Onboarding Experience A customer’s first few days with your product are make-or-break. If they get confused, frustrated, or can't figure out what to do, they'll churn before you can even say "LTV." The entire goal of onboarding is to race them to that "aha!" moment—the point where they truly experience the value your product promises.
2. Drive Adoption of Sticky Features The more of your product a customer uses, the more embedded it becomes in their workflow. They become stickier. Use in-app guides, targeted emails, and quick tutorials to point them toward the features that deliver the most value. This not only makes them less likely to leave but also perfectly sets them up for future upsells.
Pro-Tip: Don't just show them how to use a feature; show them why it matters to them. Frame it in the context of the job they're trying to get done.
3. Build Smart Expansion Revenue Models Expansion MRR (monthly recurring revenue) is the secret weapon of high-growth SaaS. It’s revenue you earn from your existing customer base.
- Upselling: This is about moving customers to a higher-tier plan. The key is to time your pitch perfectly, right when they're hitting a usage limit or asking about a feature only available in the next tier up.
- Cross-selling: This involves offering a complementary product or add-on. For instance, if you sell project management software, you might offer a time-tracking module as a cross-sell to power users.
4. Get Proactive About Reducing Churn Churn is the silent killer of LTV. Every customer who leaves takes their future revenue potential with them. Even a small drop in your monthly churn rate has a massive compounding effect on LTV over time. If you want a deep dive on this, we've outlined a ton of strategies for reducing churn rate you can put into practice. It’s all about spotting the warning signs early and stepping in to help before a customer decides to walk away.
Here's a quick look at how these tactics compare and who on your team typically owns them.
Tactics For Improving Your CAC To LTV Ratio
| Goal | Strategy | Primary Team Responsible | Impact On Ratio |
|---|---|---|---|
| Decrease CAC | Refine Ad Targeting & Spend | Marketing | Lowers the cost side of the equation. |
| Decrease CAC | Improve Funnel Conversion Rates | Marketing / Product | Lowers the cost side by converting more leads for the same spend. |
| Decrease CAC | Build Organic/Referral Channels | Marketing / Product | Lowers the cost side by adding low-cost acquisition sources. |
| Increase LTV | Improve User Onboarding | Product / Customer Success | Increases the value side by reducing early churn. |
| Increase LTV | Drive Feature Adoption | Product / Customer Success | Increases the value side by making the product stickier. |
| Increase LTV | Upsell & Cross-sell | Sales / Customer Success | Increases the value side by growing account value (ARPA). |
| Increase LTV | Proactively Reduce Churn | Customer Success / Product | Increases the value side by extending the customer lifetime. |
Ultimately, systematically lowering your acquisition costs while simultaneously working to increase the lifetime value of your customers is the foundation of sustainable SaaS growth. This dual focus is what transforms a good business into a great one that’s built to last.
How Product Intelligence Drives LTV Optimization
Improving your CAC to LTV ratio is a constant balancing act. Marketing can work on dialing in ad spend and sales can sharpen its pitch, but the most powerful, long-term gains will always come from the product itself. The real trick is tying product development decisions directly to revenue, and that’s where product intelligence comes into play.
Product intelligence is what takes you out of the realm of guesswork. Instead of building your roadmap based on the loudest customer or a hunch, you get a data-driven way to see exactly how your product is affecting LTV. A platform like SigOS is built for this, turning abstract goals like "improve retention" into a concrete, repeatable process.

Uncovering The "Why" Behind The Numbers
Your LTV calculation tells you what's happening—customers are churning, or they're sticking around. A product intelligence platform, on the other hand, tells you why. It digs through huge volumes of scattered customer feedback and connects it to what users are actually doing inside your product.
Think about all the data you’re sitting on:
- Qualitative Feedback: Support tickets, live chat logs, notes from sales calls, and user surveys.
- Quantitative Data: Product usage metrics, feature adoption rates, and user session recordings.
Trying to connect these dots manually is next to impossible. SigOS automatically pulls in and makes sense of it all, searching for patterns that line up with your key business outcomes. It’s what connects a specific complaint buried in a support ticket to a user behavior pattern that happens right before a customer churns.
This is the shift from being reactive to predictive. You can finally pinpoint the exact friction points in your product that are costing you money.
By analyzing both qualitative and quantitative data, product intelligence pinpoints the specific bugs, missing features, and usability issues that have the biggest negative impact on your customer lifetime value.
This kind of analysis is a game-changer. Instead of just knowing your churn rate is 2%, you can now see that 15% of that churn comes from a single, frustrating bug in your reporting module. Suddenly, you have a very specific, actionable problem to solve.
Prioritizing Work Based On Revenue Impact
The next step is turning these insights into a roadmap you can actually execute. One of the toughest jobs for any product team is deciding what to build next. Do you fix a bug that’s annoying a handful of power users? Or do you build that new feature a big prospect keeps asking for?
Product intelligence takes the guesswork out of this process by putting a dollar value on each issue or feature request. With a tool like SigOS, you can quantify the financial cost of doing nothing and the potential upside of taking action.
For example, the platform can bring insights to the surface like:
- Churn Driver: "This workflow bug is present in the accounts of 75 customers who churned last quarter, representing $20,000 in lost MRR."
- Expansion Blocker: "This missing integration has been mentioned in 12 sales deals currently stalled, representing $150,000 in potential expansion revenue."
With data like this, the product roadmap almost writes itself. Teams can confidently tackle the work that delivers the highest financial return, which directly boosts LTV.
Creating A Feedback Loop For Continuous Improvement
Finally, product intelligence closes the loop between your teams. When a product manager uses SigOS to create a Jira ticket for a bug, the associated revenue impact is automatically attached. This gives engineering teams critical context—they aren't just fixing a piece of code; they're saving the company thousands of dollars in potential churn. If you want to dive deeper, you can see how to use behavior analytics to inform these decisions.
This builds a powerful, continuous cycle:
- Identify: SigOS flags an issue causing churn or blocking an upsell.
- Quantify: It calculates the direct revenue impact of that issue.
- Prioritize: The product team moves the high-impact fix to the top of the backlog.
- Execute: The engineering team resolves the issue, knowing exactly why it matters.
- Measure: The platform then monitors whether the fix actually reduced churn and improved LTV.
By putting a system like this in place, your product organization stops being a cost center and becomes a powerful engine for LTV growth. This directly improves your CAC to LTV ratio by making your product stickier, cutting down churn, and unlocking new revenue from the customers you've already worked so hard to acquire.
A Few Lingering Questions About The CAC To LTV Ratio
Once you get the hang of the basic math, you start bumping into real-world scenarios that don't quite fit the textbook formula. It’s one thing to calculate the CAC to LTV ratio, but it’s another to apply it smartly to your day-to-day decisions.
Let's clear up some of the most common questions that come up when teams put this metric to work.
What Is A Good Customer Payback Period For SaaS?
While the CAC to LTV ratio gives you a long-term view of profitability, your customer payback period is all about short-term cash flow. For most SaaS companies, a healthy payback period is under 12 months.
Think of it this way: you want to recoup the money you spent to acquire a customer within their first year. If you can get that down to 5-7 months, you're in an even stronger position. It means your cash is freed up faster, ready to be reinvested into sales and marketing to keep the growth engine humming.
A payback period that stretches past 18 months can signal trouble. It’s often a sign that your pricing is too low, your acquisition costs are out of control, or early churn is killing your cash flow before you have a chance to get ahead.
How Does This Ratio Apply To Freemium Models?
Freemium definitely throws a wrench in the works, but the core idea of the CAC to LTV ratio still holds true. The trick is to be laser-focused on what you're measuring.
When calculating CAC for a freemium product, you have to base it only on the costs that went into converting free users to a paid plan. The expense of supporting your entire free user base isn't part of the CAC for your paying customers. It's better to think of that as a marketing expense—the cost of generating a massive pool of potential leads.
From there, your LTV is calculated using only the revenue from those paying customers. This keeps the ratio honest. It answers the one question that really matters for a freemium model: "For every dollar we spend to get a free user to pull out their credit card, how much value are we getting back?"
Should I Calculate CAC To LTV For Different Customer Segments?
Yes, and you absolutely should. Relying on a single, blended CAC to LTV for your whole business is one of the easiest ways to be misled by your own data.
A blended ratio is just an average, and averages have a nasty habit of hiding the truth.
Once you start calculating the ratio for different segments, you unlock a much richer picture. You can—and should—break it down by:
- Marketing Channel: You might discover that customers coming from organic search have a fantastic 7:1 ratio, while your paid social ads are barely breaking even at 1.8:1.
- Customer Size: Your enterprise clients could have a sky-high CAC but an even higher LTV, making them incredibly profitable. Meanwhile, your SMB customers might have a low CAC but churn so quickly that their ratio is weak.
- Pricing Tier: Customers on your premium plan will almost certainly have a different LTV than those on the basic plan. Slicing the data this way tells you if your pricing strategy is actually working.
Segmenting your CAC to LTV ratio turns it from a simple report card into a strategic roadmap. It points you directly to the marketing channels worth doubling down on and the segments that need fixing—or dropping altogether.
SigOS helps you find the "why" behind your LTV and churn numbers. By analyzing customer feedback and behavior, SigOS identifies the precise product issues driving customers away and the feature requests that will increase their value. See how you can prioritize work that boosts LTV.
Keep Reading
More insights from our blog

Ready to find your hidden revenue leaks?
Start analyzing your customer feedback and discover insights that drive revenue.
Start Free Trial →