Churn Analysis Case Study: 7 Real Wins Worth Stealing
A churn analysis case study roundup of 7 SaaS teams: data sources, methods, dollar impact, and the fixes that actually moved retention in 2026.

Retention pressure is no longer a background metric. An independent 2026 SaaS benchmark covering 184,000 customer-months across 38 clients found that median monthly churn reached 4.7%, compared with 3.8% in 2024 and 3.4% in 2022. The same benchmark recorded a fall in median Net Revenue Retention from 112% in 2022 to 104% in 2026, showing how quickly acquisition-led growth can lose force when existing customers become harder to retain. (2026 SaaS churn benchmark)
Teams already collect usage logs, support tickets, renewal dates, and account value. The failure happens afterward. Analysts produce a churn report, but nobody ranks the causes by revenue exposure, assigns ownership, or measures whether the intervention worked. The seven examples below are useful because they expose the operating choices behind churn analysis, from signal selection and cohort design to experimentation and workflow automation. The company labels in several examples are analytical frames rather than verified public performance claims. The comparison standard throughout is the same: can a team turn an early signal into a targeted action and a measurable retention outcome?
1. Predictive Churn Modeling in SaaS Through a Stripe Lifecycle Lens
A predictive churn model should follow the customer timeline from active use to cancellation. For a payments or API business, relevant signals include transaction activity, failed payments, product usage, integration depth, support history, and renewal status. The central question is what changed before customers left, and did that change occur early enough to act on?
The Stripe example works as a lifecycle-analysis blueprint, not as a verified public performance result. Analysts can compare declining transaction volume, reduced API activity, incomplete integrations, and recurring payment failures across retained and churned accounts. Customer segment and contract stage provide necessary controls, because the same behavioral change can mean different risks for a new account and a mature one.
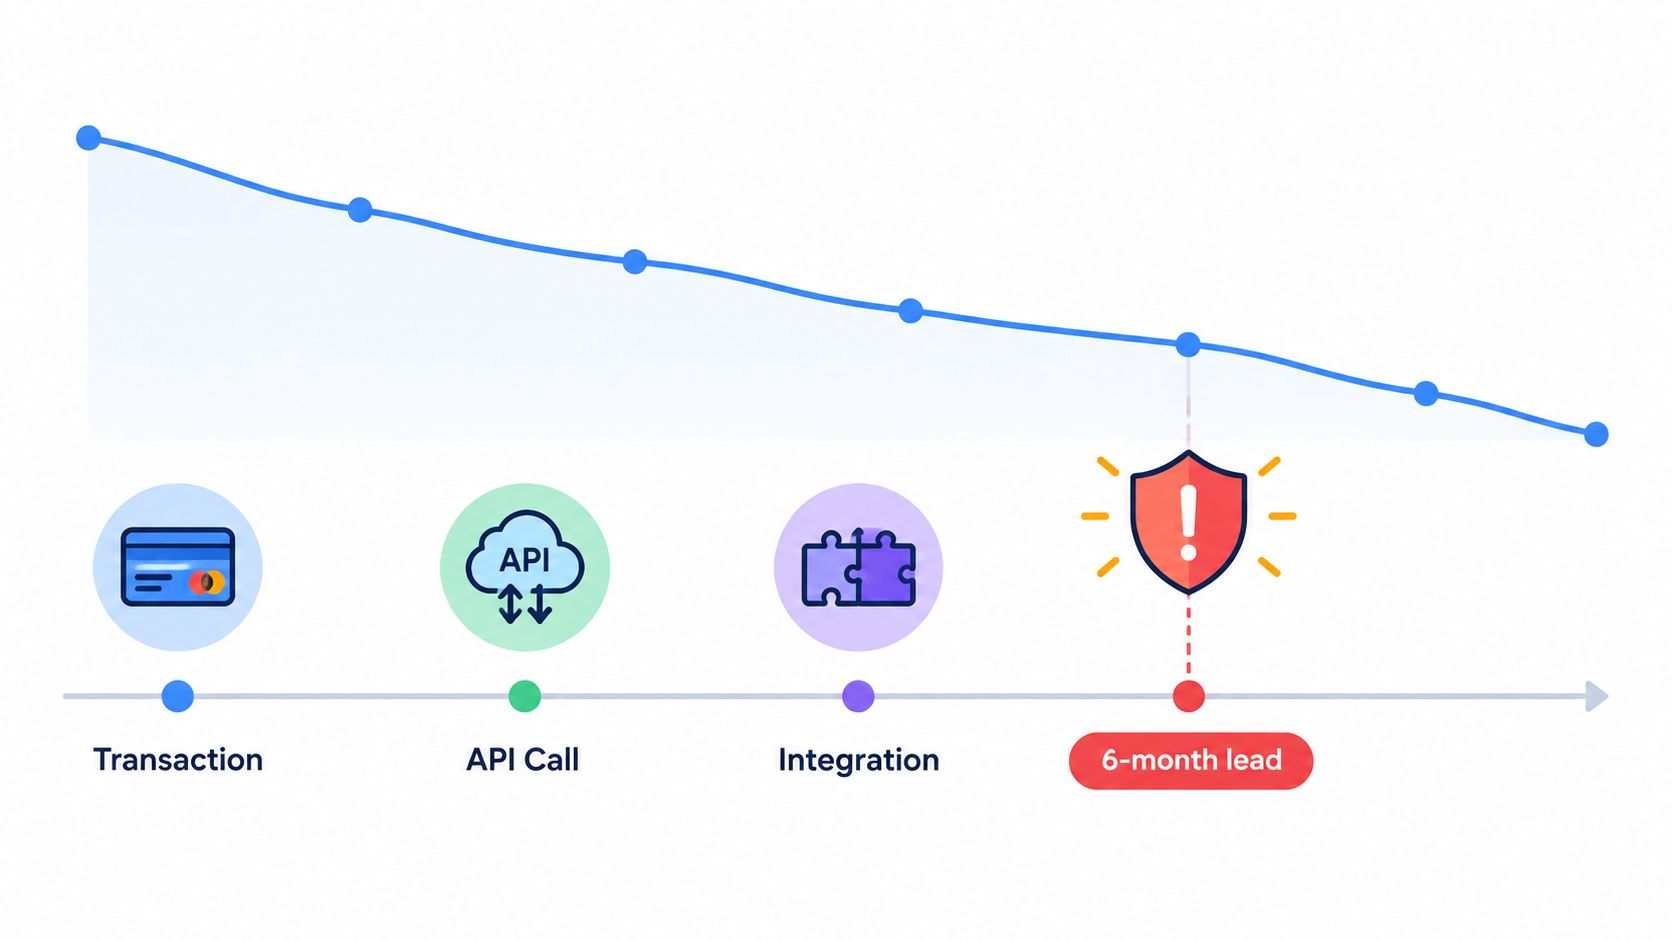
The analytical lens
- Data sources: Product events, billing records, integration logs, support conversations, renewal status, and account-level revenue.
- Methodology: Build time-based features, separate voluntary from involuntary churn, and test predictions against later customer outcomes.
- Findings: A falling activity curve signals risk, while the correct response depends on whether product friction, payment failure, or declining demand caused it.
- Dollarized impact: Rank accounts by recurring revenue and customer value, so limited retention capacity targets the largest exposure.
- Remediation: Route each account to billing recovery, technical assistance, customer education, or executive outreach based on the detected cause.
- Measurable outcome: Track prevented cancellations, recovered payments, retained recurring revenue, and false-positive interventions.
A telecom case demonstrates this operating logic with a reported result. Its churn prediction and proactive retention program reduced churn from 8.6% to 4.2%, a 51.2% relative decrease, after intervention. (telecom churn prediction case study showing an 8.6% to 4.2% reduction)
Practical rule: A risk score has commercial value only when it routes an account to a specific owner and action.
Teams can build custom predictive models, but event definitions should be reliable before modeling begins. Predictive churn modeling connects behavioral change to a prioritized retention workflow.
2. Support Ticket Sentiment Analysis With an Intercom-Style Framework
Support tickets can explain churn more clearly than ticket volume alone. A high contact rate may reflect product importance, complex implementation, or poor access to support. Analysts need to connect the conversation itself with issue themes, escalation paths, resolution history, and later renewal behavior.
The Intercom example provides an organizing framework, not a verified claim about Intercom's internal results. Begin with support tickets, chat transcripts, escalation records, response intervals, issue categories, account value, tenure, and renewal outcomes. Classify recurring topics, track sentiment over time, and test whether issue patterns precede churn after accounting for differences between accounts.
A single negative sentence rarely establishes risk. Repeated integration problems, unresolved defects, or escalation beyond frontline support are more informative when they recur across an account's history. Analysts should still compare each pattern with actual renewal outcomes before treating it as a reliable warning signal.
The commercial calculation is direct. Multiply affected recurring revenue by estimated churn probability, then separate preventable service costs from potential revenue loss. This shows whether a recurring issue requires a technical owner, a customer-success response for adoption barriers, or a service owner focused on response quality.
Track renewal rates by issue cohort, resolution time, repeat-contact frequency, and revenue retained after intervention. Those measures connect sentiment analysis to an operating result rather than leaving it as a text classification exercise.
A classic subscription-style experiment shows why intervention design matters. A campaign intended to encourage customers increased churn: 6.4% of the control group left within the first three months, compared with 10.0% of the treatment group, with a statistically significant difference of p < .001. (classic churn experiment) The finding does not show that outreach always fails. Broad outreach can create friction, reach customers who are not at risk, or introduce a problem customers had not considered.
Support analysis gains value when text patterns are joined with product and revenue context. Customer sentiment analysis can help rank recurring issues, while Bridge Global's sentiment analysis overview outlines the wider analytical approach.
3. Product Usage Cohort Analysis Beyond Feature Adoption
Feature adoption becomes informative only when analysts examine what customers do before and after using a capability. A single “used feature” field cannot show time to value, repeated use, collaboration, or whether the product solved the customer's original problem. Cohort analysis creates that context by grouping customers at a shared lifecycle stage and tracking how their behavior develops.
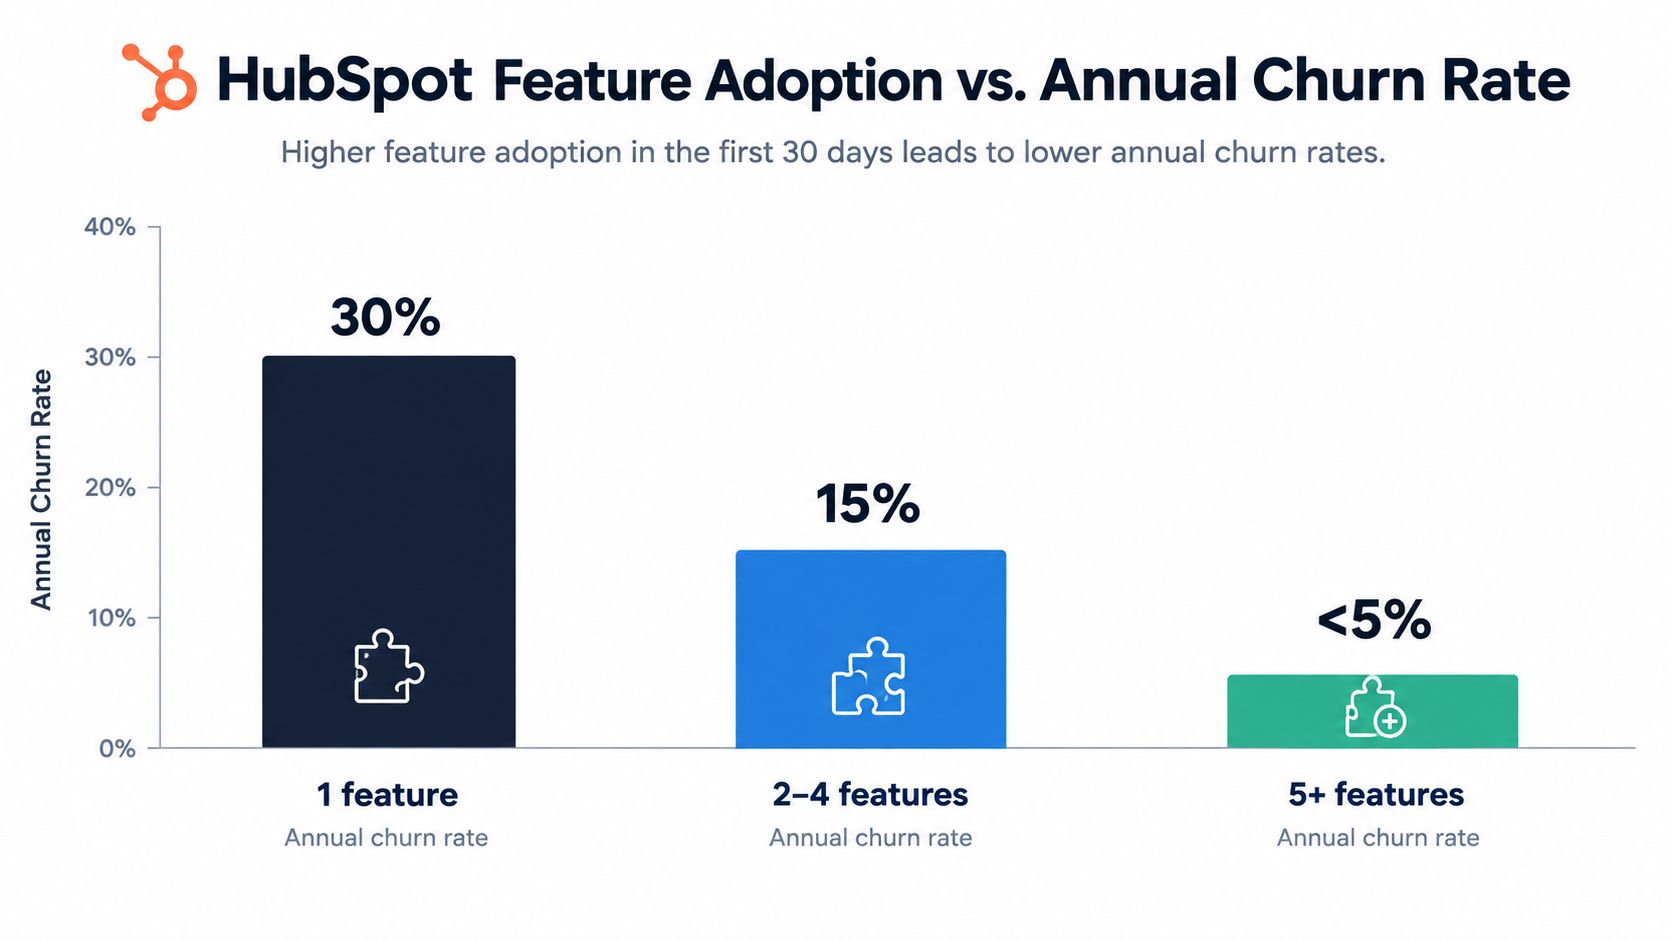
The HubSpot example is best treated as a product-analysis lens, not as a verified claim about HubSpot's performance. A SaaS team can compare cohorts by onboarding path, first-value event, active-user count, integration depth, workflow breadth, plan type, and renewal status. This design reveals whether retention is associated with a connected adoption path rather than one isolated feature.
A practical cohort review should answer six questions:
- Data sources: Product events, onboarding completion, workspace activity, user invitations, integrations, plan type, and renewal status.
- Methodology: Build cohorts by start period and customer segment, then compare retention curves with time to first value and adoption depth.
- Findings: Customers who repeatedly reach value through connected workflows may develop a stronger product relationship than customers who briefly test many features.
- Dollarized impact: Estimate revenue exposed in under-activated cohorts and rank onboarding changes by the account value they influence.
- Remediation: Add contextual guidance, simplify setup flows, connect related capabilities, and give customer-success teams an account-specific adoption path.
- Measurable outcome: Monitor activation completion, time to first value, expansion behavior, renewal outcomes, and retention by cohort.
The analytical unit should be the adoption path, not the feature event. A customer who reaches value through several linked workflows may carry a different churn risk from one who records broad but shallow usage.
An independent churn case study reinforces the need to test multiple signal families. Its findings indicate that user activity signals alone were weak at identifying churners, while transactional attributes contained more useful patterns. The study's ensemble result should not be transferred to another product without validation, but it supports a clear practice: compare behavioral, transactional, and lifecycle signals instead of assuming that clicks or sessions explain retention.
The relevant cohort may be customers who reached value through the intended sequence and continued using the result, not simply customers who used feature A.
Teams can use retention cohort analysis to locate breaks in that sequence. The output should be an intervention queue tied to account value and measurable renewal outcomes, rather than a dashboard that only reports declining usage.
4. Revenue Impact Scoring and Churn Forecasting
A churn forecast becomes more useful when it ranks exposure, not probability alone. An account with high predicted risk may generate little revenue, while a strategically important account with moderate risk may justify executive attention. Revenue impact scoring puts contract value, renewal timing, and intervention feasibility beside the forecast.
The Salesforce example is an analytical frame, not a verified description of Salesforce's internal customer-success system. A transferable design separates two questions: how likely is the account to churn, and how much recurring revenue is at risk? Analysts can combine contract records, usage change, support history, renewal timing, expansion potential, product fit, and relationship context, then calculate expected exposure for each account or segment.
The model should preserve distinct analytical fields:
- Data sources: Recurring revenue, contract terms, renewal dates, usage trends, support interactions, product fit, and strategic account attributes.
- Methodology: Estimate churn probability and account value separately. Combine them into an opportunity or loss score, then adjust for intervention confidence.
- Findings: SMB, mid-market, and enterprise accounts can show different risk patterns. A single score may conceal those differences.
- Dollarized impact: Expected loss is more informative than contract value alone. The calculation should reflect churn probability and the revenue that could be retained through intervention.
- Remediation: Route high-value risks to customer success, billing risks to finance operations, and product-related risks to engineering.
- Measurable outcome: Track retained recurring revenue, save rate by intervention type, forecast accuracy, and the cost of each retention action.
Segmentation changes how teams allocate effort. The 2026 benchmark reports 31% annual logo churn for SMB accounts versus 8% for enterprise accounts, with SMB churn 3.9 times higher. It also reports 74% voluntary churn and 26% involuntary churn. (SaaS churn segmentation benchmark) Those figures support different operating paths: smaller accounts may need scaled education, while high-value accounts warrant focused human review. Voluntary cases often call for product or success intervention; involuntary cases may require payment recovery and billing action.
A churn-type field therefore belongs in the revenue model, alongside account value and renewal proximity. The resulting queue should show which accounts need attention, why they are exposed, and what retained revenue the proposed action could protect.
5. Cross-Functional Churn Root Cause Analysis
Churn rarely belongs to one department. Support may record a complaint, product may log a defect, and sales may hear a purchasing objection. Each record describes part of the account's experience. The analytical task is to connect those records to the same account, issue, feature, and renewal event.
The Slack example should be treated as a model for joining product, support, and sales intelligence, not as verified evidence about Slack's internal churn results. An analyst could connect issue-tracker records with customer conversations, usage avoidance, account plans, contract data, and cancellation reasons. That combined view separates broad dissatisfaction from a specific unresolved blocker.
A useful cross-functional review follows six evidence checks:
- Data sources: Product analytics, support tickets, sales notes, issue trackers, customer calls, contract data, and cancellation records.
- Methodology: Establish a shared account and issue taxonomy. Then test whether the same product problem appears in qualitative feedback and a measurable change in behavior.
- Findings: A recurring complaint has stronger root-cause support when customers mention it, avoid the related workflow, and later leave or downgrade.
- Dollarized impact: Aggregate recurring revenue exposed to each defect, missing capability, or service failure.
- Remediation: Connect the customer issue to an engineering ticket, assign a customer-success plan, and give sales an accurate explanation of the product gap.
- Measurable outcome: Monitor churn and downgrade rates among affected accounts, issue-resolution time, adoption recovery, and revenue retained after a release.
Evidence convergence protects teams from turning anecdotes into roadmap decisions. One forceful complaint may justify investigation, but it does not establish broad commercial impact. A quieter pattern across tickets, calls, and declining usage can represent greater risk than the most visible individual request.
The output should be a ranked root-cause register rather than a collection of departmental opinions. Each entry needs the affected cohort, observed behavior, customer language, revenue exposure, responsible owner, and next measurement point. This structure gives product and customer-success teams one working definition of the problem and a way to test whether their response changed the outcome.
Root-cause test: Do not stop at what customers said. Check whether the issue changed behavior and preceded a commercial event.
AI-driven product intelligence from SigOS describes an approach that combines support tickets, chat transcripts, sales calls, and usage metrics to identify patterns associated with churn and revenue impact. That capability could serve as an operating layer for teams moving cross-functional findings into product and customer-success workflows.
6. Behavioral Segmentation for Churn Prevention
Customer health changes through behavior before it appears in a renewal record. Industry, plan, and company size help with planning, but they do not show whether an account is returning less often, using one narrow workflow, failing to collaborate, or abandoning activation.
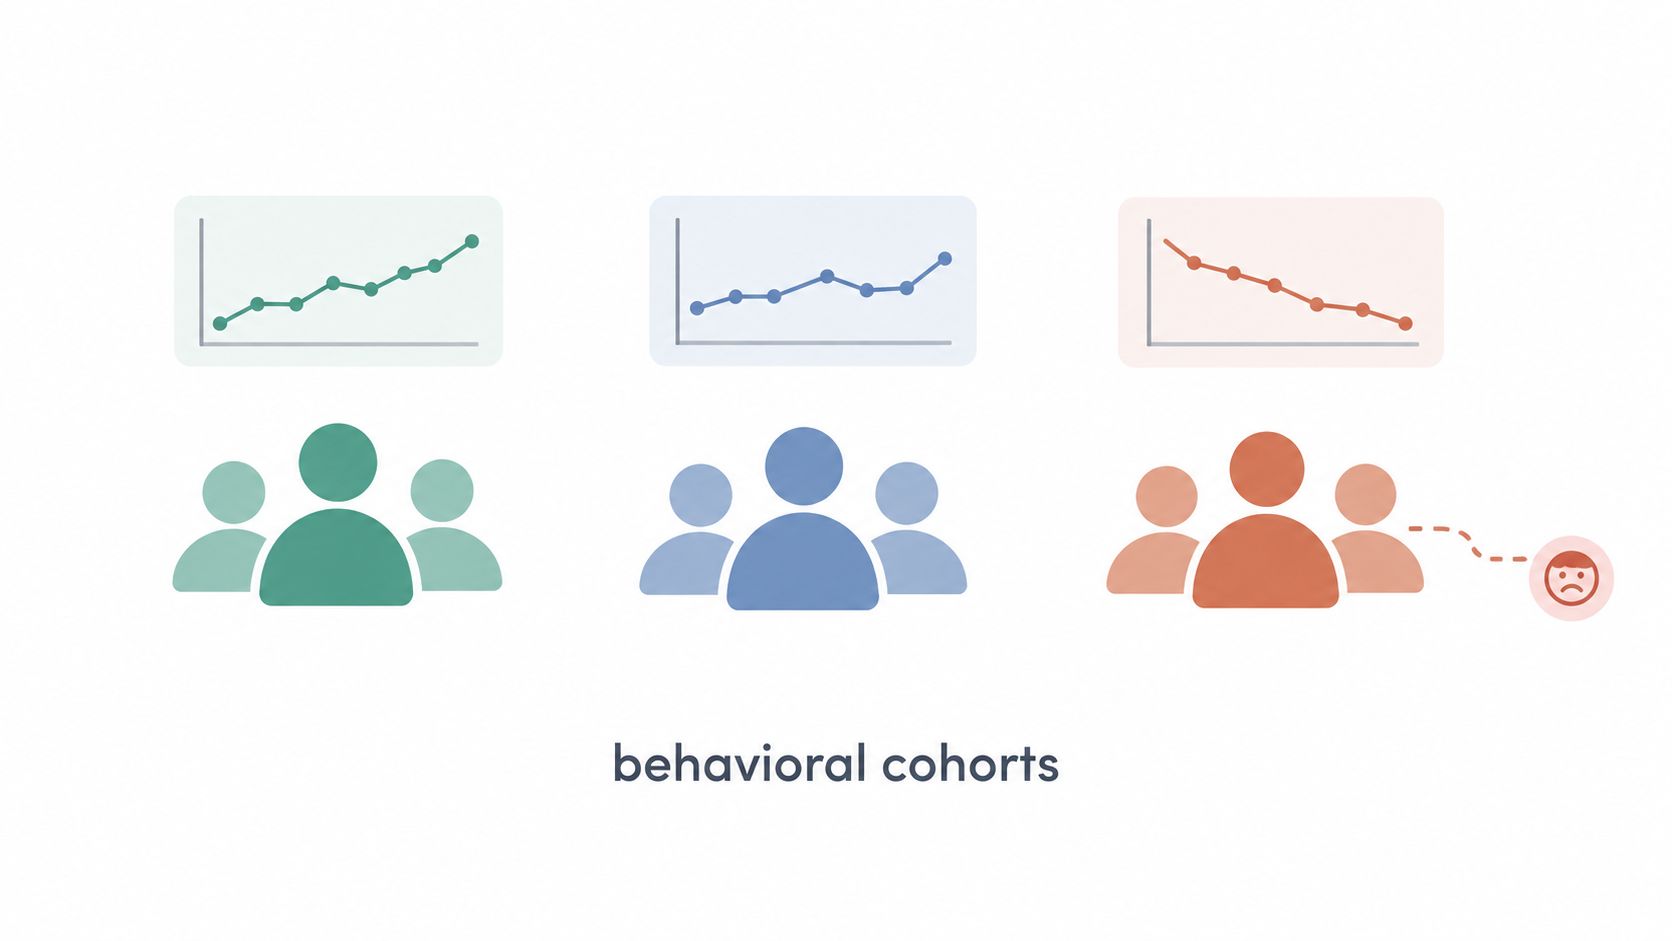
The Amplitude example is a behavioral framework, not verified evidence of Amplitude's internal churn results. A practical model can separate stable engagement, rising engagement, declining engagement, and dormant usage. Analysts should retain those labels only when historical comparisons show that the groups produce different renewal outcomes.
Start with the behavioral signal, then test its commercial meaning. The analytical lens should cover:
- Data sources: Session frequency, active users, feature breadth, collaboration events, workflow completion, support contacts, and renewal records.
- Methodology: Track changes over time, form behavior-based cohorts, and compare each cohort with later churn. A single low-usage snapshot is weaker evidence than a sustained shift.
- Findings: A declining trajectory may indicate more risk than low but stable usage. Modest activity can still support retention when it consistently produces customer value.
- Dollarized impact: Combine behavioral risk with account value. This ranks intervention work by potential revenue exposure and strategic importance.
- Remediation: Use in-app guidance for early disengagement, customer-success outreach for valuable accounts, and product education when customers have not reached a core outcome.
- Measurable outcome: Track engagement recovery, targeted-workflow adoption, renewal rate, and retained revenue for each behavioral cohort.
Lifecycle context changes the interpretation of churn. In the independent lifecycle churn study, a dataset of roughly 200,000 customers showed first-time buyers with churn above 75%, compared with about 25% among customers with at least four previous purchases. These thresholds should not be transferred directly to another business. The finding is more useful as a modeling principle: purchase history and customer maturity can separate risks that one aggregate churn rate hides.
The operating test is intervention quality. For a declining-engagement cohort, compare customers receiving an alert and targeted treatment with a comparable group receiving the usual process. Measure whether usage recovers, the intended workflow is adopted, and renewals or retained revenue improve. Without that comparison, segmentation only makes untargeted outreach more precise in appearance.
7. Proactive Customer Health Monitoring With AI Alerts
A customer health score has operational value only when it explains a change and triggers a recorded response. Customer-success managers need access to the signals behind the score, along with a way to determine whether an intervention prevented churn.
The Gainsight example is best used as a health-monitoring design pattern, not as a verified account of Gainsight's own outcomes. An effective score can combine product behavior, support themes, renewal timing, relationship activity, billing status, and expansion signals. Retaining those components matters because managers need to understand why an account's risk changed, rather than act on an unexplained composite value.
A practical alert system answers six questions:
- Data sources: Which product-usage, support-sentiment, renewal, payment, stakeholder-engagement, account-value, and expansion signals are available?
- Methodology: What is normal for each customer segment, and what change is large enough to alert the responsible team?
- Findings: Is the account consistently underusing the product, or has previously healthy behavior deteriorated? Those patterns call for different responses.
- Dollarized impact: What revenue is exposed, what might intervention cost, and which alerts have the greatest likely commercial value?
- Remediation: What action should the customer-success manager take, by when, and which operational owner should handle a billing failure or product blocker?
- Measurable outcome: Did the team respond quickly, did the health score recover, and did renewal outcomes or revenue saved improve?
The alert is only the start of the analysis. A telecom retention case reported that proactive strategies, including churn prediction and targeted offers, cut churn by 50% and increased renewal rates by 15% within the first year. It also reported that reactive save rates tripled after the process was operationalized. (telecom retention strategy case study) The commercial result came from connecting prediction to an operating workflow, not from scoring accounts alone.
Track prevention and recovery separately. An account that renews after a rescue intervention represents a different outcome from one whose risk never emerged. Separating those paths shows which signals support durable retention and which actions merely recover an account at the point of churn.
Churn Analysis Case Studies, 7-Point Comparison
| Approach | Implementation Complexity 🔄 | Resource Requirements ⚡ | Expected Outcomes 📊 | Ideal Use Cases 💡 | Key Advantages ⭐ |
|---|---|---|---|---|---|
| Predictive Churn Modeling (Stripe) | High, complex ML pipelines, continuous retraining 🔄 | High, large historical datasets, data engineers, compute ⚡ | Early detection (6‑month lead), prioritized retention, measurable ROI 📊 | High‑transaction SaaS & revenue‑critical segments 💡 | Quantifies financial impact; multi‑signal prediction; enables early intervention ⭐ |
| Support Ticket Sentiment Analysis (Intercom) | Medium‑High, NLP, preprocessing, multilingual tuning 🔄 | Medium, labeled tickets, model maintenance, privacy controls ⚡ | Flags emotional deterioration and escalation patterns; early warnings 📊 | Support‑heavy products where conversations drive retention 💡 | Captures emotional signals missed by metrics; enables empathy‑based outreach ⭐ |
| Product Usage Cohort Analysis (HubSpot) | Medium, event instrumentation and cohort tracking 🔄 | Medium, analytics tooling, event tracking, analysts ⚡ | Correlates feature adoption with retention; informs onboarding changes 📊 | Product‑led growth and onboarding optimization 💡 | Directly ties feature usage to retention; guides roadmap prioritization ⭐ |
| Revenue Impact Scoring (Salesforce) | High, cross‑system integrations and financial models 🔄 | High, CRM, billing, product analytics, finance inputs ⚡ | Quantifies revenue at‑risk and forecasts leakage by segment 📊 | Enterprise/ARR‑focused companies and revenue ops 💡 | Prioritizes high‑impact accounts; aligns CS/product/rev teams around dollars ⭐ |
| Cross‑Functional Root Cause Analysis (Slack) | High, data integration + cross‑team processes & governance 🔄 | High, many integrations, coordinated workflows, change management ⚡ | Identifies true root causes across product/support/sales; enables targeted fixes 📊 | Mature orgs solving systemic churn drivers across teams 💡 | Finds root causes not symptoms; breaks silos and drives accountable fixes ⭐ |
| Behavioral Segmentation (Amplitude) | Medium, continuous instrumentation and segment maintenance 🔄 | Medium, event tracking, ML/analytics resources ⚡ | Dynamic cohorts with high predictive power for churn risk; enables in‑app intervention 📊 | Engagement‑focused products needing real‑time targeting 💡 | More predictive than firmographics; enables targeted, behavioral interventions ⭐ |
| AI‑Driven Health Scoring (Gainsight) | High, many signals, explainability, model tuning 🔄 | High, 50+ data inputs, integrations, CS process changes ⚡ | Single consolidated health metric with real‑time alerts; proactive prevention 📊 | Customer success teams managing many accounts (enterprise) 💡 | Consolidates signals into actionable score; prioritizes CS outreach; real‑time alerts ⭐ |
Key Takeaways Turning Churn Analysis Into a Daily Operating Habit
The strongest churn analysis case study isn't the one with the most complex model. It's the one that connects a reliable signal to a decision, an owner, and an outcome. The evidence above points to a repeatable operating system.
First, combine signal types. Product behavior can show that engagement changed, but support language may explain why. Billing data can identify involuntary churn that product teams can't solve. Contract and account data show which risks deserve immediate human attention. The 2026 SaaS benchmark makes this distinction especially important because it separates voluntary churn from involuntary churn and shows that risk differs sharply between SMB and enterprise accounts. (2026 SaaS churn benchmark)
Second, design cohorts before designing interventions. A first-time buyer, a mature account, an enterprise customer, and a small business shouldn't automatically receive the same threshold or message. The independent lifecycle analysis found a wide difference between first-time buyers and customers with a longer purchase history, while its modeling work showed that activity-only data could miss useful transactional patterns. (independent churn case study)
Third, dollarize every signal. Probability helps prioritize, but expected revenue exposure helps teams decide what to do. A product defect, failed payment, unresolved support issue, and weak activation path require different owners. The score should preserve that distinction instead of collapsing every risk into one color.
Fourth, close the loop. Link churn findings to customer-success tasks, billing recovery, support processes, and engineering tickets. Record whether the customer received an intervention, whether behavior recovered, and whether the account renewed. The telecom cases show why operationalizing a model matters, but the classic experiment shows why teams must test the treatment rather than assume that outreach is beneficial.
Finally, stop treating retention as a quarterly retrospective. A daily view should surface emerging behavior changes, unresolved feedback themes, renewal exposure, and the highest-value actions. For teams still moving data between spreadsheets, automated pattern detection and revenue impact scoring are the natural next step. SigOS is one relevant option for this workflow, with a stated focus on combining feedback and usage signals to identify churn-related patterns and prioritize them by business impact.
SigOS can ingest support tickets, chat transcripts, sales calls, and usage metrics to connect customer feedback with churn risk and revenue exposure. Visit SigOS to see how automated issue ranking and workflow integrations can help your product, support, and revenue teams turn churn analysis into daily action.


Ready to find your hidden revenue leaks?
Start analyzing your customer feedback and discover insights that drive revenue.
Start Free Trial →