Saas Product Metrics: The Complete Guide to What Matters
Master essential SaaS product metrics. Learn definitions, formulas, and actionable strategies to reduce churn and drive revenue growth with our 2026 guide.
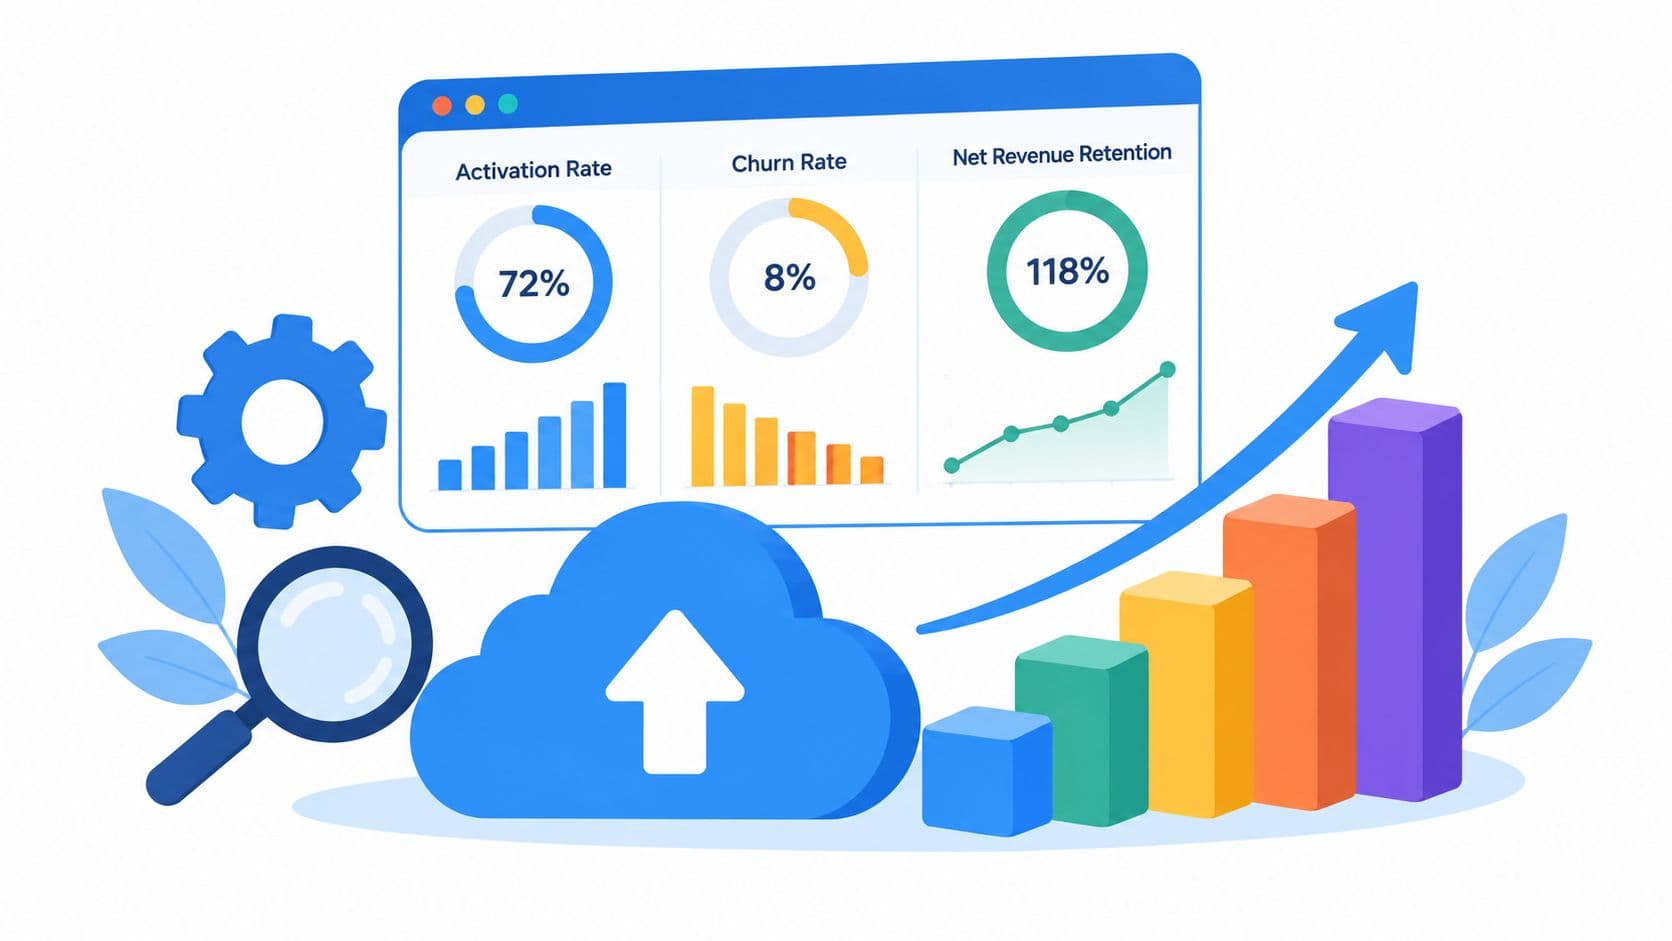
Median monthly churn rose to 4.7% in 2026, while median Net Revenue Retention compressed to 104%, signaling a critical need for actionable product metrics. Those figures mean product teams can't rely on feature usage or signup volume alone to explain whether revenue is becoming more durable.
The counterintuitive problem is that a product can show healthy engagement while its commercial position weakens. Users may open a dashboard, trigger a workflow, or adopt a feature, yet still fail to reach the value that supports renewal, expansion, or a larger contract. The job of SaaS product metrics is to connect those behavioral signals with financial outcomes, so product leaders can answer the questions boards ask: Which accounts are at risk, where can expansion come from, and which product problems are affecting revenue?
The Current State of SaaS Metrics
Feature activity is not revenue health. SaaS companies collect more behavioral data than ever, yet the measurement problem remains. Signups, sessions, feature events, support interactions, renewals, upgrades, and cancellations often sit in separate systems. Without links between those events, a dashboard records activity without showing which actions affect retention or revenue.
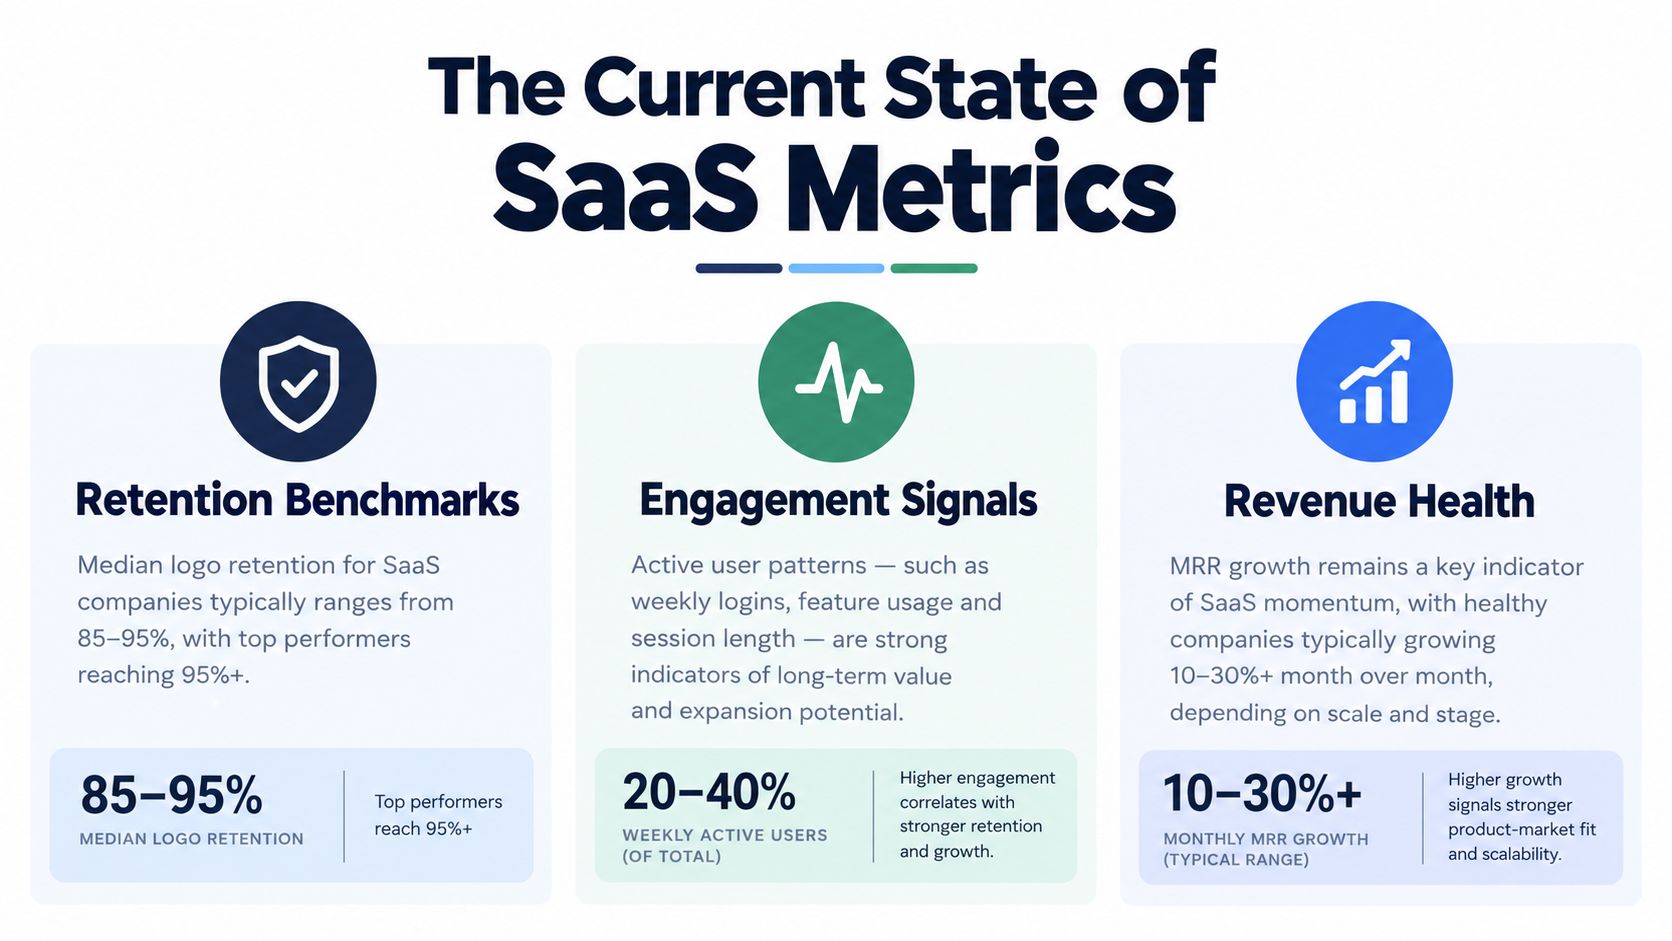
Recent benchmarks expose the gap. One 2026 analysis reported median monthly churn of 4.7%, up from 3.8% in 2024, median Net Revenue Retention falling from 112% in 2022 to 104% in 2026, SMB annual logo churn of 31% versus 8% for enterprise, voluntary churn representing 74% of total churn, involuntary churn representing 26%, and reactivation declining from 11.2% in 2022 to 6.4% in 2026 (2026 SaaS churn benchmark analysis). The pattern is commercially significant: churn is increasing while expansion offsets less of the lost revenue.
Why averages conceal commercial risk
A company-wide median shows direction, not diagnosis. Segment differences can change the product response. A blended churn rate may conceal concentrated risk in a customer tier, plan, use case, or onboarding path. The SMB and enterprise gap in the benchmark illustrates why product leaders should segment engagement and retention before assigning a single health score to the entire customer base.
The distinction between voluntary and involuntary churn also changes the intervention. An account that leaves after failing to realize value may require product, onboarding, or customer success work. An account lost through payment failure requires an operational remedy. Reactivation trends add another signal: fewer returning customers can indicate that former users are finding less reason to come back.
Board-level implication: Retention is an outcome, not an explanation. Product teams need the behavioral and operational causes beneath it to decide what to build, fix, or escalate.
From engagement reporting to revenue intelligence
Feature adoption becomes strategically useful only after the team connects it to a commercial event. Customers who complete a core workflow may renew more often, expand into another plan, or generate fewer support issues. That workflow can serve as a leading indicator of realized value. High usage can also indicate distress if customers repeatedly interact with a feature while trying to solve an unresolved problem before cancellation.
A useful metric stack links four evidence types:
- Behavioral evidence, including completion of a core action and repeated use of a valuable workflow.
- Account evidence, including plan, segment, contract status, renewal timing, and expansion history.
- Revenue evidence, including churn, contraction, reactivation, and expansion.
- Explanatory evidence, including support conversations, sales objections, and customer feedback.
This structure separates user growth from account value. Leadership can then ask whether revenue is rising because the company acquired more users, or because existing customers receive enough value to stay and expand.
Essential SaaS Product Metrics Explained
The most useful SaaS product metrics describe a sequence. A prospect becomes a user, the user reaches value, the account adopts repeatable workflows, and the customer either renews, expands, contracts, or leaves. Tracking one stage without the others encourages teams to optimize locally while revenue deteriorates elsewhere.
Activation measures the first credible value moment
Activation rate is the share of new signups that reach the product's first value milestone. The formula is:
Activated users ÷ total new users × 100
The milestone must represent meaningful value, not a superficial event such as opening a welcome email. A collaboration product might define activation as completing a shared workflow, while an analytics product might use the creation of a useful report. The event should be measurable and plausibly connected to later conversion or retention.
A canonical B2B SaaS benchmark places activation at about 35% from finished signup to activated, while complex enterprise products may view 40% to 60% as strong, and simpler self-serve tools can exceed 80% (Metabase guide to product metrics). Those ranges aren't universal targets. They show why teams must define activation around product complexity, customer type, and the time required to reach value.
Churn counts loss, while NRR explains revenue durability
Customer churn rate measures lost customers over a defined period:
Customers lost ÷ customers at the start of the period × 100
Revenue churn measures the recurring revenue lost through cancellations or downgrades. It can reveal a more serious commercial problem than logo churn when a small number of large accounts represent substantial revenue.
Net Revenue Retention, or NRR, starts with the revenue from an existing customer group and includes expansion, contraction, and churn:
(Starting recurring revenue + expansion − contraction − churn) ÷ starting recurring revenue × 100
NRR excludes new customer revenue. That makes it useful for answering whether the installed base is becoming more valuable on its own. A product can acquire customers quickly while existing accounts shrink. NRR exposes that weakness more directly than top-line growth.
Feature adoption needs a revenue denominator
Feature adoption is usually calculated as the number of relevant customers who use a feature divided by the number of eligible customers. That ratio becomes more informative when paired with revenue or retention. Teams should ask whether adoption is concentrated among high-value accounts, associated with expansion, or limited to users who never convert.
Cohort analysis adds the missing time dimension. Comparing adoption by signup cohort, plan, segment, or use case can reveal whether a feature creates durable behavior or only a short-lived burst. To separate customer behavior from billing artifacts, teams should also analyze churn by reason rather than treating every cancellation as evidence of weak product value.
For a deeper treatment of event design, funnels, cohorts, and behavioral analysis, product teams can use this guide to SaaS product analytics. The objective isn't to maximize every metric. It's to identify which product events predict an outcome the business cares about, then measure that relationship consistently.
How to Instrument and Validate Metrics
A metric becomes trustworthy when two conditions hold. The event is captured accurately, and the metric has a demonstrable relationship with a business outcome. Instrumentation without validation produces precise numbers that may describe the wrong behavior.
Start with an event contract
Write an event contract before adding tracking code. Each event should specify its name, actor, account, timestamp, object, properties, and eligibility rules. For example, “report created” needs a definition that distinguishes a saved, usable report from an abandoned draft. Without that distinction, activation can rise because the tracking system counts activity that customers don't experience as value.
Define identity rules across the product and revenue systems. A user can belong to an account, switch devices, invite colleagues, or use multiple workspaces. If those relationships aren't modeled consistently, product events won't join cleanly to plans, contracts, renewals, or expansion.
A practical instrumentation sequence looks like this:
- Define the business question. Start with “Which behavior predicts renewal or expansion?” rather than “Which events can we collect?”
- Name the value event. Choose the smallest observable action that indicates a customer has reached meaningful value.
- Record context. Capture plan, segment, account, role, acquisition source, and product area where those fields are available and appropriate.
- Create a data dictionary. Document event definitions, owners, allowed values, and known limitations.
- Test edge cases. Check duplicate events, retries, deleted accounts, imports, failed payments, and changes in account ownership.

Validate against outcomes, not intuition
Teams often select an activation event because it sounds strategically important. Validation requires comparing users who performed the event with users who did not, while controlling for cohort, plan, segment, and observation window. The question is whether the behavior consistently precedes a meaningful difference in conversion, retention, expansion, or support burden.
Use time windows that match the customer journey. An onboarding signal may matter shortly after signup, while an expansion signal may require sustained usage across a contract period. Don't compare a newly acquired cohort with an older cohort whose customers have had more time to renew.
Data quality deserves its own operating process. Teams should monitor missing events, schema changes, identity mismatches, late-arriving records, and differences between billing totals and revenue dashboards. This data quality concerns guide provides useful context for the problems that can undermine otherwise well-designed reporting.
Validation rule: If a metric changes but no customer, account, or revenue outcome changes with it, treat the metric as a hypothesis rather than a performance indicator.
Common Pitfalls in SaaS Metric Tracking
The most dangerous metric is not an incorrect number. It's a correct number that encourages the wrong decision.
Feature-level engagement creates this risk because activity feels close to value. A rising count of sessions, clicks, or active users can reassure a product team while customers remain unable to complete the workflow that justifies renewal. The gap between feature engagement and revenue outcomes remains a major weakness in SaaS measurement practice, especially when dashboards stop at signups, activation, churn, and retention without connecting behavior to expansion, revenue predictability, or deal risk (analysis of the SaaS product metrics gap).
Vanity metrics and misleading growth
A vanity metric usually has three characteristics: it is easy to increase, difficult to interpret, and weakly connected to a decision. Total signups can rise because acquisition quality changed. Daily activity can rise because customers are struggling with a process. Feature usage can rise among free users while paid accounts remain inactive.
Replace the question “Did usage increase?” with a more precise set of questions:
- Who used the feature? Separate trial users, active customers, administrators, and end users.
- What happened afterward? Check conversion, renewal, expansion, support volume, or cancellation.
- Which accounts changed? Look at account-level distributions instead of only a company-wide average.
- What decision follows? If no action would change regardless of the result, the metric may not deserve dashboard space.
Cohort censoring and growth masking
Cohort censoring occurs when recent customers haven't had enough time to experience the outcome being measured. A young cohort may appear to have low churn because its renewal window hasn't arrived. Mark incomplete observation periods clearly, and compare cohorts only when they have comparable exposure.
Growth can also mask churn. New customers may offset cancellations in total revenue, leaving leadership with a stable topline while the existing base deteriorates. Separate new business from expansion, reactivation, contraction, and churn so the dashboard shows which movement created the result.
Payment failures create another reporting trap. Involuntary churn can look like product dissatisfaction, while a reactivated account can look like a successful retention intervention even when the original problem was billing. Classification should happen before interpretation.
A useful test: Every metric review should identify the segment, cohort, and revenue movement that the aggregate number hides.
Prioritizing Metrics for Maximum Impact
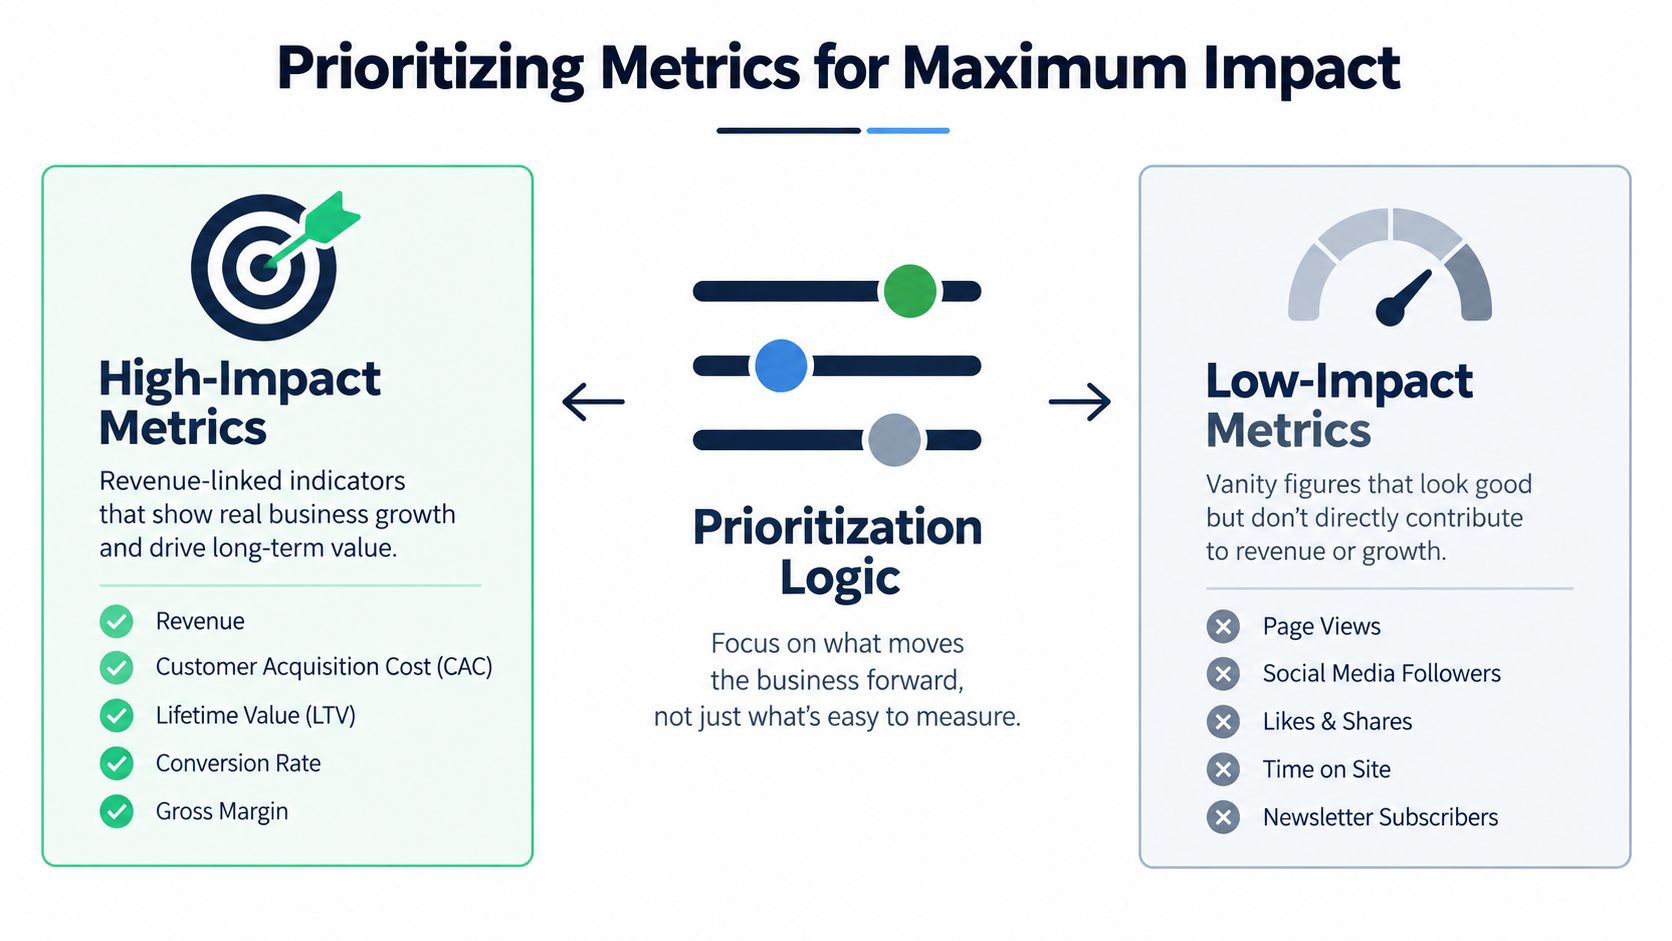
Teams don't need more metrics. They need a defensible way to choose the few that can change a commercial decision.
Start with the board-level question, then work backward to the product behavior. If leadership needs more predictable renewals, the product team should investigate the behaviors that precede renewal risk. If the priority is expansion, it should identify workflows associated with broader adoption, higher plan fit, or additional use cases. This approach prevents teams from selecting metrics because they are available rather than because they are useful.
A four-part prioritization test
1. Decision relevance. Can a change in the metric trigger a product, customer success, pricing, or sales action? If not, classify it as context rather than a primary metric.
2. Revenue proximity. Does the metric sit close to churn, contraction, expansion, or renewal? A core workflow completed by a paying account usually offers more commercial insight than a general session count.
3. Diagnostic value. Can the team identify why the metric moved? A useful metric should support segmentation by plan, account, role, cohort, use case, or reason.
4. Operational ownership. Does a named team have the authority and capacity to respond? A metric without an owner becomes a recurring discussion rather than an operating mechanism.
Segment before setting targets
NRR demonstrates why segmentation should come before target-setting. One 2026 analysis of 105 public SaaS companies reported median NRR of 122%. Another benchmark set found NRR ranging from **88% for companies with under-****500 ACV accounts to 122% for strategic **100K-plus accounts. In that dataset, monthly logo churn ranged from 6.2% in the lowest ACV band to 0.4% in the highest (2026 customer churn statistics and benchmarks).
Those differences make a single company-wide target potentially misleading. A self-serve product, an enterprise workflow, and a strategic account motion have different adoption paths, contract structures, and expansion opportunities. The right question isn't whether every segment reaches the same metric value. It's whether each segment has a clear relationship between product behavior and the commercial outcome it is expected to produce.
For a revenue-focused operating model, rank metrics by their ability to explain movement in the existing base. Put activation ahead of broad traffic when onboarding is the constraint. Put core workflow adoption ahead of raw feature clicks when expansion depends on a specific use case. Put account-level risk signals ahead of aggregate engagement when renewal exposure is concentrated.
Dashboard Examples and Actionable Steps
A useful dashboard should help a team decide what to do before it helps the team admire the data. The strongest design separates three views: the health of new users, the behavior of existing accounts, and the revenue movement that results.
The acquisition and activation view
This dashboard should follow a new user from completed signup to first value. Show the activation event, time to that event, completion by segment, and the point where users abandon the path. The product manager can then connect an onboarding change to an observable behavioral shift without confusing traffic volume with product value.
Include a cohort view rather than only a current-period average. A cohort table can show whether customers who activated through a particular workflow later adopted the product more broadly. It can also reveal whether an apparent improvement came from a change in customer mix rather than a better onboarding experience.
The account health view
The account dashboard should combine product behavior and commercial context. Useful fields include:
- Core workflow adoption, segmented by account and plan.
- Recent change in usage, compared with the account's own history.
- Open product or support issues, grouped by problem type.
- Renewal and expansion context, including upcoming commercial decisions.
- Reason-coded risk, separating product friction, missing capability, billing failure, and organizational change.
Avoid labeling an account “healthy” because one user remains active. Account-level health should reflect whether the customer is achieving the use case tied to its purchase and whether the relevant stakeholders continue to receive value.
The revenue movement view
The executive view should reconcile opening recurring revenue with new business, expansion, reactivation, contraction, and churn. Product data belongs beside that bridge when it explains why an account moved. A feature adoption trend has strategic value when leadership can see that the feature is associated with expansion or appears repeatedly in accounts that later contract.
Teams designing a broader reporting system can use these principles when building a Creem dashboard and metrics. For product-specific reporting, this resource on a product analytics dashboard provides a useful model for bringing behavioral indicators into one operating view.
The action loop should stay concrete:
- Find the movement. Identify the segment, cohort, or account group responsible for the change.
- Find the behavior. Compare successful and unsuccessful accounts around the relevant workflow.
- Find the explanation. Review feedback, support issues, sales context, and billing status.
- Assign the intervention. Choose a product fix, onboarding change, customer success action, or billing correction.
- Recheck the outcome. Measure whether the intervention changed the commercial result, not merely the event count.
Product intelligence platforms can complement analytics tools here. SigOS connects usage data with customer feedback and revenue signals, helping teams identify patterns associated with churn or expansion and assign revenue-impact scores to product issues. The platform's purpose in this workflow is to help teams prioritize evidence across support, sales, and product systems rather than treating each source as a separate queue.
Conclusion - The Path to Metric-Driven Success
SaaS product metrics become strategically valuable when they connect what customers do with what revenue does next. Activation shows whether new users reach value, feature adoption shows whether customers use the capabilities they bought, and churn and NRR reveal whether that value lasts and expands.
The answer isn't a larger dashboard. It's a smaller set of validated metrics, segmented by customer context and tied to explicit decisions. Instrument the events that represent value, test them against retention and expansion outcomes, separate reporting artifacts from real product problems, and give each signal an owner.
Start with one revenue question this week, such as why a segment contracts or which workflow precedes expansion. Trace that question through product behavior, account context, and customer feedback, then turn the result into one measurable intervention.
SigOS helps product and growth teams connect activation, feature adoption, retention, churn, and revenue signals with customer feedback so they can prioritize the product issues most likely to affect commercial outcomes. Visit SigOS to see how your team can turn fragmented product intelligence into focused action.



Ready to find your hidden revenue leaks?
Start analyzing your customer feedback and discover insights that drive revenue.
Start Free Trial →