How to Identify Product Opportunities That Actually Convert
Learn how to identify product opportunities using real signals, not opinions. A practical guide for SaaS product teams to find, validate, and prioritize what

Most advice on how to identify product opportunities starts with brainstorming. That's backwards. The expensive mistake isn't failing to generate ideas, it's treating every request as equal and then shipping the loudest one.
Customer feedback matters, but teams often collect it inconsistently. In the 2026 State of Product Management Report, 54.9% of product professionals said customer needs and user insights strongly influence product strategy, while only 34% said their teams continuously collect feedback to guide prioritization, according to Quackback's report on product feedback. The result is a backlog full of plausible ideas, weak evidence, and features that solve neither a serious customer problem nor a material business risk.
A better workflow connects three things: the customer outcome, the behavior proving the pain exists, and the revenue segment affected. That combination tells you which opportunity deserves discovery, which needs validation, and which should be ignored.
Why Most Product Opportunities Are Missed
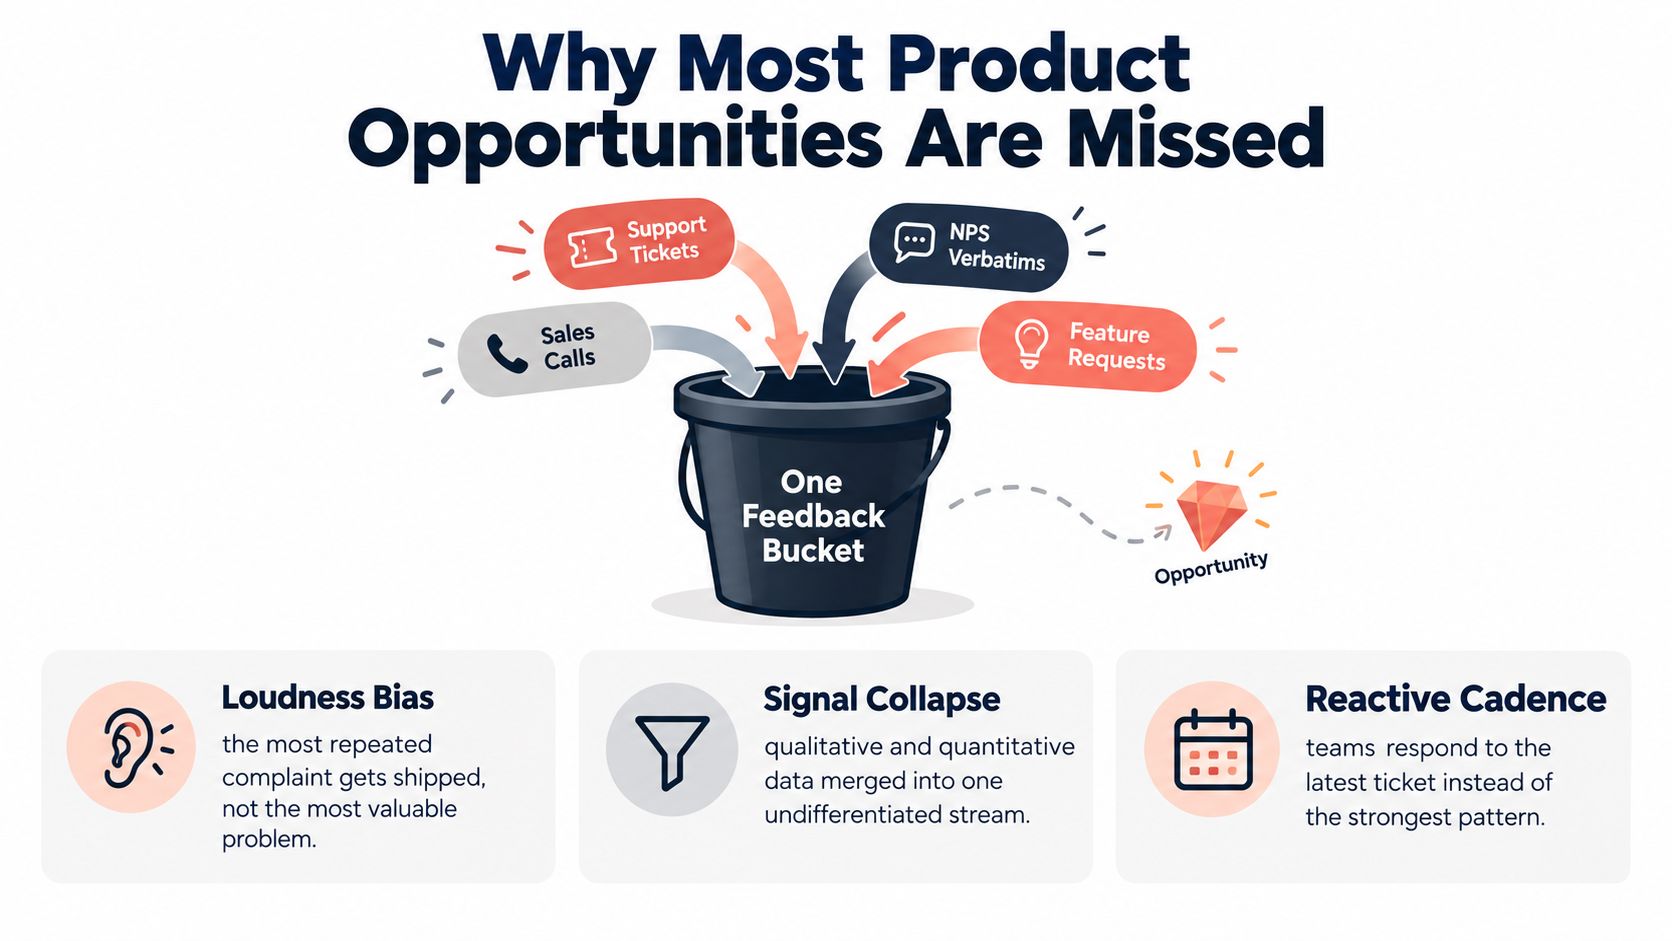
The comfortable story is that product teams miss opportunities because they need more ideas. In practice, they miss them because they put every signal into one feedback bucket and let volume decide.
A request from a churned customer gets treated like a request from a power user. A sales executive's promise to a prospect competes with repeated onboarding failures in product analytics. A senior stakeholder's preference can outweigh dozens of quiet customers who never submit a ticket but abandon the same workflow every week.
That creates loudness bias. The most repeated complaint gets attention, even when it comes from a small or low-value segment. Meanwhile, a less dramatic problem may be blocking expansion, increasing support load, or preventing a strategic account from adopting the product.
Usage exposes the cost of opinion-led roadmaps
The usage pattern is harsh. The same Quackback report says 80% of features in the average software product are rarely or never used, while 6.4% of launched features drive 80% of click volume. Those figures point to a clear product lesson: adding more features isn't the same as creating more value.
The opportunity isn't always a new module. It may be a confusing setup step, an underused capability that needs better discoverability, or a workflow that works for small accounts but fails for larger ones. Teams that only count requests won't see those opportunities clearly.
Practical rule: Never promote a request into discovery until you can name the customer outcome, the affected segment, and the evidence that the problem is costly.
Replace the feedback bucket with a qualification model
A qualified opportunity needs three scores:
- Outcome score: How important is the result to the customer, and how poorly does the current product deliver it?
- Revenue exposure: Which accounts, renewals, expansion paths, or acquisition opportunities are affected?
- Confidence: How many independent signals support the hypothesis, and do qualitative and behavioral evidence agree?
This is also where product discovery connects to commercial strategy. Teams that need to understand how demand is created outside the product can use this DTC demand generation guide as a useful reference for connecting audience needs with growth activity.
The difference is simple. A VP-requested dashboard redesign may sound strategic, but a recurring workflow failure tied to expansion risk deserves priority even if fewer customers complain about it. Your roadmap should reflect economic pain and customer urgency, not organizational volume.
Mapping Outcomes Before You Brainstorm Solutions
Start with the job, not the feature. A persona such as “enterprise administrator” is too broad to guide opportunity discovery. The useful question is what that person is trying to accomplish in a specific situation.
Write the job as an outcome statement:
Help me produce a client-ready performance report quickly, without manual formatting or repeated exports.
That statement describes a result. “Add PDF export” describes a solution, and solution-shaped language narrows your thinking before you understand the problem.
Build the opportunity surface
Use this sequence:
- Define the job for a segment. Specify who experiences the situation and when it happens. Keep the segment commercially meaningful, such as accounts approaching expansion or customers with a high-support workflow.
- List desired outcomes. Describe measurable results, such as completing a task without assistance, reducing rework, or delivering an output within an acceptable time.
- Measure importance and satisfaction. Ask customers to rate each outcome on a 1 to 10 scale, then compare how important the outcome is with how satisfied they are today. This importance-satisfaction method is described in Productboard's opportunity scoring framework.
- Weight the gap by commercial value. A severe problem in a high-expansion segment should outrank an equally frustrating problem in a segment with little strategic value.
A commonly used score is:
Opportunity Score = Importance + max(Importance - Satisfaction, 0)
For revenue-first prioritization, extend it:
Weighted Opportunity Score = (Importance + max(Importance - Satisfaction, 0)) × Segment Weight
Here, segment weight can represent annual contract value or expansion potential. Keep the unit consistent so the score supports comparison rather than creating false precision.
Worked example
An analytics product has two possible improvements. Customers rate “exporting a report to PDF in under 30 seconds” at 9 for importance and 3 for satisfaction. The gap is 6. With a $50k segment weight, the weighted score is 750.
A dashboard redesign scores 7 for importance and 4 for satisfaction, producing a gap of 3. With a $31k segment weight, its weighted score is 310.
| Outcome | Importance | Satisfaction | Gap | Segment Weight ($K) | Opportunity Score |
|---|---|---|---|---|---|
| Export a report to PDF in under 30 seconds | 9 | 3 | 6 | 50 | 750 |
| Find key dashboard metrics faster | 7 | 4 | 3 | 31 | 310 |
The export problem wins because it combines high importance, poor current satisfaction, and valuable accounts. Don't let the formula make the decision for you. Use it to make the trade-off visible, then validate the top opportunities with broader customer research before committing engineering capacity.
Reading Qualitative Feedback and Quantitative Behavior
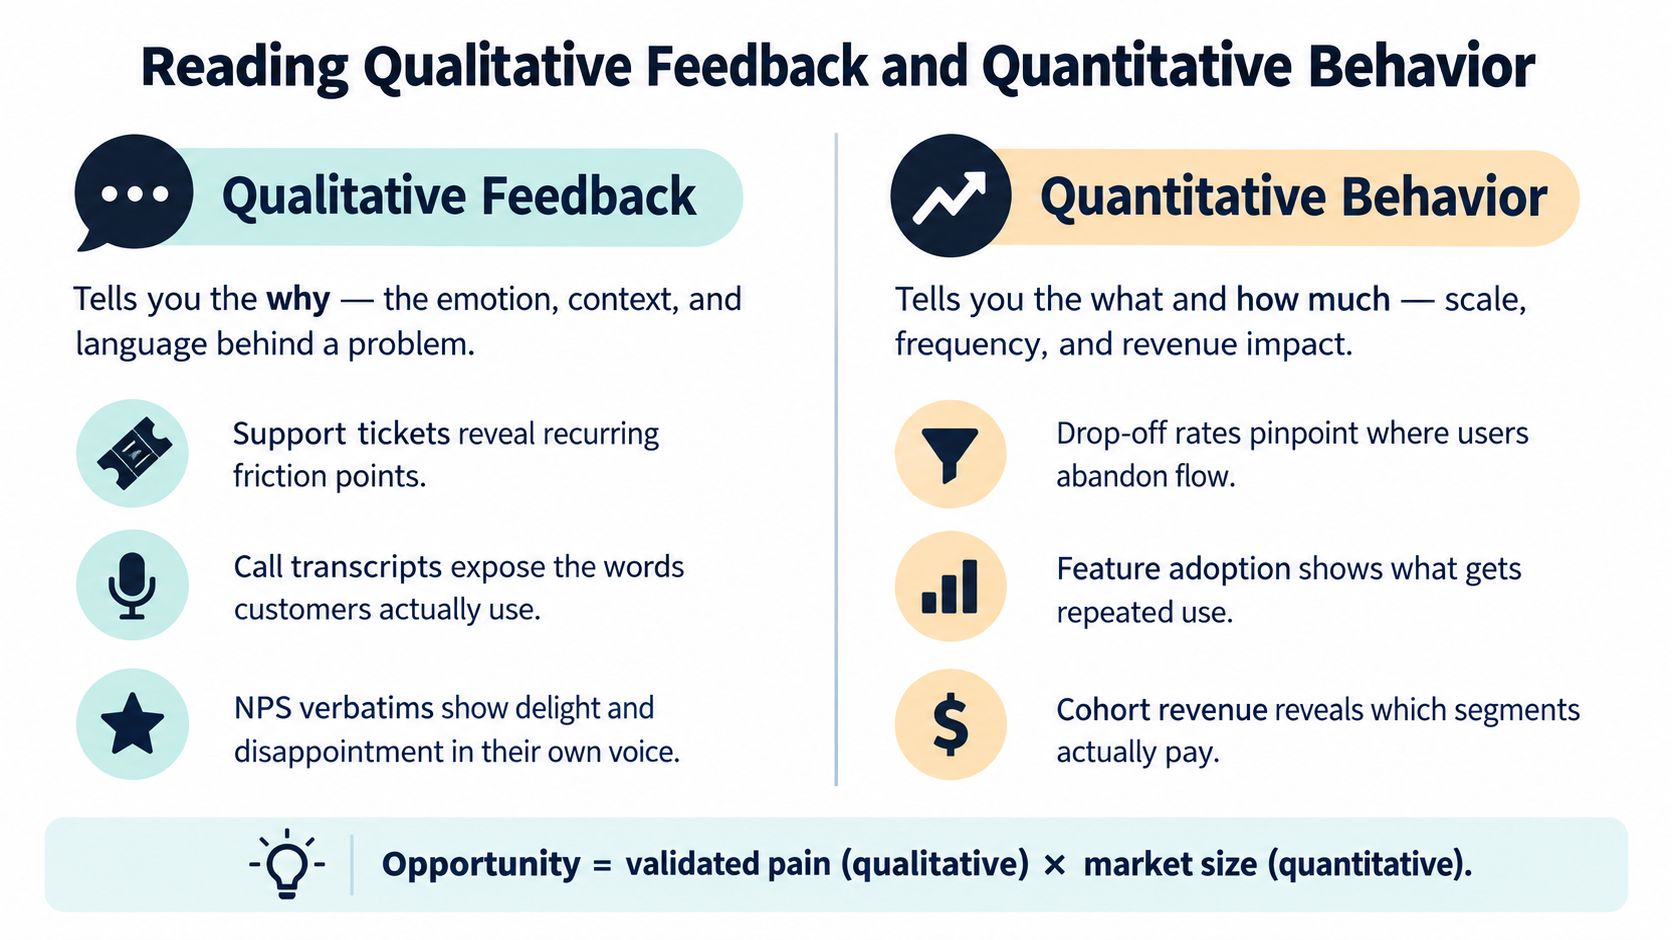
Qualitative and quantitative evidence answer different questions. Mixing them too early produces a tidy dataset that hides the distinction between why customers struggle and how often the struggle affects behavior.
Support tickets, call transcripts, sales notes, NPS verbatims, app reviews, and Gong calls reveal language and context. They show whether a problem creates anxiety, forces a workaround, blocks a purchase, or annoys someone during an occasional task.
Behavioral data shows what happens at scale. Click paths, feature usage frequency, time-to-value, activation drop-offs, expansion patterns, and churn cohorts reveal whether customers encounter the problem and what they do next.
Keep the evidence columns separate
| Signal type | What it reveals | Common mistake |
|---|---|---|
| Qualitative feedback | Why the problem hurts and how customers describe it | Treating a small number of vocal users as the whole market |
| Quantitative behavior | Frequency, scale, adoption, and segment patterns | Treating correlation as proof of causation |
| Revenue data | Commercial exposure and account importance | Counting account value without confirming the product problem |
Qualitative evidence is rich in intent but limited in volume. Customers who write in aren't a random sample. Quantitative evidence is broad but often ambiguous. A drop-off can identify where users struggle, but it can't tell you whether the cause is confusing copy, missing permissions, poor performance, or an unrelated business process.
A strong opportunity joins both sides. For example, suppose an onboarding funnel shows 40% of enterprise administrators abandoning at step three, and three support tickets say, “I gave up because SSO setup was unclear.” The behavioral signal establishes scale. The tickets provide a plausible cause and the customer's own framing. The percentage claim must be checked against the qualitative-to-quantitative research workflow, while the tickets still need direct review before you label the opportunity validated.
The combination should produce a hypothesis, not a conclusion. Interview affected customers, inspect session recordings where appropriate, and test whether the proposed fix changes the relevant behavior.
A hypothesis needs at least one qualitative signal and one quantitative signal before it earns a priority score.
Screening Opportunities With Practical Heuristics
Most backlogs contain ideas that sound good in a meeting and collapse during a build-versus-buy review. A five-minute screen removes much of that waste before discovery work begins.
Ask five questions.
Run the five-question screen
**Does this serve a real job-to-be-done?**Pass if you can describe the situation, desired outcome, and affected user. Fail if the request is only “make the product feel more modern” or “add what competitors have.”
**Can you name at least three paying accounts that would notice?**Pass when account teams can identify specific customers or prospects with the problem. Fail when the evidence is “the market probably wants it.”
**Does the capability already exist under another name?**Pass if the gap is purely functional. Fail if customers can't find, configure, or understand an existing capability. Improving discoverability may be cheaper and more valuable than building a duplicate.
**What revenue is at risk if nothing changes for two more quarters?**Pass when customer success or sales can describe renewal, expansion, or acquisition consequences. Fail when the request has no identifiable commercial consequence and no meaningful usage evidence.
**Is the user also the buyer or an important decision-maker?**Pass when the workflow affects the person who adopts, renews, expands, or influences the account. Fail when the team is optimizing a low-impact user preference while ignoring the economic buyer's constraint.
Consider a SaaS request for advanced approval routing. A sales executive calls it a deal blocker, but account research shows the prospect already uses an external approval tool, existing customers rarely use the current routing capability, and no renewal is tied to the request. The idea fails the screen. A smaller improvement to permission clarity, backed by repeated setup failures and expansion accounts, deserves more investigation.
| Opportunity Source | Typical Failure Mode | Screening Heuristic |
|---|---|---|
| Churn complaints | The request reflects one exit conversation rather than a recurring pattern | Compare the complaint with churn cohorts and retained accounts |
| Executive requests | Authority substitutes for customer evidence | Require a named job, affected segment, and behavioral signal |
| Sales blockers | The request may be a negotiation tactic or bespoke requirement | Confirm multiple qualified accounts and the commercial consequence |
| Support tickets | Volume reflects reporting habits, not necessarily business impact | Group by workflow, segment, recurrence, and account value |
Don't confuse screening with rejection. A failed screen means the idea shouldn't enter the priority queue yet. Ask the requester for evidence, run a targeted interview, or find the existing workflow before spending design and engineering time.
Prioritization Frameworks Worth Knowing
Frameworks prevent circular arguments, but they don't replace judgment. The right choice depends on whether you're making a quick tactical decision, comparing a major cross-functional bet, or defending a roadmap against financial scrutiny.
RICE uses reach, impact, confidence, and effort. It creates a structured comparison and forces teams to acknowledge uncertainty. Its weakness is that a large user pool can overpower a severe problem affecting fewer, high-value accounts.
ICE uses impact, confidence, and ease. It's faster and useful for weekly grooming, but the scores can become subjective when teams don't share definitions for impact or confidence.
Outcome-based prioritization starts with a measurable customer and business result, such as retention, expansion, time-to-value, or support reduction. It takes more discipline, but it gives finance and leadership a language they can evaluate.
Choose the framework for the decision
| Framework | Inputs Required | Best Used For | Weakness |
|---|---|---|---|
| RICE | Reach, impact, confidence, effort | Major bets requiring cross-functional alignment | Can overweight broad but shallow demand |
| ICE | Impact, confidence, ease | Fast weekly backlog decisions | Less defensible when assumptions are challenged |
| Outcome-based | Customer outcome, satisfaction gap, segment value, confidence | Roadmap choices tied to revenue and retention | Requires clean outcome definitions and account data |
Use the same fictional feature to expose the difference. Suppose an enterprise audit-log improvement has broad reach, high impact, strong confidence, and substantial effort. RICE may rank it highly because many users could benefit. ICE may also rank it well if the implementation appears easy. An outcome score can still place it below a smaller workflow fix if that fix is tied to accounts at immediate expansion risk.
That isn't a flaw in the outcome model. It's the point. Reach matters, but commercial materiality matters more when capacity is scarce.
For a practical overview of how teams combine prioritization inputs, see this product prioritization framework guide. My default recommendation is direct:
- Use outcome scoring for roadmap and investment decisions.
- Use ICE for tactical weekly grooming.
- Use RICE for major bets where several teams need a shared comparison.
Document the input behind every score. A number without evidence only makes an argument look more scientific.
How AI Signal Platforms Change Discovery
Discovery used to depend on a few scheduled customer calls, manual ticket reviews, and a PM trying to remember patterns across scattered systems. That approach can uncover valuable insight, but it makes discovery episodic and leaves large amounts of evidence untouched.
An always-on signal platform changes the operating rhythm. It can ingest support tickets, call transcripts, churn notes, NPS comments, and in-product behavior anomalies, then group related signals by segment, workflow, and likely business consequence. The PM still validates the pattern, but doesn't begin with an empty spreadsheet.
A Monday morning workflow
On Monday, the platform flags a cluster of mid-market accounts repeatedly failing the same onboarding step. The signal includes linked tickets, call excerpts, usage anomalies, and account context. The scoring engine surfaces the item because the affected accounts have expansion potential, not merely because the ticket count is high.
Before standup, the PM has a brief containing:
- The customer outcome that appears underserved.
- The affected account segment and workflow.
- Qualitative evidence showing how users describe the friction.
- Behavioral evidence showing where the workflow breaks.
- The commercial exposure and confidence level.
- A proposed interview and prototype plan.
The PM's next task isn't to accept the recommendation blindly. It's to speak with affected customers, reproduce the workflow, and test the smallest credible intervention. AI handles the repetitive triage. Product judgment remains responsible for problem framing, validation, and trade-offs.
Signal detection for product teams describes the kind of continuous analysis that supports this workflow. SigOS is one example of a product intelligence platform that connects feedback and usage signals to churn, expansion, and revenue-impact analysis. The value is not automated certainty. It's giving a small team a persistent evidence layer so product discovery doesn't disappear whenever the PM gets pulled into delivery work.
A Short Checklist for the Next Quarter
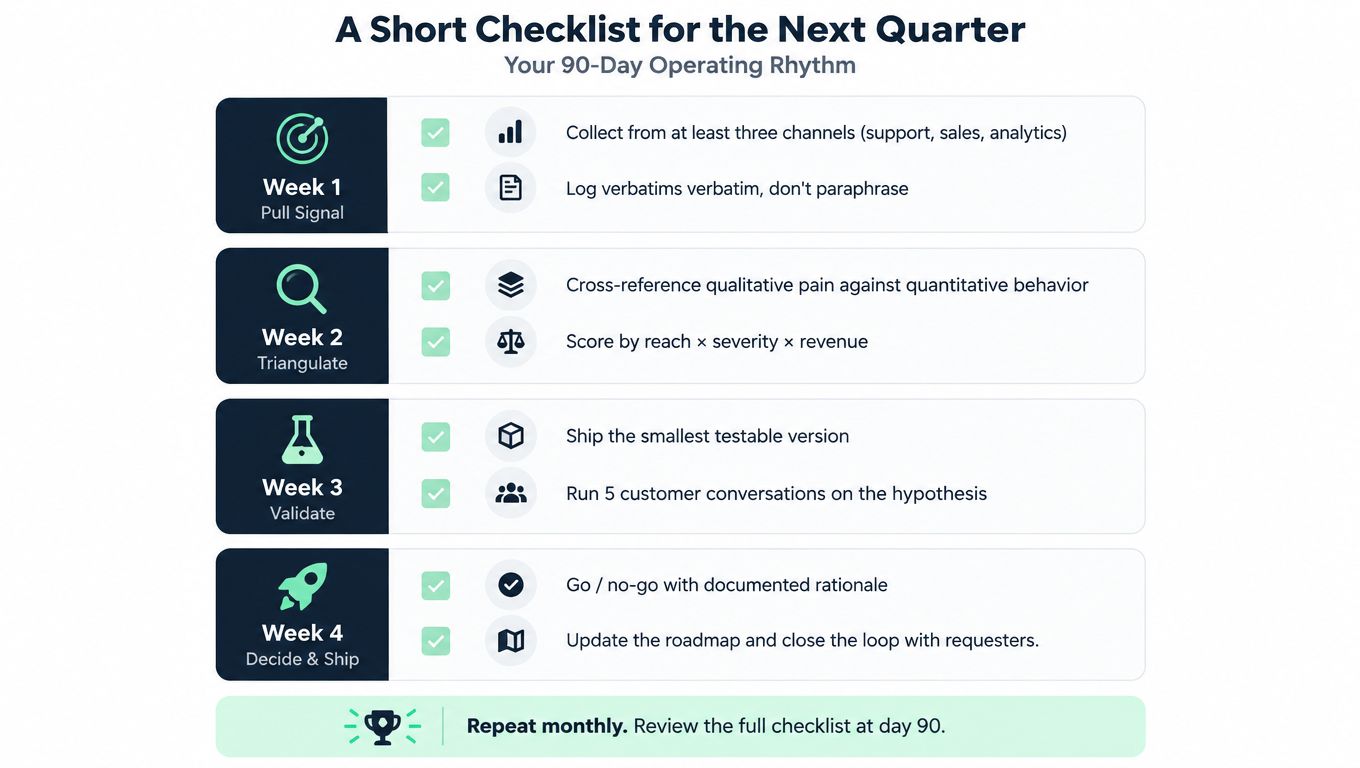
Run opportunity discovery as an operating rhythm, not a quarterly workshop. The process should produce a current scoreboard of customer pain, evidence quality, and commercial exposure every week.
Weekly operating checklist
Week 1, pull signal
- Collect evidence from at least three channels, including support, sales, and analytics.
- Preserve customer language verbatim. Don't paraphrase away the severity or context.
Week 2, triangulate
- Cross-reference qualitative pain with quantitative behavior.
- Score each opportunity by reach, severity, and revenue exposure, while recording the assumptions behind the score.
Week 3, validate
- Test the smallest useful version of the proposed solution.
- Run customer conversations focused on the job, current workaround, and expected outcome.
Week 4, decide and ship
- Make a documented go or no-go decision.
- Update the roadmap and close the loop with the people who raised the problem.
Three habits that improve the scoreboard
- Write the outcome before the solution. If the team can't describe the result customers need, it isn't ready for prioritization.
- Attach a commercial value to every opportunity. Use account value, expansion potential, renewal exposure, or acquisition relevance. If none applies, record that explicitly rather than inventing precision.
- Review the scoreboard every Monday. Re-rank the top opportunities as new usage, feedback, and account evidence arrives.
At day 90, examine which scores predicted meaningful adoption, retention, expansion, or reduced friction. Keep the scoring logic that helped the team make better decisions, remove inputs that created noise, and start the next cycle with a cleaner evidence base.
SigOS helps product and growth teams connect support tickets, sales conversations, customer feedback, and usage behavior to identify opportunities tied to churn, expansion, and revenue impact. Use SigOS to build a continuously updated opportunity scoreboard, validate what deserves discovery, and stop letting the loudest request decide your roadmap.



Ready to find your hidden revenue leaks?
Start analyzing your customer feedback and discover insights that drive revenue.
Start Free Trial →