Issue Priority Matrix: A Practical Guide for Product Teams
Learn how to build an issue priority matrix that scores real revenue impact. Covers criteria, weighting, templates, and roadmap integration for SaaS teams.

Tuesday triage starts with three urgent-looking issues. The CFO flags a broken SSO flow, sales escalates a dashboard that loads slowly during demos, and support surfaces a complaint from a smaller account after it has already been buried under newer tickets. The team places all three on an impact-versus-effort grid, agrees that the exercise feels productive, and then discovers that the “high impact” quadrant has room for only one item.
That's where a basic issue priority matrix usually stops. It can clarify trade-offs, but it can't tell you whether the SSO issue affects a strategic account, whether the loading delay blocks a broad user segment, or whether the support complaint is an early churn signal. A useful matrix needs the simplicity of a 2×2 and the commercial context of a live operating system.
The Triage Problem a 2x2 Cannot Solve
The Tuesday meeting looks familiar because the 2×2 makes disagreement feel manageable. The CFO's SSO concern sounds important, the sales escalation has visible urgency, and the support complaint appears minor because nobody has given it a senior voice. The team estimates impact and effort, places the cards on the board, and starts discussing delivery.
The problem is that “impact” becomes a container for every kind of importance. The CFO means revenue exposure and account risk. Sales means demo performance and deal momentum. Support means repeated customer friction. Engineering means technical scope and uncertainty. The matrix compresses those different signals into a single subjective label.
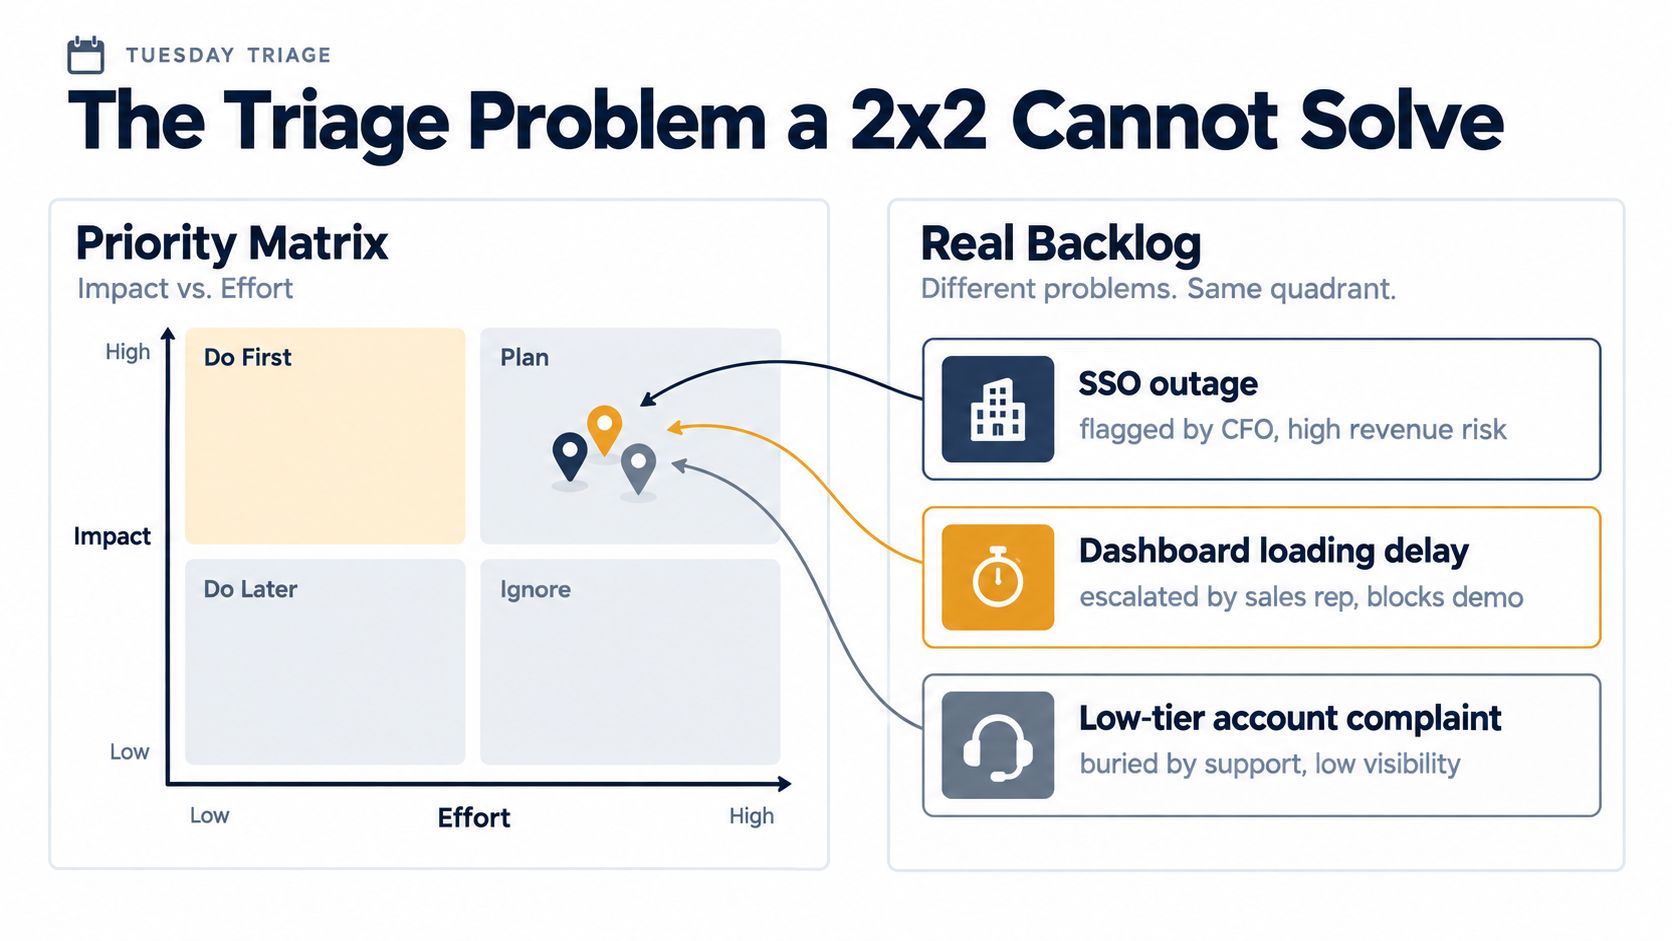
What the grid leaves out
A vanilla matrix usually has no fields for:
- Annual contract value, or ACV, attached to affected accounts
- Churn risk, including renewal timing and deteriorating account health
- Usage reach, such as affected seats, workspaces, or workflows
- Expansion potential, including an active opportunity that depends on the fix
- Signal confidence, distinguishing one anecdote from a repeated pattern
- Account concentration, which prevents many low-value votes from automatically outweighing one material customer risk
That omission matters because frequency and business materiality aren't the same thing. A low-tier account can generate many tickets about a nuisance, while a strategic account reports one severe issue before considering a downgrade. If both issues receive the same “high impact” label, the matrix has discarded the information leadership needs.
The method remains useful. Product guidance commonly presents the issue priority matrix as a 2×2 framework based on impact versus effort or cost, with quick wins separated from high-effort, high-value work. Atlassian's prioritization guidance also places the matrix alongside more structured approaches such as RICE, which is a useful reminder that the grid is a starting point, not a complete decision model.
Practical rule: Use the 2×2 to start a conversation, not to finish a commercial decision.
Teams need repeatability because backlog decisions happen often and consensus is difficult. A 2019 survey of more than 1,300 product professionals found that over 40% reprioritized their backlogs every week, while nearly 30% identified consensus on product direction as their biggest challenge, as reported by ProductPlan's prioritization matrix guidance. A scoring layer makes those conversations less dependent on whoever speaks most forcefully. For teams that need a broader operating model, The OKR Hub's priority management system is a useful reference for connecting prioritization with company objectives.
Choosing the Right Criteria for Your Matrix
Start by deciding what “material” means for your business. Don't begin with the quadrant labels. Begin with the evidence you want the team to consider before an issue earns a place in the roadmap.
A practical criteria set usually covers revenue exposure, churn risk, usage reach, strategic fit, user severity, and confidence. Some businesses may add compliance exposure, operational cost, or expansion potential. Keep the set deliberately small. Public-health prioritization guidance recommends narrowing candidate criteria to 10 or fewer through consensus or multivoting, then applying weights before calculating final scores, as described in this prioritization techniques guide from NACCHO.
Separate impact from delivery cost
Effort belongs on the matrix, but it shouldn't be mixed casually with impact criteria. Revenue exposure answers, “How much business is at risk?” Effort answers, “What will it take to address the issue?” Combining those questions in one column makes a difficult issue look unimportant just because it's expensive to fix.
Use the criteria below as a working checklist. The scales are an illustrative team convention, not a universal standard. Your team can use another consistent scale, provided everyone applies it in the same way.
| Criterion | Question it answers | Data source | Scale |
|---|---|---|---|
| Revenue exposure | Which ACV or expansion opportunity is affected? | CRM, account plan, billing system | Low to high |
| Churn risk | Could this issue influence renewal or downgrade risk? | Customer health, renewal notes, success plans | Low to high |
| Usage reach | How many affected seats, workspaces, or workflows depend on the area? | Product telemetry, account data | Low to high |
| Strategic fit | Does solving this support a current company or product objective? | OKRs, strategy documents, roadmap themes | Low to high |
| User severity | Is the issue a blocker, severe degradation, or inconvenience? | Support, interviews, incident records | Low to high |
| Confidence | How reliable and complete is the evidence? | Ticket volume, telemetry, account validation | Low to high |
| Compliance or operational exposure | Could the issue create regulatory, security, or support burden? | Security, legal, operations | Low to high |
Don't mix qualitative complaints and quantitative revenue in one cell. Store the raw evidence separately, then translate it into a score. “The customer is frustrated” is useful context. “The issue affects a renewing account with material ACV and repeated usage” is structured evidence. Both can appear on the issue record, but they shouldn't be treated as interchangeable inputs.
Run a short criteria workshop with product, engineering, support, customer success, sales, and finance. Ask each group which signals would change its decision, remove duplicates, define the lowest and highest score for every criterion, and agree on which fields must be populated before an issue can enter sprint planning.
Scoring, Weighting, and Calculating Priority
A weighted score only helps when the team applies the same rubric to every issue. A simple approach is to score each criterion on a 1-to-5 scale, assign weights that total 100, and calculate a weighted average. Those values are an example configuration for a worksheet, not a claim that every product team should use the same scale or weights.
Suppose the team gives revenue exposure a weight of 35, user severity 30, churn risk 20, and confidence 15. An SSO issue might receive scores of 5, 4, 5, and 4 across those criteria. A loading-delay issue might receive 3, 5, 2, and 5. The loading delay has greater immediate user severity, but the SSO issue has stronger commercial exposure and renewal implications. The weighted result makes that trade-off visible instead of letting the loudest stakeholder settle it.
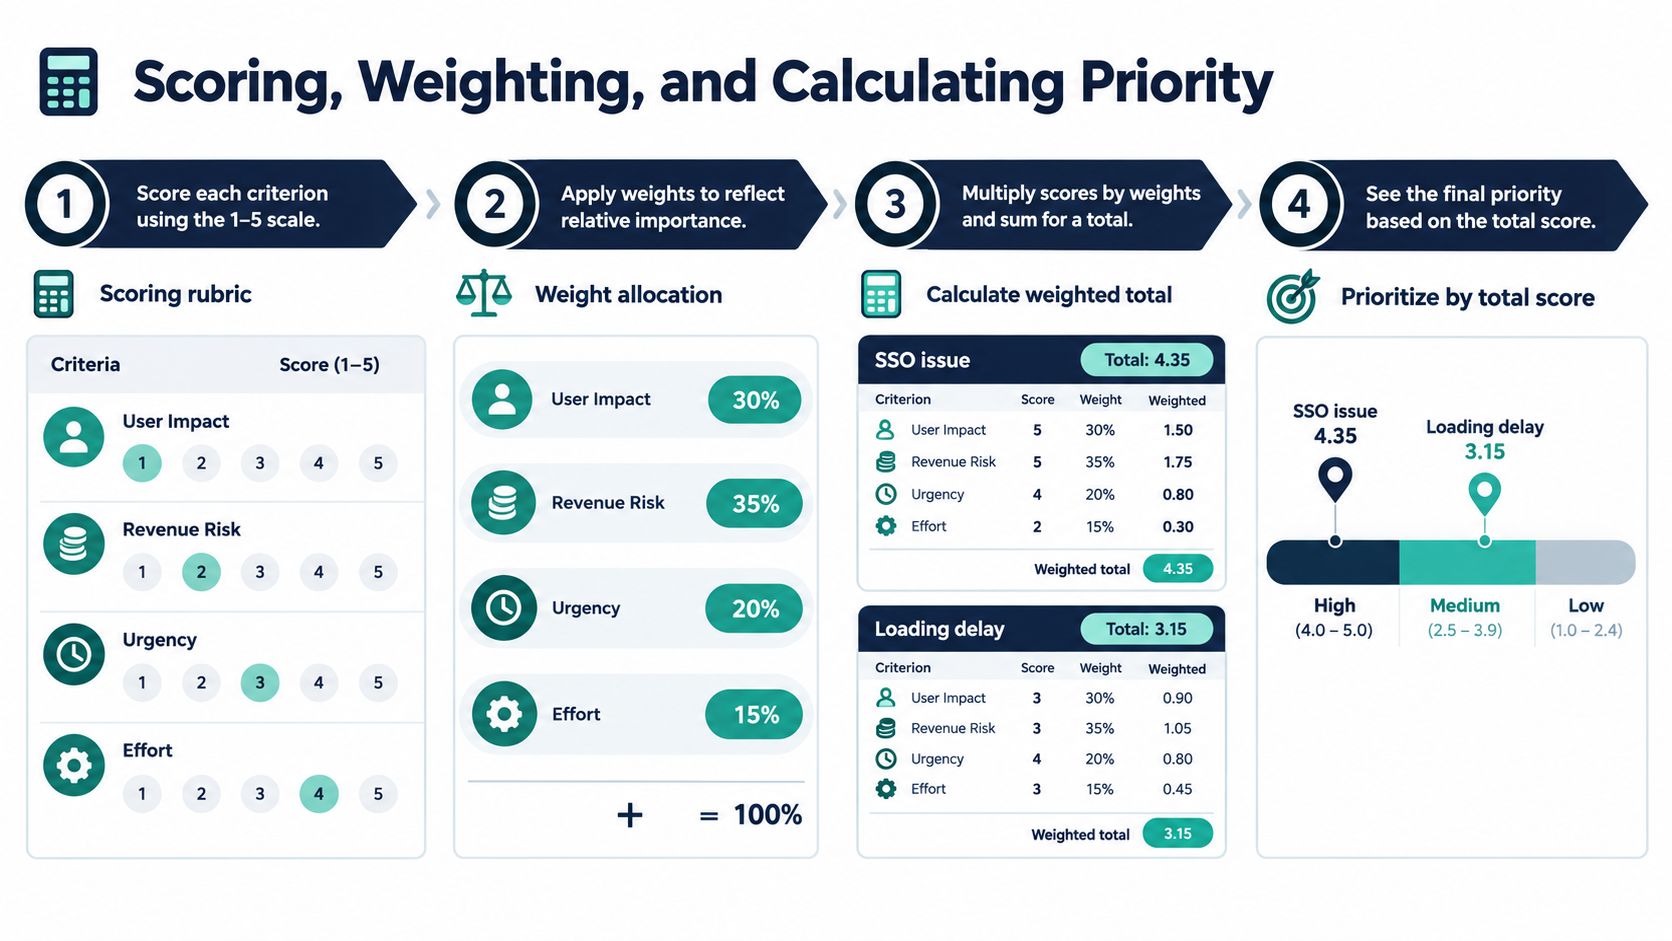
Use the scale to create separation
Teams often give every issue a 3 because a middle score feels defensible. That habit destroys the model. A 3 should mean “moderate,” not “we haven't investigated this yet.” If confidence is low, record low confidence. Don't disguise missing evidence as neutrality.
You can calculate the example above as follows:
- SSO issue:
(5 × 35 + 4 × 30 + 5 × 20 + 4 × 15) ÷ 100 = 4.55 - Loading delay:
(3 × 35 + 5 × 30 + 2 × 20 + 5 × 15) ÷ 100 = 3.65
The formula for a spreadsheet is:
=SUMPRODUCT(score_range, weight_range)/SUM(weight_range)
Keep effort separate if you're using a two-axis view. Plot the weighted impact score vertically and estimated effort horizontally. That produces a more meaningful matrix than asking a single person to invent “impact” from scratch. For teams that need a deeper explanation of the calculation method, this guide to a weighted scoring model provides a useful companion.
Challenge the output before acting
The score isn't a verdict. Review the top three issues and ask:
- Does the evidence support the score?
- Would leadership defend the ranking in a QBR?
- Is the issue important because of business exposure, or only because it has a persistent internal advocate?
- What would cause the score to change?
- Is the team comparing similar issues, or mixing incidents, product gaps, and strategic investments?
If the score says to defer a highly visible issue, document why. If it surfaces a quiet account-level risk, make the underlying revenue and usage signals visible. The matrix earns trust when people can inspect both the result and the reasoning.
Comparing Vanilla, RICE, and Revenue-Weighted Models
Each prioritization model rewards a different kind of evidence. The mistake isn't choosing the “wrong” framework. The mistake is using a framework without understanding which signals it suppresses.
A vanilla impact-versus-effort matrix is fast and accessible. It works well for an initial workshop, especially when a team needs to separate low-effort improvements from complex bets. It fails when executives mark everything important as high impact and engineers mark everything uncertain as high effort. The result is a crowded high-value quadrant where the team still has to negotiate from instinct.
RICE adds reach, impact, confidence, and effort, then uses those inputs to compare candidates. It creates more structure, but impact magnitude can still come from a gut estimate. This overview of the RICE prioritization framework is useful for understanding where the model fits, particularly when candidates are comparable and the team has reasonable reach data.
A revenue-weighted model changes the question. Instead of asking only how many people want the fix, it asks which accounts, renewal situations, usage patterns, and expansion opportunities are exposed. That doesn't mean revenue should dominate every decision. It means revenue is a visible input, with a cap or governance rule so one large account can't automatically dictate the entire roadmap.
| Model | Score | Rank of Checkout Bug | What It Rewards | What It Misses |
|---|---|---|---|---|
| Impact versus effort | High impact, medium effort | Top tier | Visible pain and apparent feasibility | ACV, renewal context, confidence |
| RICE | Illustrative high score | Upper group | Reach, impact estimate, confidence, efficiency | Account concentration and revenue quality |
| Revenue-weighted | High account exposure, medium effort | Highest in this example | Affected accounts, ACV, churn risk, expansion potential | Broader strategic value if commercial data is incomplete |
The same checkout bug can rank differently under each model. A widely requested cosmetic problem may win on frequency while losing on revenue exposure. A less common billing or authentication issue may look modest until the team attaches affected accounts and renewal timing.
The model is a lens, not a neutral observer. Choose the lens that matches the decision you're making.
Wiring the Matrix Into Your Stack
A matrix in a slide deck goes stale as soon as its underlying signals change. A workable setup moves issues from intake through enrichment, scoring, record creation, and review. The tools can use different interfaces, but they need shared field definitions so ACV, churn risk, usage, and confidence mean the same thing across the workflow.
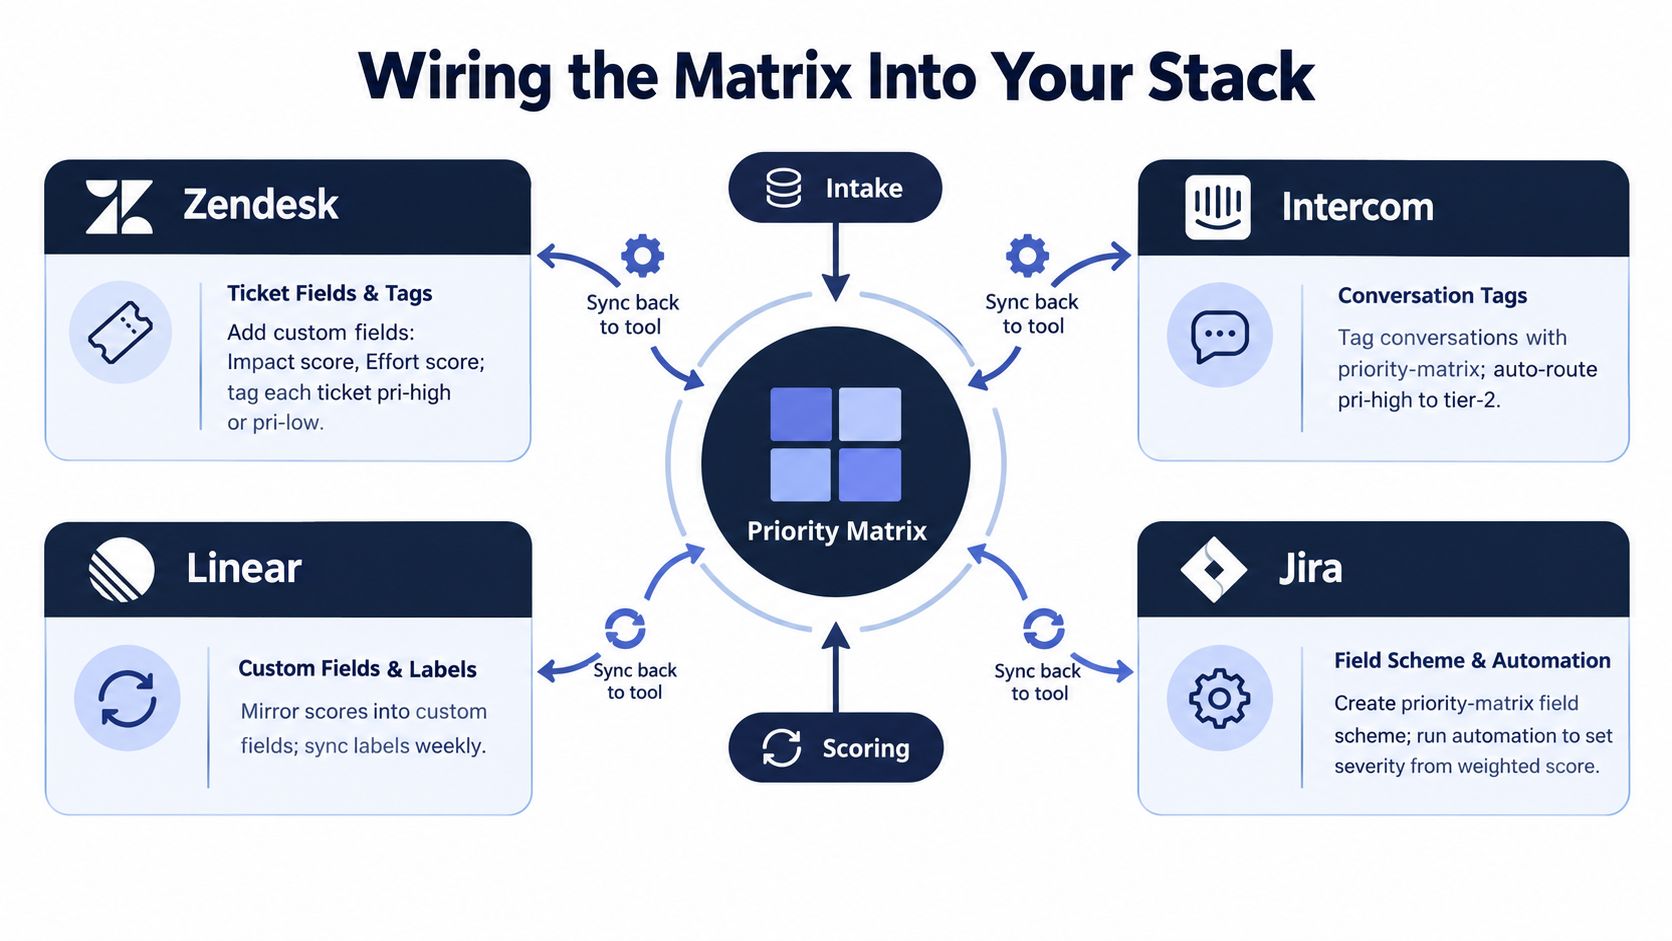
Create a minimum shared schema
Use fields or tags such as:
issue_typeaffected_tieracv_bandchurn_riskaffected_seatsusage_signalconfidencepriority_scorescore_updated_at
In Zendesk, show customer and business fields during ticket triage. In Intercom, tag conversations by problem theme and account segment before merging duplicate requests. In Linear, copy the score and evidence link into the issue record so product and engineering can inspect the same decision context. In Jira, use a field scheme and automation rule to derive a triage label from the weighted score, while retaining the individual criteria for auditability.
If your warehouse already holds account and usage data, a reverse ETL step can push enriched fields back into the tracker. See this guide to what is reverse ETL for the mechanics. That flow lets the matrix attach commercial context to each candidate issue instead of rewarding whichever stakeholder submits the loudest request.
The useful automation rule is “re-score when material context changes.” A customer upgrade, downgrade, related ticket, usage shift, or renewal update should trigger a review of the affected issue. Product teams that consolidate feedback by segment, problem, and outcome, as described in Koji's guidance on prioritizing customer feedback, keep those schema fields populated between reviews.
Make one view authoritative
Choose a Linear view or Jira filter as the operational source of truth. It should display the issue, score, affected accounts, evidence confidence, owner, effort estimate, and last recalculation date. Zendesk and Intercom remain intake systems. The product tracker holds the decision record.
Tagging without enforcement creates unreliable metadata. Require a complete scorecard before an issue enters sprint planning. A product manager can approve an emergency override, but the record should include an owner, reason, and review date.
Some teams add a customer-feedback intelligence layer that connects support, conversation, and usage signals before creating issues. SigOS is one option that turns feedback patterns into prioritized issue records with business-impact context. Whether the workflow uses that platform or internal tooling, no issue enters the sprint without a complete scorecard.
Keeping the Matrix Alive Between Reviews
A matrix decays when ownership ends at launch. The first workshop usually has energy because everyone wants influence. The maintenance work is quieter: updating account context, correcting tags, revisiting weights, retiring irrelevant criteria, and checking whether the score still reflects the business.
Assign ownership explicitly. A product lead should own the criteria and weights. A support or customer-success lead should own tagging hygiene and problem consolidation. Finance or revenue operations should validate ACV and churn-risk inputs. Engineering should own effort estimates and technical confidence.
Define the review triggers
Run a short recalibration every two weeks if the backlog changes quickly. Use a longer monthly review for criteria and weights, not as a substitute for updating individual issue evidence. A matrix that hasn't been checked for more than a quarter is probably describing an earlier business, not the current one.
Re-score an issue when:
- An account changes commercial status: An upgrade, downgrade, renewal event, or expansion opportunity alters exposure.
- Usage changes materially: A drop, acceleration, or concentration shift changes reach or severity.
- A related pattern appears: Separate tickets or conversations reveal the same underlying problem.
- A compliance requirement changes: Legal or security context can turn a roadmap item into a gate.
- The strategy moves: A new product line, segment, or company objective changes strategic fit.
- The workaround fails: An issue that was tolerable can become a blocker without any code change.
Log every score change with the owner, date, changed field, and evidence. That history prevents circular arguments. Instead of saying, “This was always high priority,” the team can see that churn risk rose after a renewal signal or that usage reach expanded after a product change.
Ownership is part of the scoring system. If nobody owns the inputs, the final number is only decoration.
Don't punish the matrix for changing its mind. A living system should move issues up and down as evidence changes. Stability doesn't mean keeping rankings fixed. It means using a consistent process to explain why rankings changed.
From Matrix to Roadmap and Revenue
The matrix becomes operational when it changes capacity decisions. Suppose three issues score above a selected roadmap threshold, but only one fits the next planning window. The score doesn't force the team to pretend all three can ship. It gives leadership a defensible reason to choose one, sequence another, and investigate the third.
The selected issue might protect accounts with high churn risk. Another may support an expansion opportunity but require more engineering capacity than the current quarter allows. A third may affect many users but have a reliable workaround and limited commercial exposure. Those distinctions belong in the planning conversation, not in a footnote after the roadmap is approved.
Present the decision in business language
For every proposed roadmap item, show:
- The problem: What customers or users experience
- The evidence: Tickets, conversations, telemetry, and account data
- The score: Criteria, weights, confidence, and effort
- The commercial link: Churn exposure, expansion context, or operational cost
- The decision: Commit, validate, defer, or retire
- The review condition: What new evidence would change the ranking
This format helps product leaders defend cuts without claiming that deferred issues don't matter. A lower-ranked issue can still be valid. It just loses the current capacity trade-off under the agreed criteria.
Start Monday with a small, controlled rollout:
- Lock the criteria and define each scoring level.
- Assign weights and identify the owner for every input.
- Score the highest-priority backlog candidates.
- Attach account, renewal, usage, and confidence evidence.
- Integrate the workflow with one of Zendesk, Intercom, Linear, or Jira.
- Publish one shared triage view.
- Recalculate the scores every two weeks and review the weights monthly.
A 2×2 remains a useful visual summary. The durable system sits underneath it, where account context, revenue exposure, churn risk, usage, effort, and confidence turn competing requests into a decision the business can explain.
SigOS helps product teams connect support tickets, customer conversations, and usage signals to revenue-aware issue prioritization, so the backlog reflects material customer problems rather than stakeholder volume. Visit SigOS to see how its integrations can turn those signals into a prioritized workflow for your team.



Ready to find your hidden revenue leaks?
Start analyzing your customer feedback and discover insights that drive revenue.
Start Free Trial →