Unlocking Growth with Customer Behavior Analysis
Learn how customer behavior analysis turns user data into revenue. This guide covers key metrics, methods, and tools to reduce churn and drive growth.

At its core, customer behavior analysis is the art and science of watching how people actually use your product and figuring out why. It’s not just about tracking clicks or counting logins. It's about getting to the bottom of the motivations, frustrations, and "aha!" moments that shape their experience.
This process essentially turns a jumble of raw user activity into a clear, actionable roadmap for making your product better.
Moving Beyond What Customers Say to What They Do
Think of yourself as a detective. Your customers are constantly leaving clues scattered across your entire platform—in their support tickets, chat logs, phone calls, and every single interaction they have with your app. Customer behavior analysis is the toolkit you use to gather these digital breadcrumbs and piece together the real story.
For any modern SaaS company, this isn't just a "nice-to-have." It's a fundamental part of staying competitive. You're swimming in data from a dozen different sources, and the real challenge is cutting through the noise to find the signals that actually matter to your product strategy.
So, why is this so critical right now? Because customer expectations are higher than ever. In today's market, people have zero patience for clunky or confusing experiences. Research from McKinsey's recent findings shows that over 90% of consumers are regularly shopping with online-only businesses, proving just how much a smooth digital journey matters.
For product managers, this means you have to be watching everything in real-time—from how users interact with a new dashboard to what they’re asking for in support chats. Teams that can connect these dots are the ones who spot expansion opportunities first and turn user behavior directly into revenue.
Customer behavior analysis is the bridge between raw user data and a revenue-focused product roadmap. It helps you answer the most important questions: Where do users get stuck? What makes them upgrade? And what friction is silently pushing them to churn?
Ultimately, this practice gives you the confidence to prioritize what truly matters. Instead of guessing which bug to fix or which feature to build next, you can focus your resources on the issues that are directly hurting customer happiness and your bottom line.
By grouping users based on their actions, you can create much more relevant and personalized experiences. We dive deeper into this specific strategy in our guide on what behavioral segmentation is and how it can drive growth.
Where Does This Data Come From?
To get a complete picture, you need to pull information from multiple touchpoints. Relying on a single source, like product analytics alone, can give you a skewed or incomplete view of the customer journey.
Here's a breakdown of the most valuable data sources and the kinds of insights they provide:
| Key Data Sources for Customer Behavior Analysis | | :--- | :--- | :--- | | Data Source | Type of Insight | Example Application | | Support Tickets | Explicit user pain points and friction. | Identifying that 25% of tickets are related to a confusing checkout workflow. | | Live Chat Transcripts | Real-time struggles and questions. | Noticing users repeatedly ask where to find their invoice history. | | Customer Calls | Emotional tone and in-depth context. | Hearing the frustration in a customer's voice when they can't integrate a key tool. | | Product Usage Metrics | Implicit user actions and feature adoption. | Seeing a 60% drop-off rate on a new feature's onboarding screen. | | CRM Data | Account health and commercial context. | Correlating low product usage with customers on a specific pricing tier. | | Surveys & NPS | Stated satisfaction and loyalty. | Learning that power users who give low NPS scores all avoid a particular feature. |
Combining these streams gives you a 360-degree view, helping you connect what customers say with what they actually do.
What Are We Looking For? Key Patterns and Metrics
Once you have the data, the real work begins: finding the patterns that tell a story. You're not just looking at isolated events; you're looking for trends, signals, and correlations that point to bigger opportunities or risks.

Here are the core signals product and GTM teams should be watching for:
Churn Signals
These are the red flags indicating a customer might be on their way out.
- Decreased Login Frequency: A user who used to log in daily now only logs in once a week.
- Reduced Feature Usage: Key features that were once used heavily are now being ignored.
- Negative Support Interactions: A spike in tickets or frustrated chats from a specific account.
- Ignoring New Features: Consistently failing to adopt new, valuable functionality you release.
Expansion and Upsell Indicators
These are the green lights that signal an account is ready for more.
- High Adoption of "Sticky" Features: Power users who rely on your product's core, high-value features are often your best upsell candidates.
- Approaching Usage Limits: Accounts consistently nearing their data, user, or feature limits are prime for an upgrade.
- Exploring Premium Features: You might see users from a standard plan clicking on—or even trying to access—features only available in a higher tier.
Feature Adoption and Engagement
This tells you how well your product is resonating with users.
- Time-to-Value (TTV): How long does it take a new user to perform a key action that delivers value? A long TTV is a major friction point.
- Adoption Rate: What percentage of users have tried a new feature after launch?
- Feature Drop-Off: Where in a specific workflow are users giving up? If 70% of users start creating a report but only 10% finish, you've found a problem.
- Core Action Completion: How many users successfully complete the primary task your product was designed for? This is a direct measure of product-market fit.
Decoding Signals That Drive Revenue and Churn
Think of your user data as a constant conversation. Some customers are whispering that they might leave, while others are shouting that they’re ready for more. The real trick to customer behavior analysis is learning how to tune into that conversation and pick out the important messages from all the background noise.
This isn't about staring at high-level metrics like daily active users. It’s about digging deeper to find the specific behaviors that actually predict what a customer will do next—and how it will affect your bottom line.

Identifying Critical Churn Indicators
Churn signals are the early warnings that a customer is losing interest or getting frustrated. If you can spot these signs early enough, you have a real shot at stepping in and turning things around. One person complaining about a bug is just noise. But 50 complaints about that same bug from your highest-paying accounts? That's a five-alarm fire.
Keep an eye out for these red flags:
- Sudden Drop in Core Feature Adoption: A customer who lived inside a key feature and suddenly stops using it is a massive warning. They've likely found a different way to do their job, possibly with a competitor.
- Spike in Frustration Signals: Pay attention to the language in your support tickets. An uptick in words like "frustrating," "confusing," or "broken" is a goldmine for understanding what’s causing real pain.
- Decline in Team Engagement: When a business account with ten active users suddenly drops to just two, it’s a clear sign your product is no longer essential to their team’s workflow.
The most dangerous churn risks aren't loud complaints; they are the silent disengagements. Customer behavior analysis helps you hear what users don't say out loud by watching what they do (or stop doing).
Preventing customer loss is all about being proactive. For some practical strategies, check out this guide on how to reduce customer churn. It all starts with monitoring the right signals.
Spotting Valuable Expansion Signals
Just as crucial as catching churn risks is recognizing opportunities for growth. Expansion signals tell you which customers are getting a ton of value from your product and are primed to upgrade or add new features.
Look for these green lights:
- Consistently Hitting Plan Limits: Any team constantly bumping up against their user, data, or feature limits is practically raising their hand and saying, "We've outgrown this plan!"
- Early Adoption of Advanced Features: When users on a basic plan start poking around your premium features, they’re telling you exactly what they want. This is the warmest lead for an upsell you could ask for.
- Increased User Invitations: A sudden surge in new teammates being invited to an account is a fantastic sign. It shows your product is becoming more embedded in their organization and spreading like wildfire internally.
Proven Methods for Analyzing Customer Behavior
Once you’ve started to pick up on the critical signals in your data, you need a way to make sense of it all. That’s where a few battle-tested analysis methods come in. Think of them as different lenses you can use to examine how people really interact with your product. They help you turn a jumble of raw numbers into clear stories that actually guide your decisions.
It’s a bit like being a detective with a full forensic kit. One tool might identify fingerprints (who the users are), while another reconstructs the timeline of events (what they did and when). By combining these approaches, you get a much clearer picture of what’s happening and, more importantly, why.
Uncovering Patterns with Segmentation
The most foundational method is segmentation. Instead of looking at your user base as one big, faceless crowd, you break them down into smaller groups based on shared characteristics or behaviors. This is where the real, actionable insights start to emerge.
You can slice your user base in a few key ways:
- Behavioral: Grouping users by their actions. Think "power users" who live in your product versus "specialists" who only log in for one specific task.
- Demographic: Segmenting by attributes like job title, company size, or industry. For example, do product managers from enterprise companies use your tool differently than engineers from startups?
- Technographic: Clustering users by the other software they use. This can be a goldmine for spotting integration opportunities.
Good segmentation helps you answer crucial questions like, "Which user group is churning the most?" or "What features do our highest-paying customers rely on?" We cover this in much more detail in our deep dive on how to use behavioral analytics.
Tracking Trends with Cohort Analysis
While segmentation gives you a static snapshot, cohort analysis shows you how behavior changes over time. A cohort is just a group of users who share a common starting point, like everyone who signed up in January.
By tracking these groups for weeks or months, you can see how product changes or marketing efforts actually affect their long-term behavior. For example, did the cohort that went through your new onboarding flow stick around longer than the one that didn't? This method is incredibly powerful for proving the true impact of your decisions.
Cohort analysis is like a time-lapse video of your user base. It reveals whether your product changes are building long-term loyalty or if the initial excitement just fizzles out.
Pinpointing Friction with Funnel Analysis
Finally, funnel analysis is all about mapping the specific steps a user takes to reach a goal—like signing up, finishing onboarding, or upgrading their plan. Its main job is to show you exactly where people are getting stuck and dropping off.
A funnel might reveal that 90% of users start creating an account, but only 40% ever get past the "invite a teammate" step. That massive drop-off is a huge red flag pointing to friction. Suddenly, your product team has a specific, high-impact problem to solve instead of a vague sense that "onboarding could be better."
In a world where 30% of customers use at least three channels for a single purchase, understanding their journey is key. Funnel analysis helps quantify the drop-off points, but you also need to dig into the 'why'. Learning how to analyze qualitative data from support tickets and sales calls can give you the context behind the numbers, turning quantitative data into a complete story.
Building Your Analysis and Action Workflow
Finding a critical customer issue is only half the battle. What good is an insight if it just sits in a spreadsheet? The real magic happens when you build a repeatable process that turns those findings into action. This is what separates teams that are always playing defense from those who are actively shaping their growth.
A modern workflow isn't about manual data pulls and late-night analysis. It’s an automated engine that constantly sips in raw signals, figures out what actually matters, and gets prioritized tasks to the right people before a small problem becomes a five-alarm fire. This shifts customer behavior analysis from a once-a-quarter report into the daily, operational heartbeat of your company.
The aim here is to create a straight line from raw customer feedback to a resolved engineering ticket. That means knocking down the walls between your data systems to create one place where the full customer story lives.
The Automated Workflow in Action
An effective workflow is all about connecting the dots between data, analysis, and execution. Instead of relying on someone to tap a colleague on the shoulder, automation ensures that high-impact issues get seen and sent to the people who can actually fix them—fast.
This whole process really breaks down into three key stages:
- Ingest and Unify Data: First, you have to pull in information from everywhere your customers interact with you. This isn't just structured product usage metrics; it's the messy, unstructured gold found in support tickets from Zendesk, call transcripts from Gong, and chat logs from Intercom.
- Analyze and Prioritize with AI: With all the data in one place, a product intelligence platform like SigOS gets to work. It cleans everything up, gives it structure, and starts looking for patterns. Crucially, it ties these patterns back to your revenue data, calculating the real-world business impact of every single issue it finds.
- Route and Alert Automatically: This is where the loop closes. When the system flags a high-priority problem—say, a bug that’s costing $100k in ARR—it doesn’t just spit out a dashboard. It automatically creates a ticket in a tool like Jira or Linear, pre-loaded with all the context, direct customer quotes, and that all-important revenue-impact number.
This diagram shows some of the core analysis methods that power that second stage, moving from broad user groups to specific friction points.
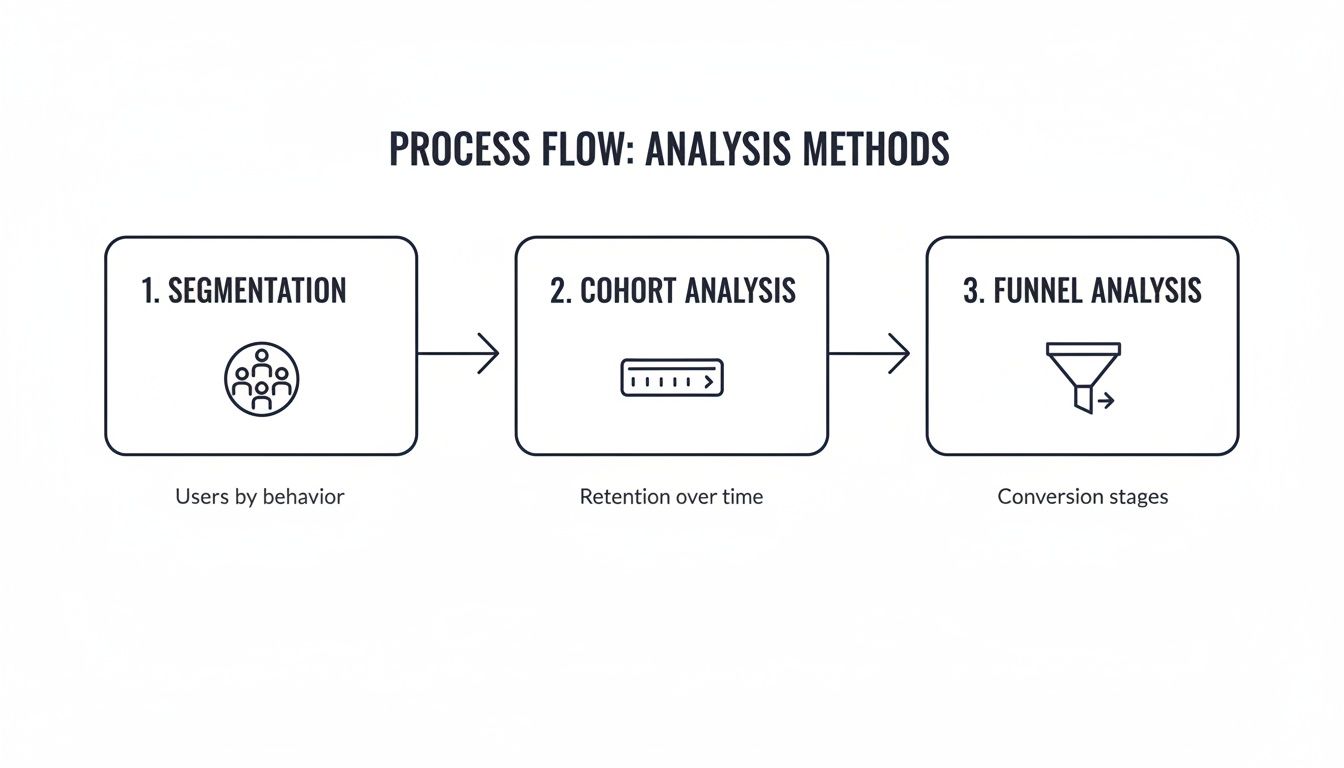
As you can see, techniques like segmentation, cohort analysis, and funnel analysis work in tandem. You start by grouping users, then look at how specific groups behave over time, and finally zero in on the exact spots where they're getting stuck.
The real power of an automated workflow is turning a vague customer complaint into a high-priority, revenue-backed development task in minutes, not weeks.
This systematic approach takes the guesswork and gut feelings out of prioritization. It makes sure your product and engineering teams are always working on the fixes and features that will have the biggest, most measurable impact on keeping and growing your customer base. When you build this engine, customer behavior analysis becomes your company’s proactive growth driver.
Putting AI-Powered Analysis into Practice
It's one thing to talk about workflows in theory, but seeing an automated system work in the real world is where the value really clicks.
Picture this: a product manager at a SaaS company starts their day. Instead of spending an hour digging through dashboards, they see a single, automated alert. This is exactly where AI-driven customer behavior analysis closes the gap between mountains of raw data and a clear, revenue-focused roadmap.

This isn't just any old notification. It flags a 200% surge in support tickets that specifically mention "slow report generation." But here’s the crucial part: the system has already connected the dots. It’s correlated this issue with account data, revealing that it only affects enterprise accounts. These accounts represent a combined $300,000 in annual recurring revenue, instantly framing this bug not as a minor annoyance, but as a major churn risk.
Connecting Risks with Opportunities
At the same time, the AI platform is scanning other data sources. It's combing through recent sales call transcripts and has spotted a pattern: three separate feature requests from late-stage prospects. All three requests point to the same product enhancement—one that could open up a completely new market segment.
The platform doesn’t just show you these two different patterns; it puts a price tag on them.
- The Churn Risk: It calculates the immediate revenue in jeopardy from the "slow reports" bug.
- The Expansion Opportunity: It estimates the potential new revenue from adding the requested feature.
Suddenly, you have a clear, financially-backed priority list. The development team gets a task that isn't just "fix slow reports," but "fix the bug putting $300k ARR at risk." This proactive approach is a game-changer, and you can dive deeper into it in our guide on predicting customer churn before it's too late.
Building Trust Through Secure Analysis
Of course, this kind of deep analysis brings up valid questions about data privacy—a huge factor in modern customer behavior. With only 39% of consumers trusting companies to use their personal information responsibly, any analysis platform has to be built with a security-first mindset. You can see more on these consumer trends in Qualtrics' research.
An AI-powered product intelligence platform like SigOS is designed for this reality. It works with anonymized usage metrics and encrypted support tickets. Critically, it never retrains its models on customer data. This allows teams to find high-value opportunities while respecting user privacy and building that all-important trust.
This whole scenario paints a clear picture of how continuous, AI-driven analysis really works. It turns a flood of disconnected customer feedback into a prioritized, revenue-focused action plan. It gives teams the confidence to solve the right problems and build the right features, every single day.
Measuring Success and Avoiding Common Pitfalls
So, you've set up your customer behavior analysis. Great. But how do you know if it's actually working? A successful program isn't just an academic exercise in finding interesting data points; it’s a growth engine. The real proof is in the results—being able to draw a straight line from an insight to a key performance indicator (KPI).
This means you have to get past the vanity metrics. Sure, daily logins might look good on a dashboard, but they don't tell you if people are actually getting value from your product. We need to focus on KPIs that tell the real story of customer health and business momentum.
Key Metrics That Prove Your Impact
To make sure your analysis is more than just a data-gathering project, you need to track metrics that tie directly to revenue and customer happiness. This is what makes the whole effort sustainable.
- Reduced Customer Churn: This is the ultimate test. A great program will flag at-risk behaviors early, letting you step in and prevent customers from leaving. The result? A measurable drop in your churn rate.
- Increased Expansion Revenue: By spotting the signals that a customer is ready for more, you can proactively reach out to accounts that are primed to upgrade. This directly boosts your expansion MRR.
- Faster Issue Resolution Time: When you can instantly show that a specific bug is costing the company real money, engineering teams know exactly what to prioritize. Critical issues get fixed faster, and customers are happier.
- Higher Core Feature Adoption: This is a fantastic leading indicator of retention. It shows your product is becoming essential to your customers' day-to-day work, making it much harder for them to leave.
The goal isn't just to find interesting patterns; it's to find patterns that, when acted upon, move a critical business metric. If your analysis doesn't lead to a change in churn, expansion, or retention, it’s just noise.
Sidestepping Common Analysis Traps
Even with the best intentions and the right metrics, a few common traps can completely derail your strategy and make your data useless. Knowing what they are is the first step to avoiding them.
The biggest one? Siloed data. If your product usage metrics are in one system and your support tickets are in another, you're only ever seeing half the picture. You have to bring these sources together to get a complete, 360-degree view of what your customers are actually doing and feeling.
Another critical mistake is failing to tie insights to revenue impact. Imagine giving your product team a list of 100 customer complaints. It’s overwhelming. But what if you could tell them that one of those complaints is actively costing you $50,000 in ARR? Suddenly, the priority becomes crystal clear. Without that financial context, your teams are just guessing.
Frequently Asked Questions
Getting into customer behavior analysis can feel a bit overwhelming, so it's natural to have questions. Let's tackle some of the most common ones I hear from teams just starting out.
How Do You Start With Limited Resources?
If you're working with a small team or a tight budget, don't try to boil the ocean. My advice is always the same: pick one high-impact data source and go deep.
Support tickets are a goldmine. Start there. Manually read through and tag the common complaints, friction points, or feature requests. Once you spot a clear pattern and can tie it back to a business outcome—like churn or a stalled deal—you've built a powerful business case for getting more resources and better tools.
What's The Difference Between Qualitative And Quantitative Data?
Think of it this way: quantitative data tells you what is happening. It's the numbers—clicks, session times, which features get used. It’s the hard evidence.
Qualitative data tells you why it's happening. This is the human context you find in support tickets, survey answers, or call transcripts. You need both to get the full picture. The real magic happens when you can quantify the qualitative stuff, which is exactly what modern AI tools are great at. They can turn a mountain of customer feedback into a clear, prioritized list of what to fix first.
How Can AI Improve Customer Behavior Analysis?
AI takes on the heavy lifting. It automates the painful, slow parts of the analysis, like sifting through thousands of data points from all your different systems and spotting emerging trends before they become massive problems.
The real game-changer is that AI can connect those behavioral patterns directly to business outcomes like churn risk or an opportunity for expansion. It lets your team stop making educated guesses and start focusing their energy on the work that will actually protect and grow revenue.
Ready to stop guessing and start prioritizing with confidence? SigOS transforms your customer feedback into a clear, revenue-driven roadmap. Discover how AI-powered product intelligence can protect your revenue today.


Ready to find your hidden revenue leaks?
Start analyzing your customer feedback and discover insights that drive revenue.
Start Free Trial →