A Revenue-Driven Guide to Managing Product Portfolio
Learn how managing product portfolio with revenue data can reduce churn, prioritize features, and drive SaaS growth. A practical guide for product leaders.

Managing a product portfolio well is all about making smart, data-driven decisions. You have to know when to invest more in a product, when to just maintain it, and when it’s time to retire it altogether. This isn't about guesswork; it's a strategic process that ties your entire product suite directly to what the business needs—more revenue, better retention, and real market growth.
Stop Guessing How to Manage Your Product Portfolio

Let's be honest. For too long, product portfolios have been managed by gut feelings or by whoever shouts the loudest in a meeting. It’s a common trap for SaaS companies, and it almost always leads to a bloated, misaligned portfolio that bleeds money and frustrates everyone from the engineers to the end-users.
This isn't just inefficient; it's a direct hit to your bottom line. When decisions aren't tied to clear business outcomes, you end up pouring capital into low-impact features while ignoring the core problems that make customers leave. It’s a vicious cycle of rising development costs and accelerating churn.
The Real Costs of a Misaligned Portfolio
A poorly managed portfolio creates friction everywhere. Engineering teams get stretched thin building things nobody asked for, while the support team is left fielding complaints about real-world pain points that never get addressed.
This kind of misalignment shows up on the balance sheet. Think about the common consequences:
- Wasted Engineering Cycles: Your best developers burn weeks building features that get almost no adoption, pulling them away from work that could actually drive growth.
- Increased Customer Churn: If your product portfolio doesn't solve high-value problems, your customers will eventually find a competitor who does.
- Missed Revenue Opportunities: High-potential feature requests from your biggest enterprise clients get buried in a backlog full of low-priority noise.
The industry is waking up to this reality, and the numbers show it. The market for product portfolio management software was valued at a staggering 7.46 billion in 2024. It’s projected to nearly double, hitting ****13.6 billion by 2029. This isn't just a trend; it's a clear signal that tech leaders are desperate for a better way to manage their products. You can find more insights about this rapidly growing market and see why this shift is happening now.
Traditional vs Revenue-Driven Portfolio Management
The old way of doing things just doesn't cut it anymore. Moving from a feature-factory mindset to a revenue-driven one requires a completely different approach to how you evaluate and prioritize work.
Here’s a look at how the two models stack up:
| Aspect | Traditional Approach | Revenue-Driven Approach |
|---|---|---|
| Primary Goal | Ship features, meet deadlines | Solve customer problems, drive revenue |
| Key Inputs | Gut-feel, "squeaky wheel" requests, competitor features | Customer behavior data, churn signals, revenue impact |
| Success Metrics | Velocity, features launched | Retention, expansion revenue (MRR), adoption rates |
| Decision-Making | Subjective, opinion-based | Objective, data-backed |
| Outcome | Bloated, low-impact product | Lean, high-value product that grows the business |
This table makes it clear: the revenue-driven approach isn't just an iteration, it's a fundamental change in philosophy that aligns product development directly with financial health and customer success.
Shifting to a Revenue-Driven Mindset
Breaking this old cycle requires a big shift in thinking. Truly effective product portfolio management isn’t about building more features. It's about solving the right customer problems—the ones that are directly tied to keeping customers happy and growing revenue.
By connecting every product decision to a clear business outcome, you transform your portfolio from a cost center into a powerful growth engine. This data-first approach removes ambiguity and empowers teams to focus on what truly matters.
This guide is your playbook for making that shift. You'll learn how to evaluate your products based on their actual value, prioritize work using real revenue and behavioral signals, and make those tough lifecycle decisions with confidence. It’s time to build a portfolio that fuels growth, not just fills a roadmap.
How to Calculate the True Value of Your Products

To really get a grip on your product portfolio, you have to get brutally honest about what each product and feature is actually worth. I'm not talking about surface-level metrics like monthly active users. The goal here is to build a "Product Value Scorecard" that ties every single part of your product directly to real, tangible business outcomes.
Think of this scorecard as your single source of truth. It's what helps you cut through the noise of vanity metrics and see clearly how different features impact revenue, drive customer adoption, or even correlate with churn. It’s all about turning a mess of scattered data points into a clear, quantifiable value.
Blending Quantitative and Qualitative Data
A truly effective value scorecard does more than just crunch numbers—it finds a way to quantify the qualitative. All that customer feedback living in support tickets, sales call notes, and user interviews is a goldmine of value signals, but it’s useless until you make it measurable.
This is exactly why the strategic portfolio management market is booming. It was valued at 2.05 billion in 2025 and is on track to hit ****5.10 billion by 2034. That growth is fueled by the demand for tools that can make sense of complex data, like spotting which usage patterns predict churn.
To start building your scorecard, you first need to gather the right inputs.
Quantitative Inputs to Track:
- Revenue Attribution: Which features are most popular with your highest-paying customers?
- Adoption Rate: What percentage of new users try a specific feature in their first 30 days?
- Churn Correlation: Are customers who stop using a particular feature more likely to cancel their subscription?
These metrics give you the hard-data foundation. They tell you what is happening in your product.
Turning Feedback into Financials
Once you know the what, it's time to figure out the why. This is where you have to dig into all that qualitative feedback. For instance, you can calculate the actual dollar value of a recurring bug by analyzing chat transcripts from a tool like Intercom or Zendesk.
Let's play out a real-world scenario. Say five of your enterprise customers, each paying 2,000 a month, report the same annoying bug over a single quarter. Just like that, you're looking at a direct revenue risk of ****30,000 tied to that one issue. This simple math instantly turns a vague support complaint into a powerful financial argument for getting it fixed.
The same logic works for feature requests. If your sales team tells you they lost three deals, each worth 50,000 in annual recurring revenue (ARR), because your product was missing a key integration, that feature request now has a ****150,000 price tag on it. To make this work, you have to learn how to collect customer feedback effectively and turn it into a system.
The magic happens when you stop seeing feedback as just opinions and start treating it as financial data waiting to be unlocked. Every support ticket, every sales call, every user interview contains clues about revenue, risk, and opportunity.
This is how you get the concrete numbers you need to justify decisions to stakeholders. Instead of saying, "a lot of customers are asking for this," you can confidently state, "This feature represents a 150,000 ARR opportunity and will help us mitigate an existing ****30,000 churn risk." It’s a completely different conversation.
Building Your Product Value Scorecard
Now that you have both quantitative and qualitative data, you can build a simple scorecard. This doesn't need to be some complex data science project; it's a practical tool to help you compare apples to apples.
Here’s a basic structure to get you started:
| Feature/Product | Monthly Revenue Impact | Churn Risk Score (1-10) | New User Adoption (%) | Strategic Alignment (1-10) | Total Value Score |
|---|---|---|---|---|---|
| Feature A | $15,000 | 2 | 65% | 8 | 8.1 |
| Feature B | $2,000 | 7 | 15% | 3 | 3.8 |
| Bug Fix C | -$30,000 (Risk) | 9 | N/A | 5 | 9.2 (Urgency) |
This kind of scorecard gives you a holistic view. It balances direct revenue generation against critical factors like risk mitigation and long-term strategic fit. If you want to get even more granular with your revenue metrics, our guide on calculating customer lifetime value for SaaS is a great place to dive deeper.
Ultimately, this data-driven approach pulls emotion and office politics out of the decision-making process. It creates a shared language for product, engineering, and leadership, ensuring every resource is put toward the work that delivers the most significant impact on the business.
Prioritize Your Roadmap with Revenue and User Behavior
Now that you have a solid handle on the value of each feature, it's time to talk about prioritization. Let's be honest: the old-school annual plan is dead on arrival. The second you publish it, it's already out of date. To really manage a product portfolio today, you need a dynamic roadmap that actually responds to what the business and your users need right now.
This means you have to get comfortable balancing competing demands. On one hand, you’ve got a massive enterprise prospect dangling a huge contract if you build one more thing. On the other, you’ve got a nasty bug that's quietly causing your smaller customers to churn. Without a clear, data-driven way to decide, you’re just left with a battle of opinions. That’s not a strategy.
From Support Tickets to Revenue Signals
The real trick is to start translating every bit of customer feedback into a signal you can measure. A single support ticket? That’s just an anecdote. A pattern of tickets coming from a specific customer segment? That's a powerful churn predictor staring you in the face. This is where a revenue-driven mindset completely changes the game.
Imagine you start seeing a spike in support tickets from your "SMB - Marketing Agencies" segment. An automated system can flag this as a high churn risk, instantly turning a technical problem into a direct threat to a specific revenue stream.
That's when things get interesting. This data can automatically create a ticket in your dev tracker—like Jira—but with a crucial piece of information attached: a calculated revenue-impact score. This score could represent the total monthly recurring revenue (MRR) of every customer affected, turning an abstract bug into a hard number. Suddenly, your product managers have the concrete data they need to make confident, defensible roadmap decisions.
Here's a look at how a backlog in Jira might be organized, with the most critical, high-impact items rightfully sitting at the top.
This screenshot shows a pretty standard development backlog. A revenue-driven system simply enriches this view, ensuring that the tasks at the top aren't just there because they're "important," but because they have the highest quantifiable business impact.
Building a Dynamic Prioritization Matrix
A prioritization matrix is a simple but incredibly effective way to visualize these competing demands. It's a tool that helps you weigh the potential upside of that shiny new feature against the urgent need to stop the bleeding from a revenue-damaging problem. If you're looking for a solid framework, you can learn more about setting up a robust feature prioritization matrix to guide your team.
A truly great matrix doesn't just look at revenue. It balances a few key factors:
- Revenue Impact: This could be the potential new MRR from a feature or the current MRR at risk from a bug.
- User Adoption: How many people will this actually affect? Is it a niche feature for power users or something for everyone?
- Strategic Alignment: Does this move the needle on our bigger company goals?
- Development Effort: What’s the real cost in engineering time?
Prioritization isn't about finding the "perfect" order for your roadmap. It's about creating a transparent, repeatable system that ensures your team is always working on the thing with the highest possible impact on the business right now.
This data-first approach is quickly becoming a requirement for survival. As the global Project Portfolio Management (PPM) market is projected to skyrocket from **7.8 billion in 2024 to **13.7 billion by 2029, the stakes are high. We've seen this in action—German manufacturing firms, for example, used advanced portfolio tools to cut their time-to-market by 22% and boost project ROI by 18%. This isn't just a product management exercise; it's a core business function. In fact, AI-augmented PPM tools that can analyze support tickets and usage data to put a dollar value on bugs are expected to add another +2.8% to global growth forecasts. You can read the full research about these market trends to see where this is all headed.
When you connect user behavior directly to revenue, you take the guesswork out of the equation. You create a clear, logical line from the daily work your developers are doing to the financial health of the company, and that empowers everyone to get behind a roadmap they truly understand.
Making Tough Calls with a Product Lifecycle Framework
The hardest part of managing a product portfolio isn't launching shiny new features. It's knowing which ones to let go.
Let's be honest: not every product or feature can be a star. Clinging to underperformers is a trap that siphons resources, time, and energy away from what could be your next big win. This is precisely why having a clear, objective product lifecycle framework isn't just a "nice-to-have"—it's an essential tool in your arsenal.
Instead of navigating these decisions with gut feelings or, worse, emotional attachment to a project, a lifecycle framework forces you to make the tough calls based on cold, hard data. It helps you slot every single product and feature into a simple quadrant system based on its real value and how it fits into your company's big picture. This kind of clarity is gold when it comes to allocating your team's precious time.
A solid decision tree can cut through the noise of competing priorities, pointing your team toward high-value work and helping you head off major churn risks before they become five-alarm fires.
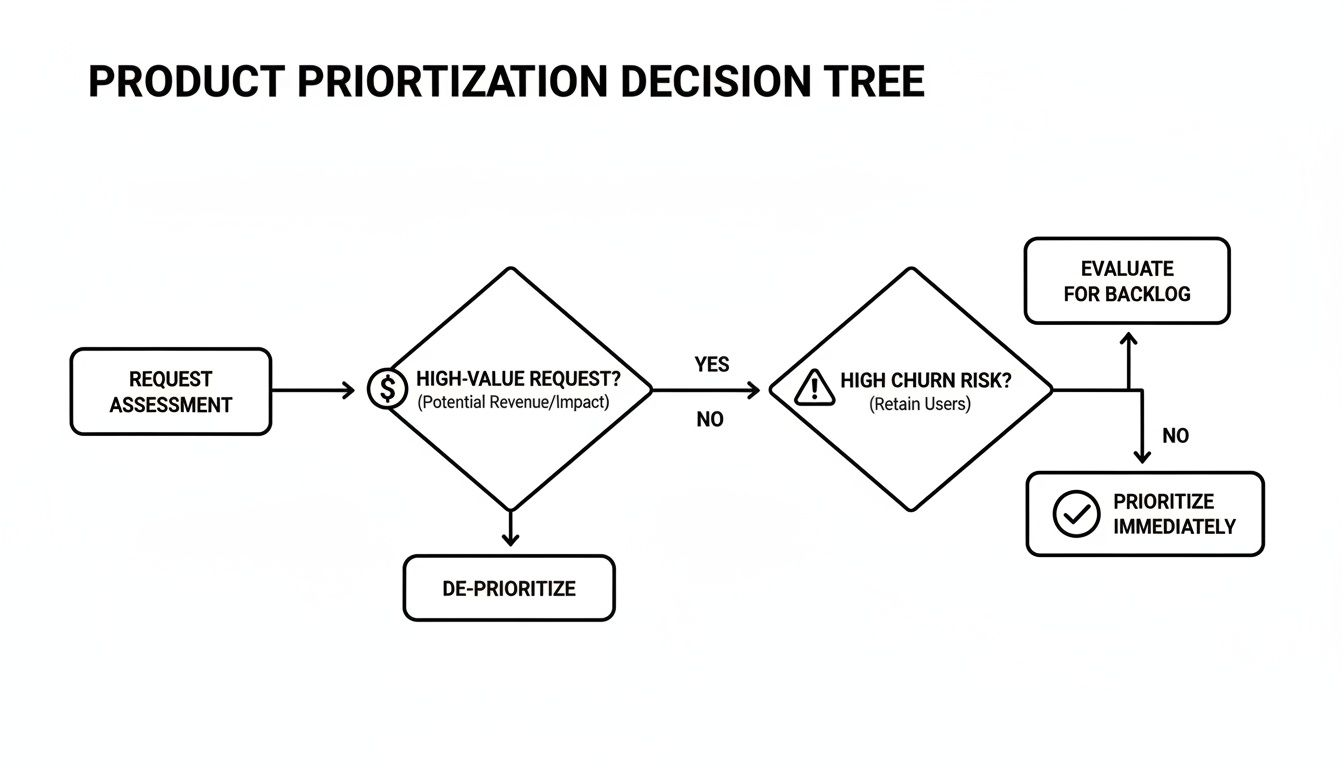
As you can see, a simple visual guide like this helps you triage work fast. By asking two basic questions about value and risk, you can make sure the most critical tasks always rise to the top of the pile.
The Four Stages of the Product Lifecycle
I like to think of a product portfolio as a garden. Some plants are sprouting and need lots of water and attention (Invest). Others are mature and just need consistent care (Maintain). Some need a good pruning to produce better fruit (Optimize). And a few, frankly, need to be pulled up to make room for new seeds (Sunset).
This framework gives you a structured way to tend that garden.
- Invest: These are your rising stars. They check all the boxes: high strategic fit, awesome user adoption, and clear revenue potential. The goal here is aggressive growth, so you pour engineering and marketing resources into them to own the market.
- Maintain: Think of these as your cash cows. They're stable, reliable, and have a loyal user base. They might not be on a rocket ship growth trajectory, but they bring in consistent revenue. The strategy is simple: provide rock-solid support and essential updates, but don't over-invest in bells and whistles.
- Optimize: These products live in a bit of a gray area. Maybe they have decent adoption but don't contribute much to the bottom line, or they serve a key purpose but are a pain to maintain. Here, the mission is to improve their value-to-cost ratio with targeted, smart enhancements.
- Sunset: And then there are the products that are no longer pulling their weight. Usage is dropping, maintenance costs are climbing, they no longer fit the company's direction, or a better solution has come along. The decision here isn't if, but how to plan a graceful exit.
To bring this to life, here's a practical matrix to help guide your decision-making process. I've used variations of this framework for years to bring clarity to roadmap planning.
The Product Lifecycle Decision Framework
| Lifecycle Stage | Key Characteristics | Actionable Strategy | Example Metric Thresholds |
|---|---|---|---|
| Invest | High strategic fit, rapid user growth, strong revenue potential. | Allocate 70% of new feature development resources. Full-scale marketing campaigns. | >25% MoM user growth; tied to >15% of new ARR. |
| Maintain | Stable user base, consistent revenue, low growth. | Allocate 15% of resources for bug fixes, security, and critical updates. | <5% MoM user growth; stable, high-margin revenue stream. |
| Optimize | Moderate adoption but low revenue, or strategically important but high cost. | Allocate 15% of resources for performance improvements or targeted UX enhancements. | High engagement from a small user segment; disproportionately high support ticket volume. |
| Sunset | Declining usage, high maintenance cost, low strategic value. | Allocate 0% of new development resources. Create and execute a deprecation plan. | <-10% MoM user decline; responsible for >20% of tech debt. |
Using a table like this removes ambiguity and helps align everyone, from engineers to the C-suite, on why resources are being allocated the way they are. It turns subjective debates into objective, data-driven conversations.
Spotting the Red Flags for Sunsetting
Knowing when to call it a day on a feature is one of the toughest—but most critical—parts of the job. This decision should never come as a surprise to anyone. It ought to be the obvious conclusion after tracking clear, data-driven red flags over time.
Sunsetting a feature isn't an admission of failure. It's a strategic business decision that frees up your most valuable resource—engineering time—to focus on building the future of your company.
Keep an eye out for these tell-tale warning signs:
- Declining Usage Metrics: Is adoption steadily dropping quarter-over-quarter? Are even your original power users abandoning it?
- High Maintenance Overhead: Does this one feature eat up a ridiculous amount of engineering time for bug fixes and upkeep compared to the value it delivers?
- Low Revenue Attribution: Dig into the data. Are the customers who use this feature your lowest-paying or highest-churn segment?
- Strategic Misalignment: Has the company's direction changed? If so, this product might be a legacy feature with no real role to play in where you're headed.
How to Sunset a Feature Gracefully
Okay, you've made the call. Now what? The process of sunsetting has to be handled with care, or you risk alienating your hard-won user base. Communication is everything.
Start by creating a clear deprecation plan and timeline. Communicate it early and often through every channel you have—in-app messages, emails, blog posts, you name it.
Whenever possible, offer users a viable alternative or workaround within your existing product suite. Most importantly, listen to their feedback during the transition. A well-managed sunset process minimizes disruption and can actually reinforce trust in your brand, even while you’re delivering what feels like bad news.
Make Your Workflow Hum with Integrated Tools
Let's be honest. If your team is still manually dumping CSVs from one tool just to upload them into another, you aren't really managing a portfolio—you're just wrangling spreadsheets. The real magic happens when you build an automated feedback loop connecting your entire tool stack. This is how you turn a bunch of scattered data points into a powerful, proactive growth engine.
This isn't about finding one perfect, all-in-one platform. It's about getting the tools you already use to talk to each other. Imagine piping the voice of the customer directly from platforms like Zendesk or Intercom straight into your product team's world in Jira or Linear. Now, layer in the rich context from sales call transcripts. Suddenly, you have a unified, crystal-clear view of what your customers actually need.
The whole point is to kill the soul-crushing manual work that slows you down. When insights flow automatically, your team can react in minutes, not weeks.
Go from Reactive to Proactive with Real-Time Alerts
Automation really starts to shine when you graduate from just collecting data to building active, trigger-based workflows. You can set up rules that watch for specific patterns and then kick off a whole chain of events without anyone lifting a finger.
For instance, you could build a workflow that triggers an alert anytime a high-value customer—let's say anyone over $5,000 in monthly recurring revenue (MRR)—reports a critical bug. This alert doesn't just ping a support agent. It can instantly:
- Create a high-priority ticket in Jira, automatically enriched with the customer's revenue data.
- Fire off a notification to a dedicated
#firefightingSlack channel for engineering leads. - Add the issue to a "Revenue at Risk" dashboard that product leadership watches like a hawk.
This kind of setup ensures that your most commercially significant problems get eyeballs immediately. It snatches critical issues out of a crowded support queue, directly protecting your revenue. Of course, before you start wiring everything together, it pays to spend some time assessing automation feasibility for your specific needs.
By automating the flow of information, you're essentially building an early warning system for your portfolio. It allows you to spot emerging patterns across thousands of customer interactions and immediately quantify their potential business impact.
And this isn't just for putting out fires. You can use the same logic to spot opportunities. A workflow could monitor for a specific feature request that keeps popping up in enterprise sales calls, flagging a potential six-figure deal-closer for the product team to investigate.
Create a Single Source of Truth from Your Disparate Data
Ultimately, the goal of integrating all these tools is to create one reliable, undeniable source of truth for your portfolio's health. When your customer support, sales, and product development data all flow into one central hub, you start seeing connections that were invisible before.
For example, by combining support ticket data with user behavior analytics, you might discover that customers who complain about a specific UI flaw are 30% more likely to churn within 90 days. That's a game-changer. It elevates a seemingly minor annoyance into a quantifiable churn risk, making it far easier to justify prioritizing a fix.
This unified data also gives your teams a massive context upgrade. When an engineer opens a bug ticket in Jira, they see more than just a technical description. They can also see:
- Who reported it: Including their subscription level and company size.
- The original conversation: With a direct link to the Intercom chat or Zendesk ticket.
- The financial stakes: The total MRR tied to all customers who have run into this issue.
This rich context helps everyone understand the why behind their work. They’re not just closing tickets; they’re solving real customer problems with clear financial implications. For teams ready to build this kind of integrated view, you can learn more about creating self-serve analytics dashboards that pull data from all your different sources.
When your workflow is automated and integrated, you gain the agility to respond to the market faster, put your resources where they’ll have the most impact, and build a product portfolio that truly serves your customers—and your bottom line.
Common Questions About Product Portfolio Management
Switching to a data-driven model for managing your product portfolio is a big move. It means moving away from "gut-feel" decisions and towards a system that’s grounded in hard numbers—revenue and user behavior. It’s a change, for sure, but it’s how you build a product suite that’s more resilient and, frankly, more profitable.
Let's walk through some of the most common questions and roadblocks I've seen product leaders hit when they start down this path.
How Do You Get Stakeholder Buy-In?
Getting your leadership team on board comes down to one thing: talking about business impact. Stop pitching a "new process." Instead, frame this as the most direct way to cut down on churn, capitalize on missed opportunities, and stop wasting precious engineering cycles.
If you're getting blank stares, bring a real-world example to the table. Find one recent, painful churn that everyone remembers. Dig in and show how it was directly tied to a pattern of support tickets or feedback that got lost in the noise. Then, put a number on it.
A concrete story with real data is your best weapon. Showing that a $50,000 churn event could have been spotted and prevented with better signal detection will get more heads nodding than a dozen PowerPoint slides on process improvement.
This tactic changes the conversation completely. You're no longer talking theory; you're talking about tangible financial losses. Suddenly, the cost of not doing this becomes painfully obvious.
What If Revenue Data and Customer Feedback Conflict?
Ah, the classic dilemma. The data says a feature has almost no revenue tied to it, but a small, very loud group of users swears they can't live without it. When your data and your customer feedback are telling you two different stories, it's not time to pick a side—it's time to get curious.
More often than not, this kind of conflict points to a deeper truth you're missing. That "unimportant" feature might be the one thing keeping a small but high-value customer segment from churning. Or, it could be a beloved legacy feature that's actually holding users back from adopting a newer, much better workflow you've already built.
Use this friction as a prompt to ask smarter questions:
- Are these passionate users a signal of a larger market segment we haven't even identified yet?
- Is this feature solving a core problem that a newer, better-funded part of our product should be handling?
- Could we build a modern alternative and give these users a smooth migration path?
How Can Small Teams Start Without Expensive Tools?
You don't need a six-figure software budget to start thinking this way. The secret is to start with the data you already have access to. Focus on building a consistent, manual process first, and you'll quickly prove the need for more sophisticated tools later.
Any team, no matter how small, can get started today. Here's how:
- Start Tagging Everything: In whatever help desk tool you use (Zendesk, Intercom, etc.), create a simple, consistent tagging system for all incoming feature requests and bug reports.
- Connect to Revenue by Hand: Dedicate one person to spend an hour a week reviewing those tagged conversations. They can look up the MRR of each customer in your payment system and log it in a simple shared spreadsheet.
- Hold a Monthly Review: Get the team together to discuss just the top three revenue-impacting issues. That's it.
This simple, manual rhythm builds the right muscles. It proves the value of connecting feedback directly to dollars and cents, making it much easier to justify investing in more powerful, automated tools down the road.
Stop guessing what your customers really want. SigOS ingests your support tickets, sales calls, and usage data to automatically surface the high-impact issues costing you money and the feature requests that will drive growth. Find the signal in your noise today.
Keep Reading
More insights from our blog


Ready to find your hidden revenue leaks?
Start analyzing your customer feedback and discover insights that drive revenue.
Start Free Trial →