Customer Effort Score: A Practical Guide for Modern Teams
Master customer effort score with this practical guide for SaaS teams. Learn survey methods, benchmarks, and how to reduce friction that drives churn.

96% of customers who experience high-effort interactions become more disloyal, compared with only 9% after low-effort experiences. A customer effort score helps teams detect that friction immediately after a task, but its real value appears when teams connect it to churn, expansion, and product usage.
That distinction matters because customer experience teams often collect a score, place it on a dashboard, and stop there. A high score can look reassuring while a specific onboarding step blocks adoption. A low score can trigger an agent coaching session when the actual problem is a confusing billing workflow.
CES works best as a behavioral signal, not a standalone verdict. It tells you how difficult a moment felt. Your product, customer success, and revenue data help explain what that difficulty may cost and where to intervene.
Why Customer Effort Score Exists and What It Actually Measures
The original insight behind CES was uncomfortable for teams built around customer delight. In research introduced through a 2010 Harvard Business Review article, Corporate Executive Board researchers analyzed more than 75,000 customer interactions and found that effort was a stronger predictor of disloyalty than satisfaction. Their most cited result was stark: 96% of customers with a high-effort service experience became more disloyal, compared with 9% of customers with a low-effort experience. The published CES research summary documents that shift in thinking.
Consider a SaaS customer trying to upgrade a plan. The customer finds the right package, reaches a billing screen, discovers that prorated charges aren't explained, and opens a support ticket. An agent replies quickly, politely, and accurately. The customer may still rate the interaction as difficult because the company made the customer do work that the product should have handled.
That is what CES captures. It measures the perceived effort a customer expends to resolve an issue, complete a task, or reach a goal. The task might involve resolving a ticket, completing onboarding, filing a bug, changing a subscription, or finding an answer in a help center.
CES measures a moment, not the whole relationship
CSAT asks whether a customer was satisfied with an experience. NPS asks about broader willingness to recommend. CES asks whether the customer could get something done without unnecessary work.
Those questions serve different operating decisions:
- CES identifies friction: It points to a specific task or interaction that felt difficult.
- CSAT captures immediate reaction: It tells you how the customer evaluated the experience overall.
- NPS reflects relationship sentiment: It provides a wider view of loyalty and advocacy.
A customer can be satisfied with a support agent and still resent the process that forced them to contact support. Conversely, a customer can tolerate a difficult task because they value the product, while the effort still predicts future risk. CES gives product and service leaders a sharper diagnostic than a general satisfaction score.
Practical rule: Use CES after a moment where the customer had to do something. Don't use it as a vague substitute for relationship health.
The original research also reported that CES outperformed customer satisfaction and net promoter-style measures in predicting repurchase and increased spending. A large-scale comparison cited by Henley Business School associated low-effort interactions with 94% repurchase intent and 88% intent to increase spending. Henley's discussion of customer effort and loyalty provides that context.
The implication is operational, not merely academic. If customers struggle to reach value, the answer may belong in product design, documentation, billing, routing, or account management. CES tells you where the customer felt the drag. The rest of your operating system must identify why it happened.
Designing the Survey Question and Choosing Your Scale
The standard CES question is simple:
“How much effort did you personally have to put forth to handle your request?”
Many teams use an agreement-style alternative, such as whether the company made it easy to handle the issue. Both formats can work. The important design choice is to anchor the question to the customer's effort, not the agent's intentions or the company's internal process.
“Did our team provide excellent service?” invites a flattering answer. “How easy was it to resolve your issue?” focuses the respondent on the actual experience.
Choose a stable response format
A 1 to 7 scale gives you more room to distinguish mild friction from severe friction. A 1 to 5 scale is easier to scan and can force a cleaner separation between low-effort and high-effort experiences. Whichever scale you choose, label the endpoints and keep the direction consistent. A high score should always mean the experience was easier if you're reporting standard CES.
| Scale | Anchors | Best for | Trade-off |
|---|---|---|---|
| 1 to 5 | Very difficult to very easy, or strongly disagree to strongly agree | Teams that need a simple response experience | Compresses subtle differences between responses |
| 1 to 7 | Very difficult to very easy, or strongly disagree to strongly agree | Trend analysis and cohort comparison | Creates more room for ambiguous middle responses |
You can calculate CES as the average response score, or report the share of respondents who selected the top response categories. The mean is useful for tracking movement over time. The low-effort percentage is easier to explain to executives because it answers a direct question: what share of customers found this easy?
Trigger surveys at the moment of effort
Transactional surveys belong immediately after a relevant event:
- Support: Send after the ticket is resolved or the interaction ends.
- Onboarding: Send after a meaningful milestone, not merely after account creation.
- Product usage: Ask after the customer completes a core workflow.
- Billing: Ask after an upgrade, downgrade, invoice review, or payment issue.
A relationship pulse can help you understand general health, but it shouldn't replace event-based CES. A customer answering about onboarding much later may remember the outcome without remembering which step created the effort.
Keep the survey short. One scored question and one open-text follow-up are usually enough. The follow-up, “What made this easy or difficult?”, turns a score into a diagnostic clue. Teams building a broader customer feedback pipeline for 2026 can use the same principle across support, product, and lifecycle events.
Avoid bait questions such as “How pleased were you with our excellent support?” They prime respondents toward approval and make the result less useful. Ask about the task, preserve the customer's language, and let the score be uncomfortable when the journey deserves criticism.
Calculating CES and Reading the Benchmarks
There are two practical ways to report a customer effort score.
Mean CES is the average of every response on the chosen scale:
Mean CES = Sum of all response scores ÷ Number of responses
Percent low-effort is the share of respondents who selected the categories your team defines as easy. On a 7-point agreement scale, many teams use the top two boxes, but the threshold must be documented and applied consistently.
Percent low-effort = Low-effort responses ÷ Total responses × 100
The mean gives you a sensitive trend line. It can show movement when customers shift slightly within the upper or middle part of the scale. The percentage method makes leadership reporting more concrete, particularly when the question is whether customers experienced an easy interaction.
Don't confuse an external reference with a target
Published CES guidance commonly places averages between 5.0 and 6.3 on a 7-point scale, while SaaS support interactions often cluster around 5.4 to 5.8. Those ranges come from the available CES benchmark reference published by Parloa's customer effort score guide. Treat them as orientation, not as a universal performance target.
A score's meaning depends on the journey. A 5.6 during enterprise onboarding may hide serious configuration friction because the customer expects guided assistance. The same 5.6 after a simple invoice download may indicate a broken self-service path. Channel, plan, customer maturity, and task complexity all change the interpretation.
| Context | Typical mean on a 1 to 7 scale | Percent low-effort | Notes |
|---|---|---|---|
| SaaS support | 5.4 to 5.8 | Not specified in verified data | Compare by issue type, channel, and resolution path |
| SaaS onboarding | Not specified in verified data | Not specified in verified data | Separate guided enterprise onboarding from self-serve activation |
| Retail | Not specified in verified data | Not specified in verified data | Returns and account changes may create different effort patterns |
| B2B service | Not specified in verified data | Not specified in verified data | Segment by account complexity and stakeholder involvement |
The “not specified” cells are intentional. A benchmark table becomes misleading when teams fill gaps with invented precision. Report the scale, question wording, response distribution, cohort, and trigger alongside the headline number.
A strong CES program doesn't ask, “Are we above the industry average?” It asks, “Which customer journey creates effort, for whom, and what changed after we fixed it?”
Read the score with its distribution. A stable mean can conceal a growing group of highly frustrated customers if easy experiences offset difficult ones. Review low scores by account value, lifecycle stage, product area, and support channel, then connect those groups to downstream behavior.
Connecting CES to Churn Expansion and Product Usage
CES tells you how an interaction felt. It doesn't tell you whether the account will renew, expand, or stop using the product. Those outcomes require separate data.
A useful operating model places the score beside churn, expansion, and product usage. Each metric answers a different question. CES identifies friction at a moment. Usage reveals whether the customer continues to engage. Churn and expansion show whether the relationship ultimately contracts, stays, or grows.
The verified research supports the loyalty connection without supplying the account-level SaaS multipliers often used in sales decks. It reports that low-effort interactions were associated with 94% repurchase intent and 88% intent to increase spending. That makes CES commercially relevant, but it doesn't justify claiming that a particular score causes a specific churn probability for every SaaS cohort.
Build the triangulation before building the dashboard
| Metric | What it reveals | Blind spot alone | Combined with CES |
|---|---|---|---|
| CES | Perceived effort during a task | Doesn't show whether usage or revenue changed | Identifies the friction point behind a behavior change |
| Churn | Lost customers or contracted relationships | Arrives after risk has become an outcome | Helps separate service friction from broader account risk |
| Expansion revenue | Commercial growth within existing accounts | May reflect sales timing rather than product value | Shows whether low-effort journeys support confidence to expand |
| Product usage | Engagement with workflows and features | Usage can fall for reasons unrelated to effort | Helps validate whether a difficult interaction changed behavior |
Start with event alignment. If an account submits a low CES after onboarding, inspect activation and core workflow usage afterward. If a billing interaction receives a low score, check whether the account opens another ticket, pauses adoption, or enters a renewal conversation with unresolved questions. Don't treat the sequence as proof of causation. Treat it as a signal that deserves investigation.
A useful account view might show the latest CES response, the task that triggered it, the verbatim explanation, recent feature usage, open support issues, and commercial status. That context helps a CSM decide whether to call the customer, a product manager decide whether to simplify a workflow, or RevOps decide whether an account alert needs routing.
Teams that track only the average score optimize the visible number. Teams that connect CES to behavior can ask a better question: what did the customer do after the difficult experience?
A Practical Playbook to Reduce Customer Effort
Measurement shouldn't become a substitute for removal. Start with the work that customers shouldn't have to do, then use CES to verify whether the fix changed their experience.
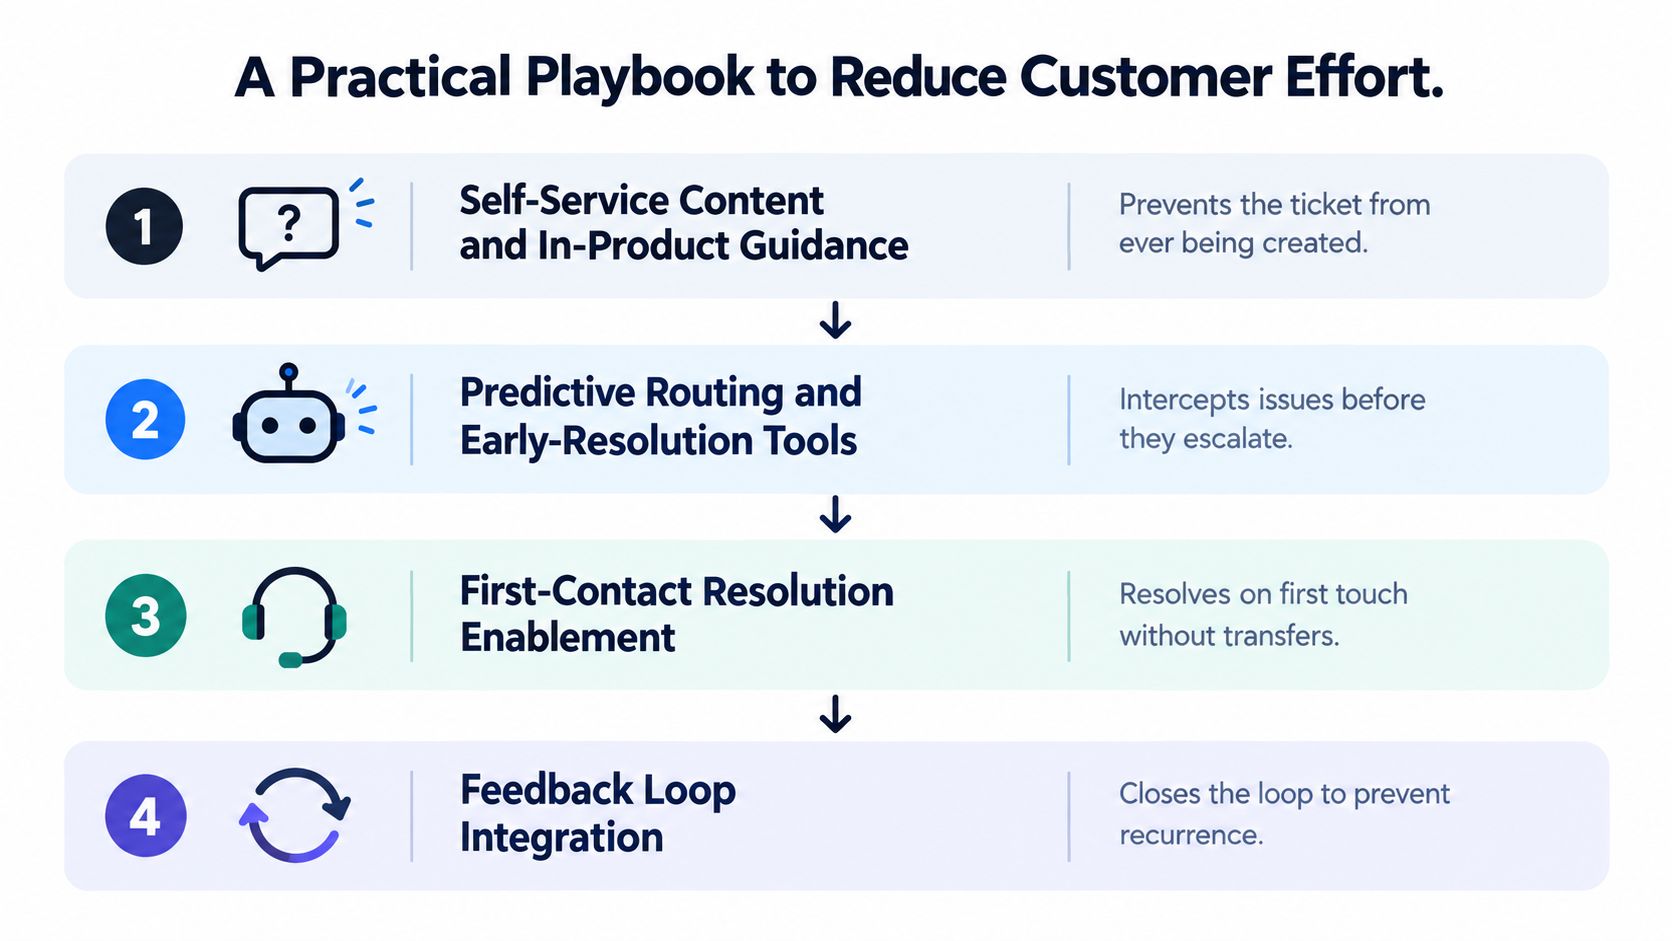
Layer one prevents avoidable contact
Build self-service around actual customer tasks, not around your internal product taxonomy. A help article titled “Subscription lifecycle management” may be accurate but useless to someone searching for “Where can I download my invoice?”
Use contextual help beside the setting or workflow that causes confusion. Make search tolerate customer language. Review failed searches and newly created tickets, then update the path that led customers to ask for help.
Layer two improves the first response
Agents reduce effort when they have the context to resolve an issue without making the customer repeat it. Useful interventions include reply macros for recurring questions, screen-recording reviews that expose confusing explanations, and AI-assisted drafts that agents verify before sending.
Don't optimize handle time at the expense of resolution quality. A fast answer that sends the customer back to the queue creates more work later. Review repeat contacts, transfers, and unresolved reopenings alongside agent productivity.
Layer three reaches customers before escalation
Proactive outreach works when the trigger is specific. Examples include an unexpected usage decline, a billing change that requires explanation, or a feature deprecation that affects an active workflow.
The message should explain what happened, what the customer needs to do, and where to get help. A generic “we're here for you” email adds little value and can create another task.
Layer four fixes the product structure
Tag open-text responses by friction source. Common SaaS problems include forced re-authentication, duplicate settings in different menus, unclear permissions, and onboarding that asks for configuration before the customer understands the product's value.
Product and CX leaders should assign each recurring theme an owner, a proposed change, and a way to check whether effort declined. A practical reference for connecting service improvements to customer experience work is this guide to customer satisfaction improvement.
Product test: If customers repeatedly ask agents to explain a workflow, first test whether the workflow can explain itself.
From Survey Scores to Revenue-Linked Insights
A quarterly CES review is too slow for many operational problems. By the time a team sees that onboarding effort has declined, reads a handful of comments, and schedules a product discussion, the affected accounts may already be disengaging.
The stronger approach treats each survey response as one input in a behavioral analysis system. The score provides a structured signal. The open-text response provides language. Product usage, ticket history, account health, and commercial data provide context.
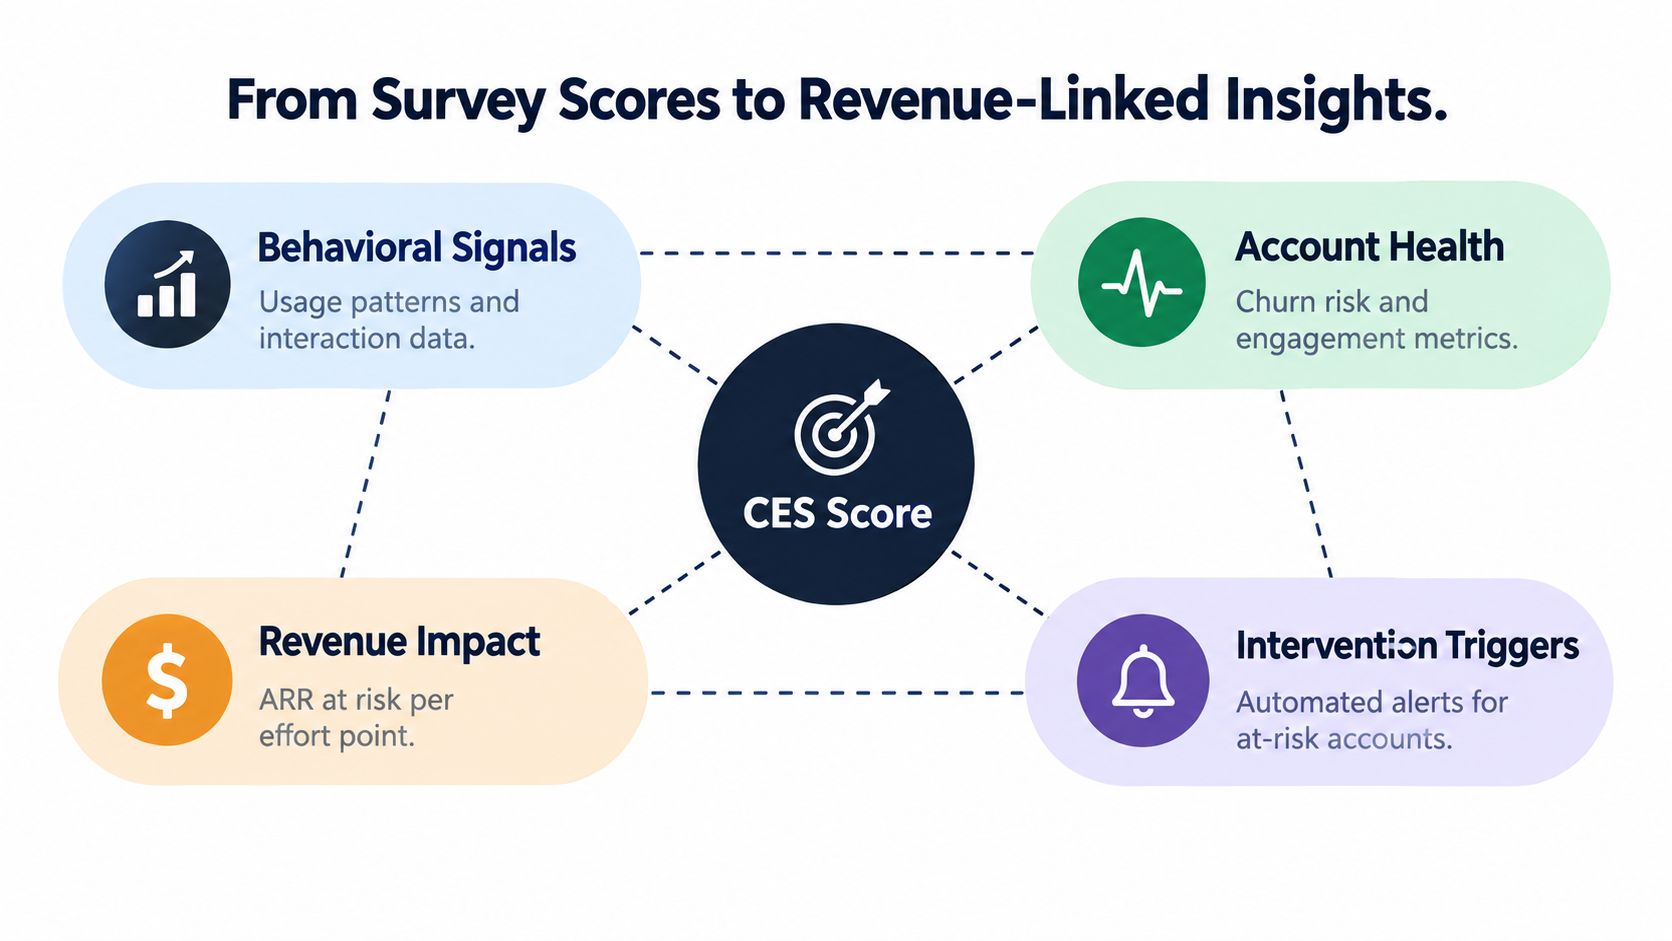
Turn a response into an operating action
Suppose a customer gives a low score after attempting a core workflow and writes that permissions were unclear. The useful output isn't a red cell in a dashboard. It's a connected sequence:
- Classify the friction: Identify permissions as the recurring theme.
- Check behavior: Compare the account's feature adoption and usage path.
- Assess commercial context: Review renewal timing, expansion activity, and account health.
- Route the response: Notify the responsible CSM or support manager.
- Assign the fix: Create a product or documentation task with an owner.
- Measure the change: Recheck CES and the related behavior after release.
Platforms such as SigOS can ingest support tickets, chat transcripts, sales calls, and usage metrics to connect feedback themes with churn, expansion, and revenue impact. That makes CES one input into a workflow rather than the endpoint of a survey program. A broader discussion of this approach appears in customer sentiment analysis.
The important discipline is to separate correlation from causation. If low CES and declining usage appear together, investigate the journey and competing explanations. Don't announce that the survey caused the commercial outcome. Use the relationship to prioritize a test, then observe what changes after the intervention.
A revenue-linked system also makes ownership visible. Customer success handles the account conversation. Product owns structural friction. Support owns the resolution path. RevOps helps connect the signal to account and commercial records. Without that assignment, even excellent analysis becomes another report waiting for attention.
Real-World Examples of Effort Reduction in Action
Consider a mid-market project management vendor that surveys customers after support tickets. The scores cluster around billing changes, and the written comments describe uncertainty about prorated charges and difficulty finding downgrade controls.
The initial response is to coach agents to show more empathy. That may improve the tone of individual replies, but it leaves the customer responsible for interpreting the billing model. A stronger intervention rebuilds the in-app upgrade flow, surfaces the cost calculation before confirmation, and gives customers a clear self-service path for plan changes.
The lesson isn't that a nicer reply lacks value. It's that the largest effort source often sits upstream from the agent. When customers repeatedly ask the same billing question, the product and pricing experience deserve scrutiny before the team adds another training module.
A second pattern appears in developer products
A developer tools company can place CES beside API usage cohorts. A low score after a support interaction may matter more when the same account stops using a core endpoint or abandons a workflow. The CSM can then investigate while the problem is still connected to a recent experience, instead of waiting for a renewal conversation to surface the issue.
This approach doesn't require treating every low score as a churn event. Developers may report high effort because an advanced workflow is complex by its nature, while still increasing usage. Another account may report a moderate score but sharply reduce activity after a permissions change. Context determines priority.
Effort reduction is usually a product problem first and a service problem second, but the evidence must come from both sides.
The practical pattern across these examples is consistent. Survey the moment, read the explanation, inspect what the customer did next, and assign the fix to the team that controls the friction. Don't ask agents to compensate indefinitely for a workflow customers can't complete comfortably.
Implementation Checklist for Product and CX Teams
A CES program can start with a small operating agreement. Decide what event triggers the survey, which team owns the response, how the result enters the account record, and when the team reviews the resulting change.
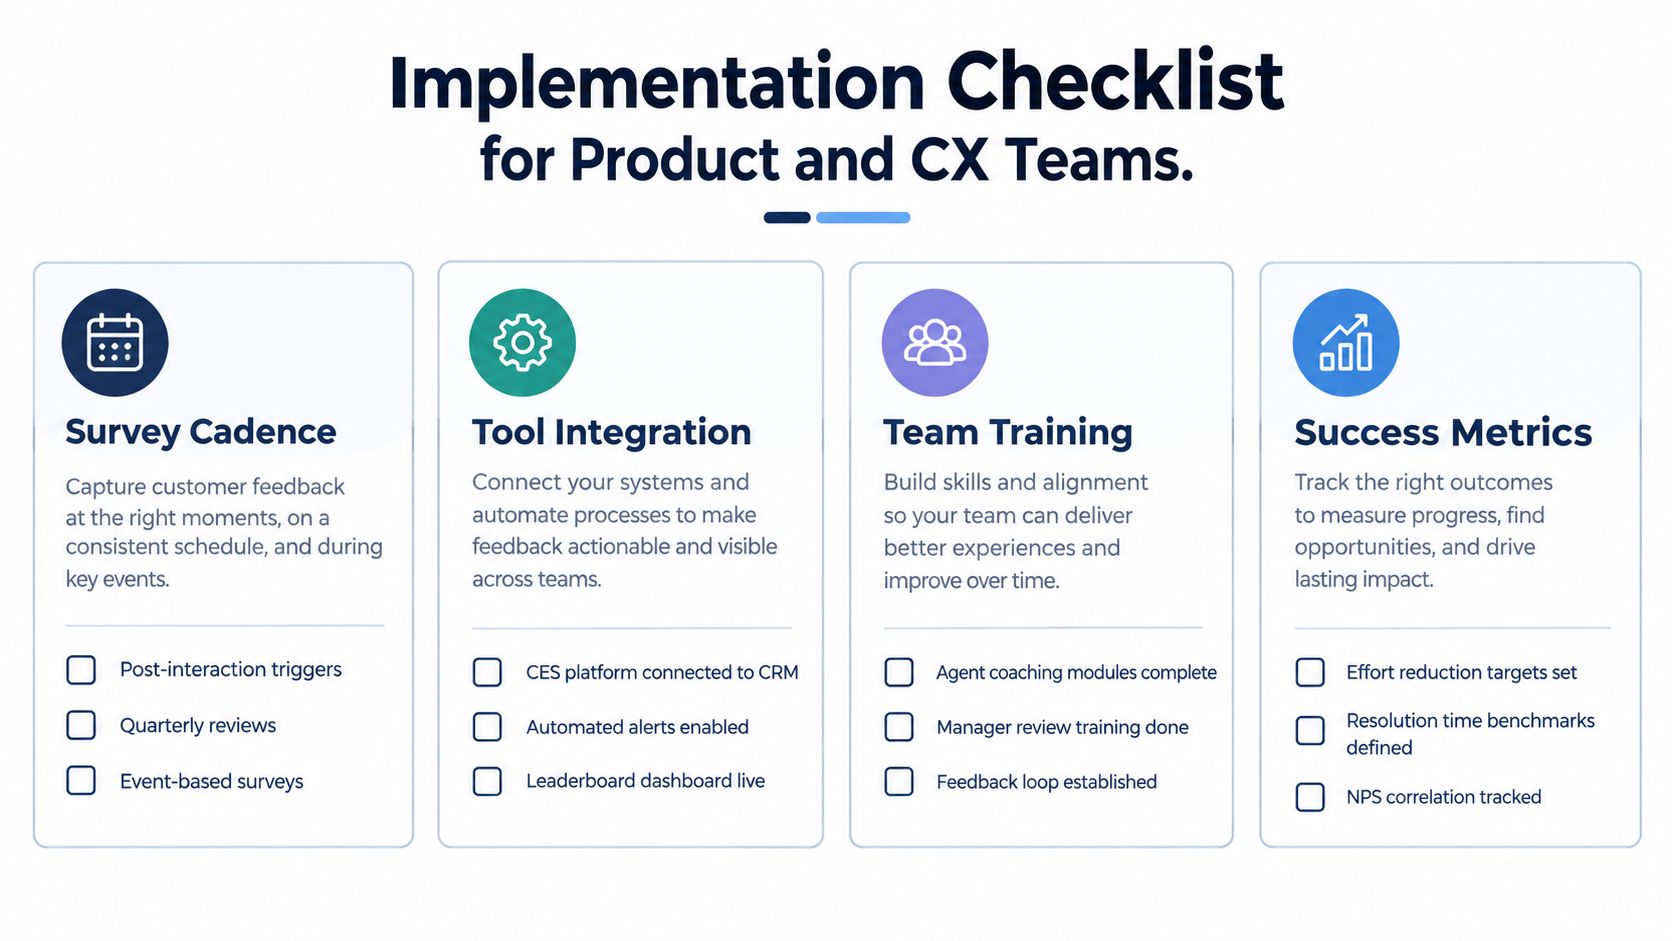
Make four decisions before launch
- Choose the trigger: Use a post-interaction survey for support, onboarding, billing, or a defined product task. Use a relationship pulse separately when you need broader account sentiment.
- Assign ownership: CX owns survey governance, product owns recurring workflow friction, and RevOps owns the connection to account and commercial data.
- Design the dashboard: Show the mean and low-effort share, but break both down by journey, cohort, channel, and lifecycle stage. Add response volume and verbatim themes.
- Set the review rhythm: Every review should end with a named owner, a shipped change or experiment, and a date for checking the effect.
Avoid three common failure modes. Surveying after every interaction creates fatigue and weakens response quality. Treating the mean as a target encourages teams to improve the number rather than the journey. Storing comments in a shared folder guarantees that important patterns remain disconnected from product and account decisions.
A product feedback system can help centralize responses and route themes into the tools where teams already work. The relevant selection criteria are workflow integration, account context, text analysis, permissions, and the ability to connect feedback to outcomes. This overview of a customer feedback platform is one reference point for evaluating that category.
Use a 30-60-90 day sequence
First 30 days: Select one high-value journey, finalize the question and scale, add one open-text follow-up, and connect responses to the customer record. Establish the baseline by cohort rather than publishing one company-wide score.
By 60 days: Review the lowest-scoring themes with product, support, and customer success. Validate whether those themes align with repeat contacts, usage changes, open issues, or account risk. Choose one friction reduction experiment and define its owner.
By 90 days: Ship the agreed change, resurvey the affected journey, and compare the relevant cohort with its prior experience. Report the score movement alongside behavioral and commercial signals, including what remains unproven.
A useful CES program doesn't end with a benchmark. It gives teams a repeatable way to find effort, understand its consequences, and remove the causes customers keep encountering.
SigOS helps product, customer success, and revenue teams connect CES responses with support language, usage behavior, account health, and revenue-linked intervention triggers. Visit SigOS to see how your team can turn customer effort signals into owned workflows and measurable product decisions.
Keep Reading
More insights from our blog



Ready to find your hidden revenue leaks?
Start analyzing your customer feedback and discover insights that drive revenue.
Start Free Trial →