Real Time Customer Insights: The Strategic Playbook
Master real time customer insights with this practical guide covering data architecture, key metrics, and AI-driven implementation

Only 23% of businesses use customer insights in real time, despite the clear revenue value of responding faster to churn signals, service risks, and expansion opportunities. The operational gap isn't data collection alone. It's the delay between a customer event, the insight it creates, and the action a revenue team takes.
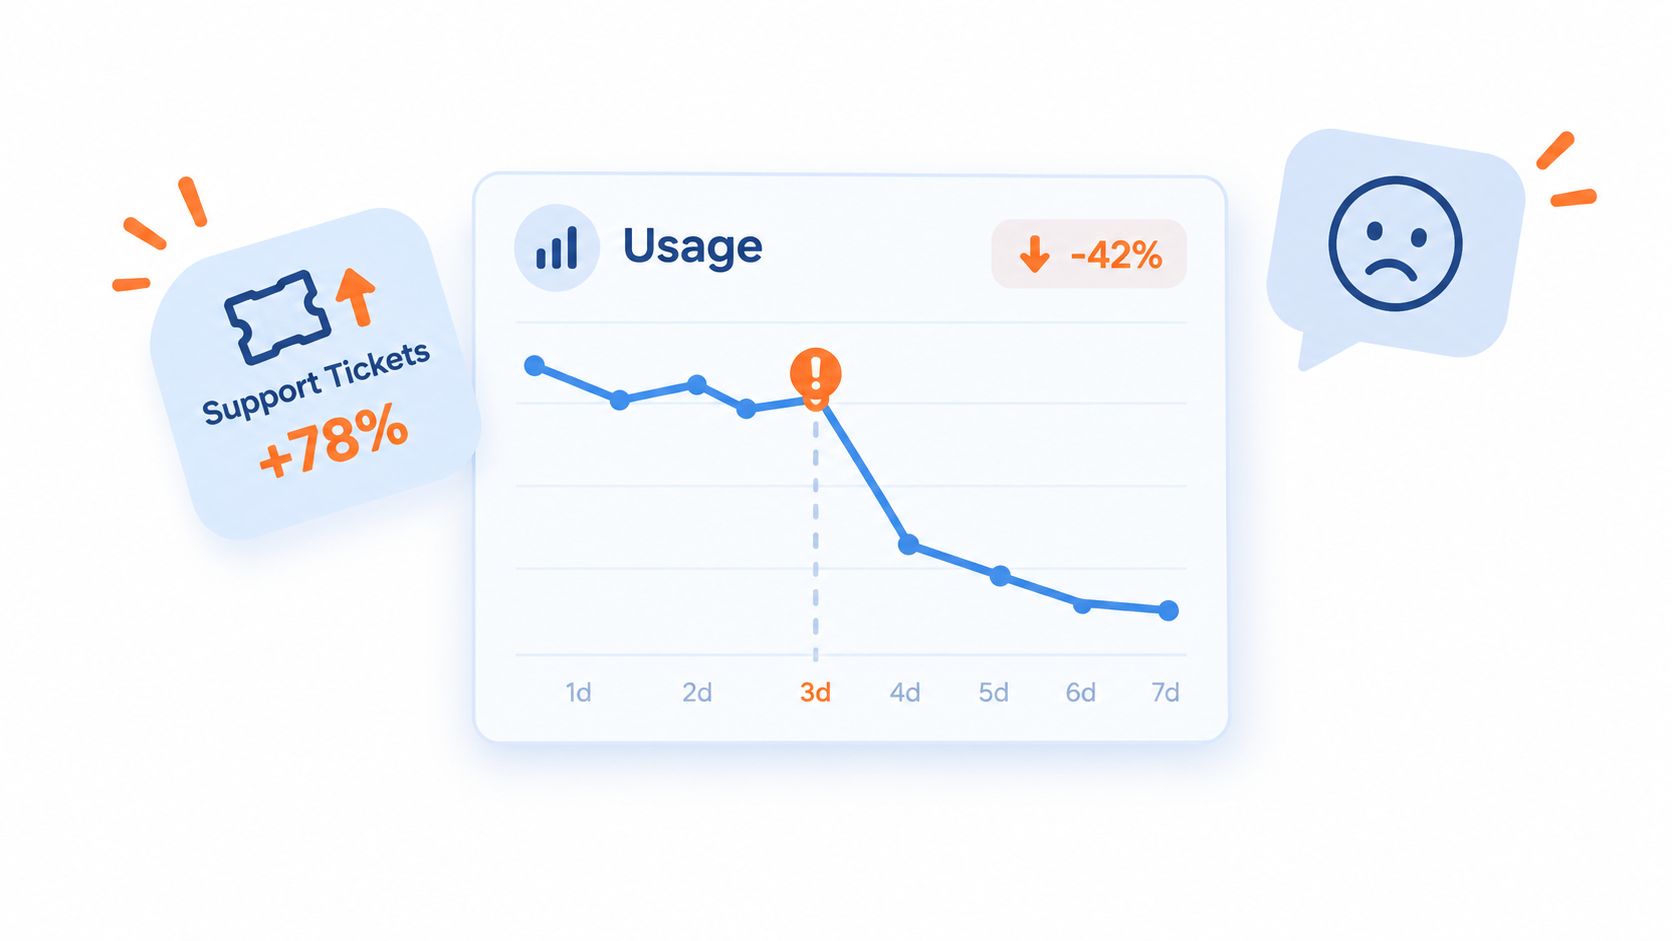
Your product dashboard looks healthy on Monday. By Thursday, a valuable account has stopped using a key workflow, opened several support tickets, and gone quiet in stakeholder communications. The account team discovers the pattern during next week's review, after the customer has already narrowed its options or started an exit conversation.
That delay is where real time customer insights earn their place. They turn changing behavior into an operational signal while a team can still intervene, rather than packaging old activity into a report that explains a loss after it happens. The practical question isn't whether your company has enough customer data. It's whether the right person can act before the decision window closes.
The Hidden Cost of Delayed Customer Intelligence
A high-value enterprise account rarely announces churn in one dramatic message. More often, the warning appears as a sequence: usage declines, support activity rises, communication engagement weakens, and calls contain more frustration than forward planning. In a batch-reporting environment, those signals sit in separate systems until someone combines them during a scheduled review.
By then, the customer's internal decision may already be settled. The customer success manager can still send an escalation email, but the most valuable intervention window has passed. A product team can still investigate the workflow issue, but it's now responding to an account at risk instead of removing friction while the customer is deciding whether to stay.
Why timing changes the intervention
The difference between delayed intelligence and live intelligence is operational. A static report might show that an account's activity fell. A continuously updated system can connect the fall in usage with a new support issue, a frustrated conversation, or a missed onboarding milestone and route the combined risk to the owner.
The SAS discussion of real-time customer engagement cites a 2023 study in which only 23% of businesses reported using customer insights in real time, even though real-time analytics is positioned as an enabler of better customer experience and faster marketing response. That gap explains why many teams feel data-rich but action-poor.
Practical rule: A signal has business value only when it reaches the person who can change the outcome in time to matter.
What delayed reporting hides
Batch cycles also distort prioritization. Teams tend to focus on the loudest complaint, the largest account, or the most recent executive escalation. Those proxies can miss a quieter pattern affecting many customers, or a small product defect creating serious risk for a strategically important workflow.
Real time customer insights don't guarantee retention or expansion. They create the conditions for better decisions by exposing behavior changes earlier and giving product, support, success, and growth teams a shared operating picture. The revenue gain comes from the response, not from the dashboard itself.
From Retrospective Reports to Continuous Analysis
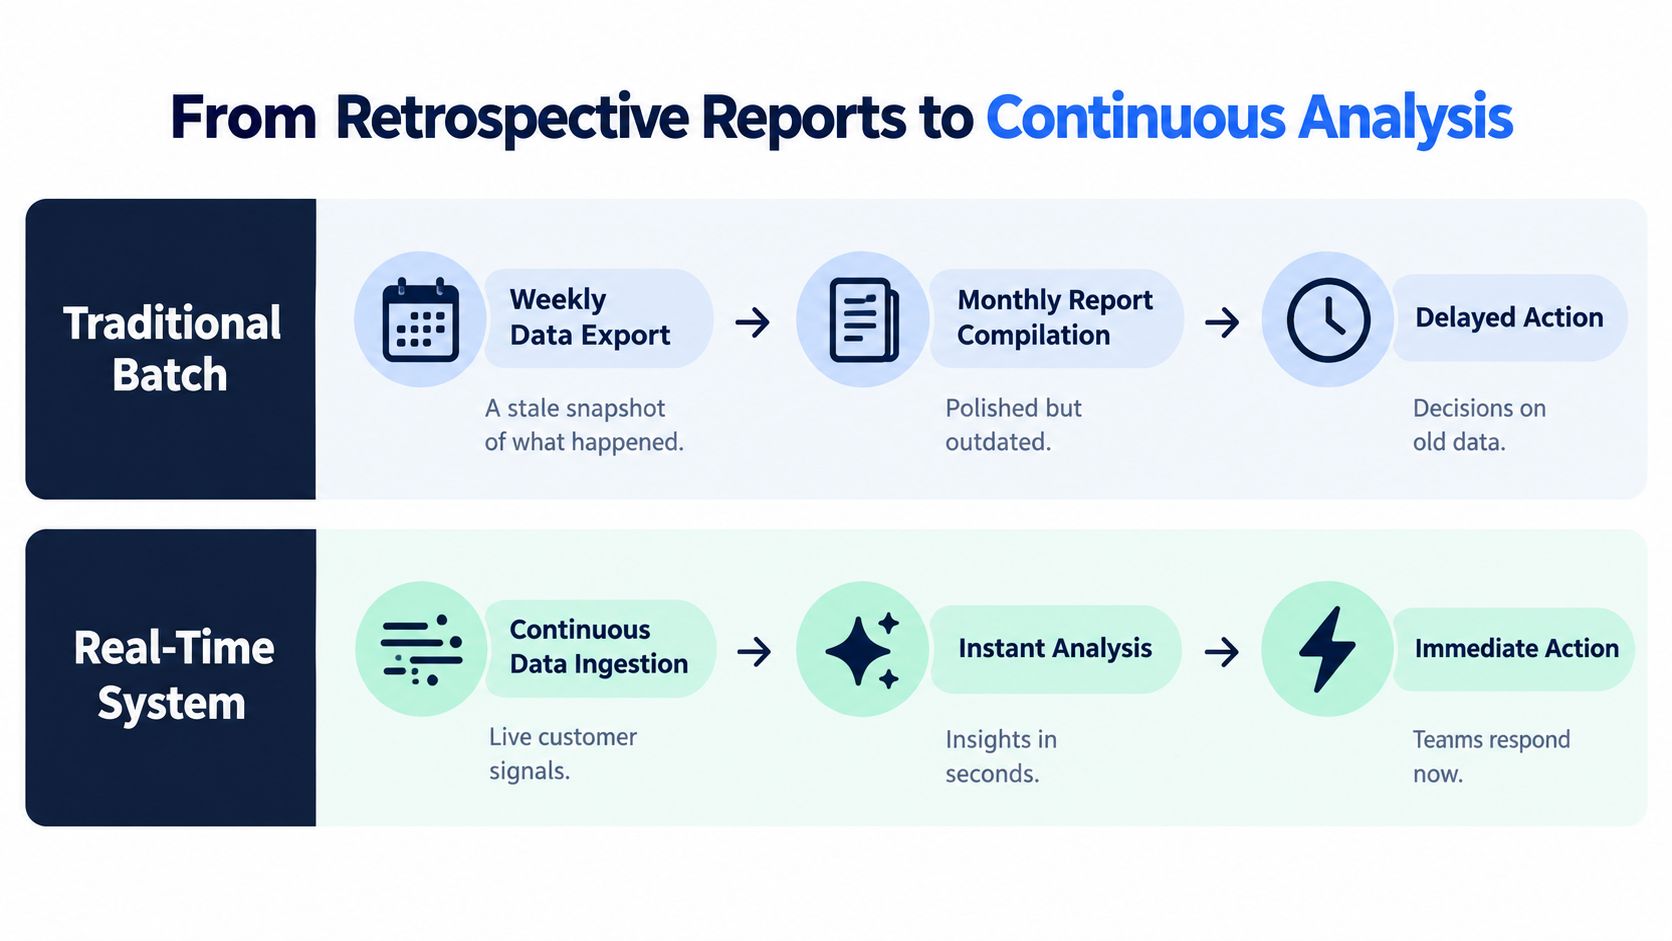
A weekly report can show that an account's activity declined. By the time an analyst confirms the pattern, checks the account history, and assigns follow-up, the customer may already be testing alternatives. Continuous analysis shortens the gap between a behavior change, an insight, and a revenue action.
That shift requires a different data flow. Support tickets, chat transcripts, sales calls, product usage, and engagement events arrive continuously. Identity resolution connects them to the right customer or account, enrichment adds business context, analysis interprets the change, and routing sends it to an owner. The profile updates as events arrive instead of waiting for a scheduled refresh. Microsoft's documentation on real-time journey analytics describes this approach, including updated profiles and journey metrics alongside retained historical interaction data.
Volume isn't the same as useful intelligence
A larger event history does not automatically improve prioritization. A small cluster of recent events showing that a customer stopped completing a core task can matter more than a long record of old activity. Real time customer insights should weight recency, engagement frequency, and interaction depth, then connect those changes to an action the team can take.
Declining purchase frequency, fewer interactions with communications, shorter browsing sessions, and rising cart abandonment all signal churn earlier than static demographic profiles. This analysis of behavioral churn signals explains why behavior changes provide an earlier view of intent and satisfaction.
A practical pipeline separates three layers:
- Event layer: Capture what happened, such as a ticket, failed workflow, call sentiment, or usage change.
- Context layer: Link the event to the account, plan, stakeholder, journey stage, and open issues.
- Decision layer: Choose whether to alert an owner, create an issue, change an outreach sequence, or place the signal in a planning queue.
The decision layer determines whether speed creates value. Fast ingestion followed by manual dashboard review only relocates the delay. Define the action, owner, and escalation rule before adding more event sources.
With that operating model, review meetings spend less time reconstructing history. Analysts examine exceptions, product leaders prioritize emerging patterns, and customer teams intervene while behavior is still changing. The measurable advantage comes from giving the right owner enough context to act before the signal loses its commercial relevance.
Defining Real Time for Different Business Decisions
“Real time” isn't a universal technical setting. It's a service level for a decision.
A support escalation may need immediate routing because a customer is actively blocked. A churn-risk alert may need to reach the account owner while the customer is still evaluating alternatives. A product roadmap decision can usually tolerate slower aggregation because the team is comparing patterns rather than responding to an event in progress.
For customer-experience use cases, real time often means seconds rather than minutes, with an end-to-end capture-to-activation target of about 1–5 seconds, according to Deloitte Digital's analysis of real-time data and insight generation. That target shouldn't be applied indiscriminately. It's a useful benchmark for interactions where delay directly weakens the intervention.
Match latency to the decision
| Decision | Useful response window | Appropriate operating pattern |
|---|---|---|
| Active support escalation | Seconds | Stream event, classify risk, route to an owner |
| Critical product defect affecting a live account | Seconds to minutes | Correlate issue evidence with account impact and create an issue |
| Churn-risk review | Minutes to hours | Combine recent behavior with account context and trigger a playbook |
| Expansion qualification | Hours to a working day | Aggregate intent signals and notify sales or success |
| Roadmap prioritization | Hours to days | Analyze recurring patterns and compare revenue impact |
The point isn't to make every workflow faster. It's to prevent expensive decisions from waiting behind low-value reporting processes. A weekly export may be perfectly adequate for a strategic trend review, but it's a poor mechanism for a customer who has just encountered a blocking defect.
Set the contract before choosing the stack
Define the event, owner, action, and acceptable delay for each priority workflow. If nobody can state what happens after an alert, reducing processing latency won't improve the outcome.
Teams evaluating the technical side can use this guide to real-time data analytics as a reference point, but the implementation should begin with business decisions rather than infrastructure preferences. Build the fastest path for the few moments where speed protects revenue, customer trust, or service continuity.
Building Your Real Time Insights Architecture
Decision speed depends on more than collecting signals. A support ticket, usage decline, or sales conversation creates value only when the right owner receives enough context to act before the customer's situation worsens. Build the architecture around that handoff.
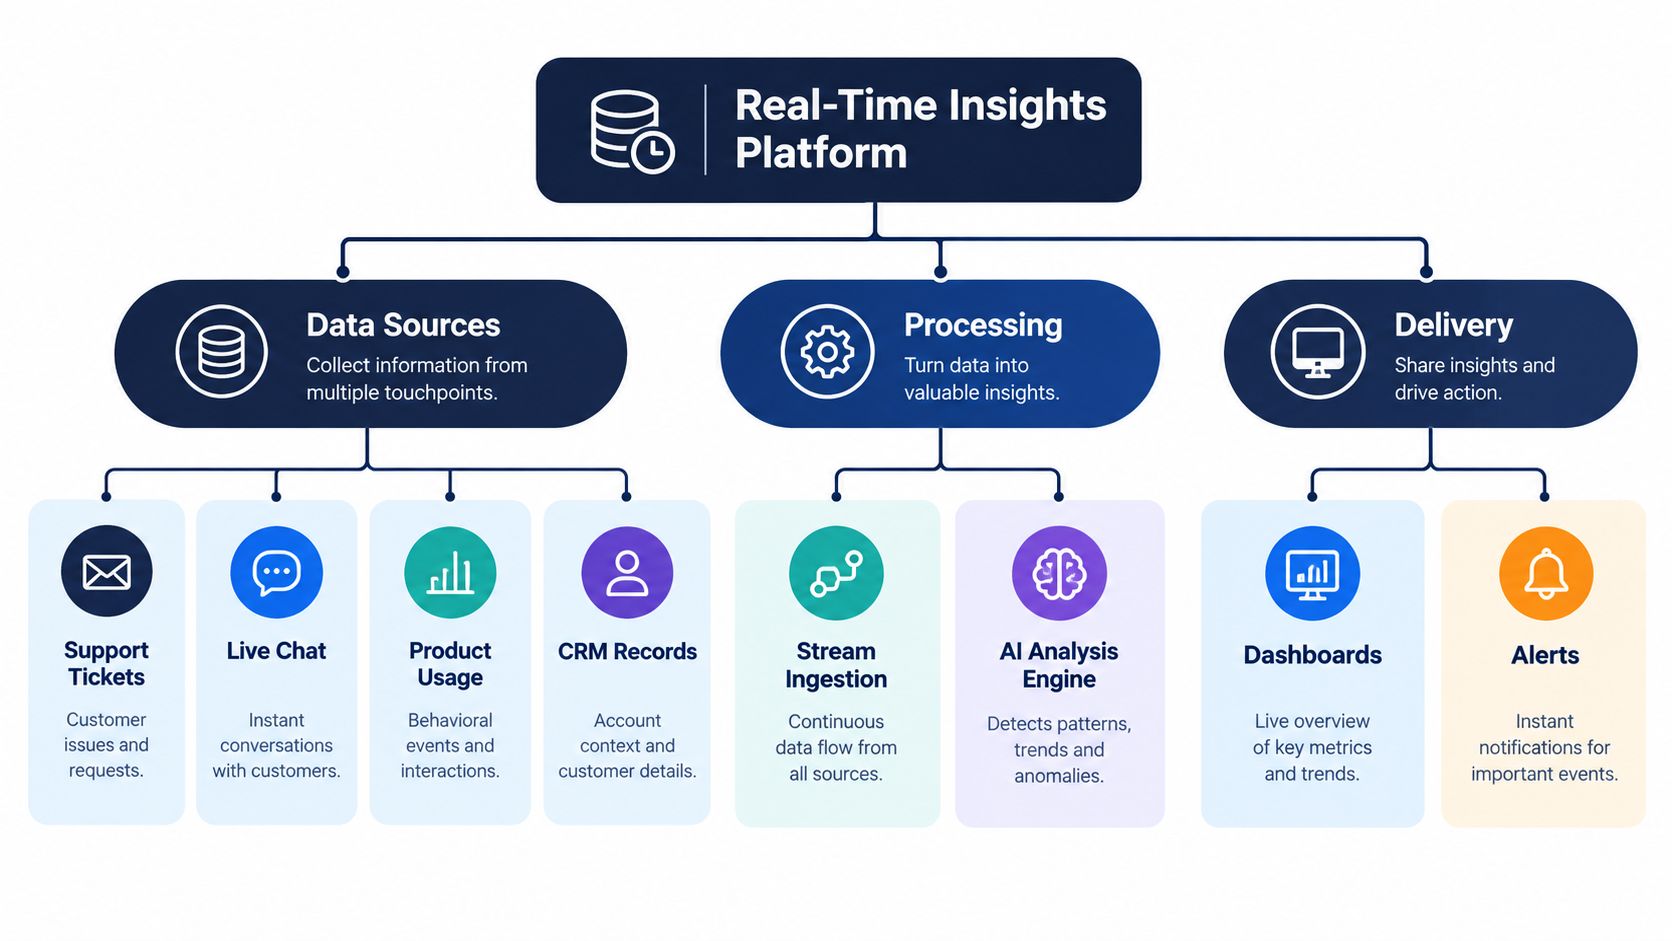
Start with sources closest to customer value: support tickets, live chat, sales calls, product usage, CRM records, and issue-tracking activity. Support exposes friction, usage shows behavior, sales calls reveal intent, and CRM data adds commercial context. Together, these sources let teams connect an event to the account, workflow, and revenue decision behind it.
Connect the sources so a support ticket and a usage drop appear in the same account view within seconds. One-off exports introduce the delay the architecture is meant to remove. Modern platforms can update profiles and journey metrics as events arrive instead of waiting for batch refreshes, but those updates still need reliable identity matching and clear ownership.
Build around decisions, not every available event
Start with a narrow set of revenue-critical workflows:
- Capture source events. Connect systems such as Zendesk, Intercom, Linear, Jira, GitHub, the CRM, and product analytics. Store timestamps, account identifiers, user roles, event types, and source links.
- Resolve identity and context. Map users to accounts, plans, opportunities, support cases, and product areas. A fast signal without this context can still produce the wrong action.
- Analyze continuously. Detect recurring complaints, usage changes, sentiment shifts, defect clusters, and feature requests. Keep the underlying evidence available for review.
- Score business impact. Distinguish a minor usability complaint from a defect affecting a renewal workflow. Consider account value, affected usage, recurrence, and opportunity context.
- Deliver into existing work. Route findings to the tools teams already use, such as a customer-success alert, Jira issue, Linear ticket, or sales task.
- Measure response and outcome. Track acknowledgement, the action taken, and whether the customer or product outcome changed.
Processing speed is only one design constraint. Set access controls, encryption, retention rules, consent handling, and model governance before ingestion begins. Define what data the system needs, who can view it, and how long it remains available. These choices prevent a fast alert from creating a privacy or trust problem.
For the reporting layer, curated sales dashboard examples for GTM teams can help teams turn live signals into usable views. Keep dashboards focused on decisions, owners, evidence, and status rather than event volume.
A real-time data processing workflow improves revenue operations only when its outputs reach execution. If a signal stays inside an analytics environment, observation becomes faster while customer response remains delayed.
AI-Driven Prioritization Over Manual Analysis
Customer teams receive more feedback than analysts can review in time. Ticket sampling, call-note reviews, dashboard checks, and manual theme tagging all compete with roadmap decisions, escalations, and account work. By the time a pattern is confirmed, the team may have lost the window to address a renewal risk, shape an opportunity, or correct a recurring product problem.
AI-driven prioritization reduces that latency gap. It groups related feedback, connects customer language with product behavior, identifies recurring issues, and ranks findings by likely commercial impact. The system ranks and evidences. A product lead decides what receives engineering capacity, customer outreach, or commercial escalation.
What automated analysis should surface
A useful model does more than classify text as positive or negative. It should answer practical questions:
- Which issue affects a workflow tied to renewal or adoption?
- Which feature request appears across accounts with active buying intent?
- Which bug combines rising complaints with a measurable usage change?
- Which customer segment encounters the same friction?
- What evidence supports the recommended priority?
AI creates more value when it connects feedback with behavior and commercial context. Sentiment without account context creates noise. Usage data without customer language can show that adoption declined without explaining why. Combining both gives product, customer, and revenue teams a stronger basis for deciding what happens next.
Use accuracy claims carefully
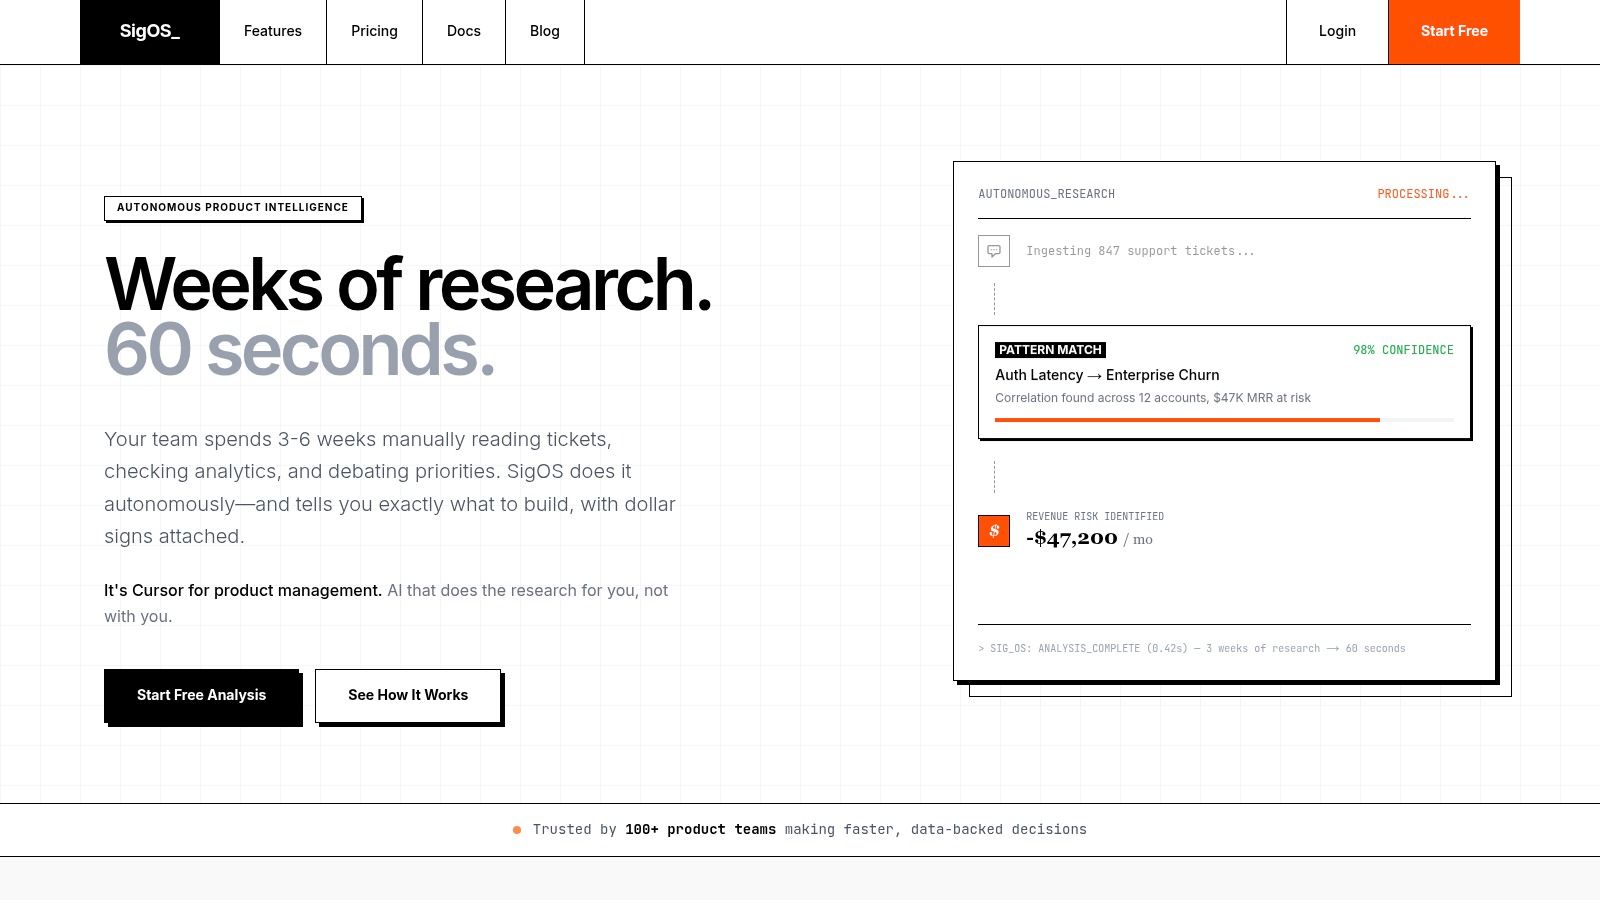
The verified description of SigOS reports 87% correlation accuracy and sub-minute analysis times. It also states that the platform quantifies the dollar value of bugs and prioritizes development work around customer behavior rather than subjective feedback. These figures describe the platform's stated capabilities, not a guaranteed result for every organization or dataset.
Validate recommendations against known outcomes. Product and customer teams should review false positives, missed risks, account mappings, and the time between an insight and the resulting decision. Owners need a way to confirm, reject, or refine each recommendation. Without that feedback loop, a model can appear precise while repeating gaps in the underlying data.
The practical operating model combines automated triage with accountable approval. Let the system surface evidence and rank competing issues. Let designated leaders decide which action receives capacity, then record the decision so the prioritization process improves over time.
Measuring Impact on Churn and Expansion Revenue
Real time customer insights create value only when they change resource allocation or customer behavior. A live alert that nobody owns is an analytics event, not a revenue process.
Start by defining the intervention path for each signal. A usage decline might create a success task and prompt an account review. A cluster of tickets around one workflow might open an engineering issue and notify affected account owners. A feature request appearing in active opportunities might enter a sales-product review with supporting evidence attached.
Connect signals to actions
The operating chain should be visible:
Customer event → interpreted pattern → accountable owner → intervention → outcome
This makes measurement more honest. Don't claim that faster analysis reduced churn just because alerts increased. Check whether the team contacted the customer, resolved the issue, restored adoption, influenced renewal confidence, or advanced an expansion conversation.
Useful measures include:
- Response quality: Did the assigned owner receive enough context to act without reconstructing the case?
- Decision latency: How long did it take to move from event capture to an approved action?
- Intervention coverage: How many high-priority signals received an owner and a documented response?
- Product impact: Did the resulting fix or improvement affect the workflow associated with the signal?
- Commercial movement: Did the account's renewal or expansion path change after the intervention?
A morning dashboard can help leaders focus on the highest-impact issues, but it shouldn't replace event-triggered workflows. Daily review is suitable for prioritization. Immediate alerts are more appropriate when a customer is blocked, a critical defect is spreading, or a high-value opportunity is actively moving.
Teams looking to connect product signals with commercial outcomes can use this framework for revenue impact analysis. The essential discipline is to preserve a trace from the original customer evidence to the business decision, so leaders can distinguish genuine impact from correlation.
The most credible programs also include negative findings. Some alerts won't lead to churn prevention or expansion. Recording those outcomes improves thresholds, reduces noise, and keeps executives from treating every model output as a guaranteed revenue event.
Avoiding the Data Overload Trap
More real-time data can make a team slower. When every event produces a notification, people learn to ignore notifications. When every dashboard exposes another metric, meetings expand without producing clearer decisions. Speed amplifies both useful intelligence and poor operating design.
NICE's overview of real-time customer insights identifies data overload, integration complexity, higher expectations for instant response, privacy, and compliance as central risks. These risks are practical, not theoretical. A support leader who receives too many low-confidence alerts will eventually miss the one that matters.
Design for signal quality
Use a small alert taxonomy with explicit thresholds and owners. For example, separate critical workflow failure from a recurring feature request, and route each to the team that can respond. Give alerts a reason, supporting evidence, confidence level, and recommended next step. A notification that says only “churn risk detected” creates investigation work instead of removing it.
Data quality deserves equal attention. Duplicate accounts, missing timestamps, inconsistent product names, and disconnected identities can produce convincing but incorrect patterns. Build validation into ingestion, monitor source health, and let teams report incorrect matches.
Privacy controls should shape the architecture from the beginning. Minimize sensitive data, restrict access by role, document retention, and ensure customer consent and contractual requirements govern how signals are used. Hyper-personalization without trustworthy governance can create a larger business risk than delayed reporting.
The right target isn't maximum immediacy. It's the shortest safe path from meaningful evidence to accountable action.
Treat latency as one design variable alongside precision, explainability, security, and operational capacity. A slower, well-governed signal can outperform an instant alert that nobody trusts. Start with the decisions closest to churn, service continuity, and expansion, then expand coverage only after the team proves it can respond consistently.
SigOS connects support tickets, chat transcripts, sales calls, usage metrics, and workflow systems into continuously analyzed product intelligence, with alerts and revenue-impact context for teams that need to act quickly. Visit SigOS to see how its real-time approach can help your organization turn customer behavior into prioritized product and revenue decisions.

Ready to find your hidden revenue leaks?
Start analyzing your customer feedback and discover insights that drive revenue.
Start Free Trial →