Customer Satisfaction Improvement: A Framework for SaaS
Master customer satisfaction improvement with a step-by-step SaaS framework. Learn to measure, analyze, and act on feedback to drive revenue and reduce churn.

Teams often treat customer satisfaction improvement like a survey problem. They chase higher scores, celebrate a clean dashboard, then wonder why churn doesn't budge and expansion stays flat. That gap is real, and it's usually caused by silent dissatisfaction, the customers who rarely complain, rarely leave a dramatic comment, and silently decide not to renew.
The better frame is more operational. Customer satisfaction has to be tied to behavioral signals, journey friction, and revenue impact, or it becomes a vanity metric. The market data backs that up, too, with the ACSI hitting a record 77.8 out of 100 in late 2023, a 0.9% rise from the prior period, which shows satisfaction is measured at scale and tracked like a performance indicator, not a soft sentiment score (Business Wire on the ACSI record high).
Why High Satisfaction Scores Can Mask Revenue Risk
High scores can be misleading because they tell you how people answered a question, not whether they'll keep buying. A SaaS team can post solid CSAT numbers while losing quiet accounts that never file tickets, never rage-post, and never fill out a low-score survey. That's the trap: the dashboard looks healthy, but the renewal pipeline is thinning out underneath it.
The problem with average scores
An average score hides the shape of the customer base. If one segment loves the product and another is barely tolerating it, the blended number can still look fine. The same is true when support is fast but the product feels brittle, confusing, or misaligned with the buyer's workflow.
Practical rule: if a score doesn't move with retention, expansion, or ticket deflection, it's not a decision metric yet.
That's why customer satisfaction improvement in SaaS can't stop at sentiment collection. The business effect comes from what customers do next, and one industry summary notes that 81% of customers are more likely to buy again after good service, while 61% say they'd leave after one negative experience (customer service statistics summary). Those numbers don't justify generic cheerfulness, they justify precision.
Revenue risk often lives in silence
Silent dissatisfaction shows up as slower product adoption, weaker renewal intent, and lower expansion appetite. You won't always see a complaint, but you will see the behavioral shadow. If onboarding friction stays unresolved, or if a key workflow feels clumsy, the customer may never escalate it, they just stop leaning into the account.
A more useful lens is to compare satisfaction by channel, journey stage, and customer cohort. Zendesk-style thinking, as reflected in guidance on comparing CSAT across channels, helps explain why scores differ instead of treating the average as the truth. That's also why teams that care about churn often pair satisfaction data with journey analysis and account health review, not just survey rollups. For a practical retention lens, see the internal guide on reducing churn rate.
The product leader's job is to ask a tougher question than “Are scores up?” The better question is, “Which customers are satisfied enough to stay visible, but not engaged enough to grow?”
Defining Metrics That Correlate with Revenue
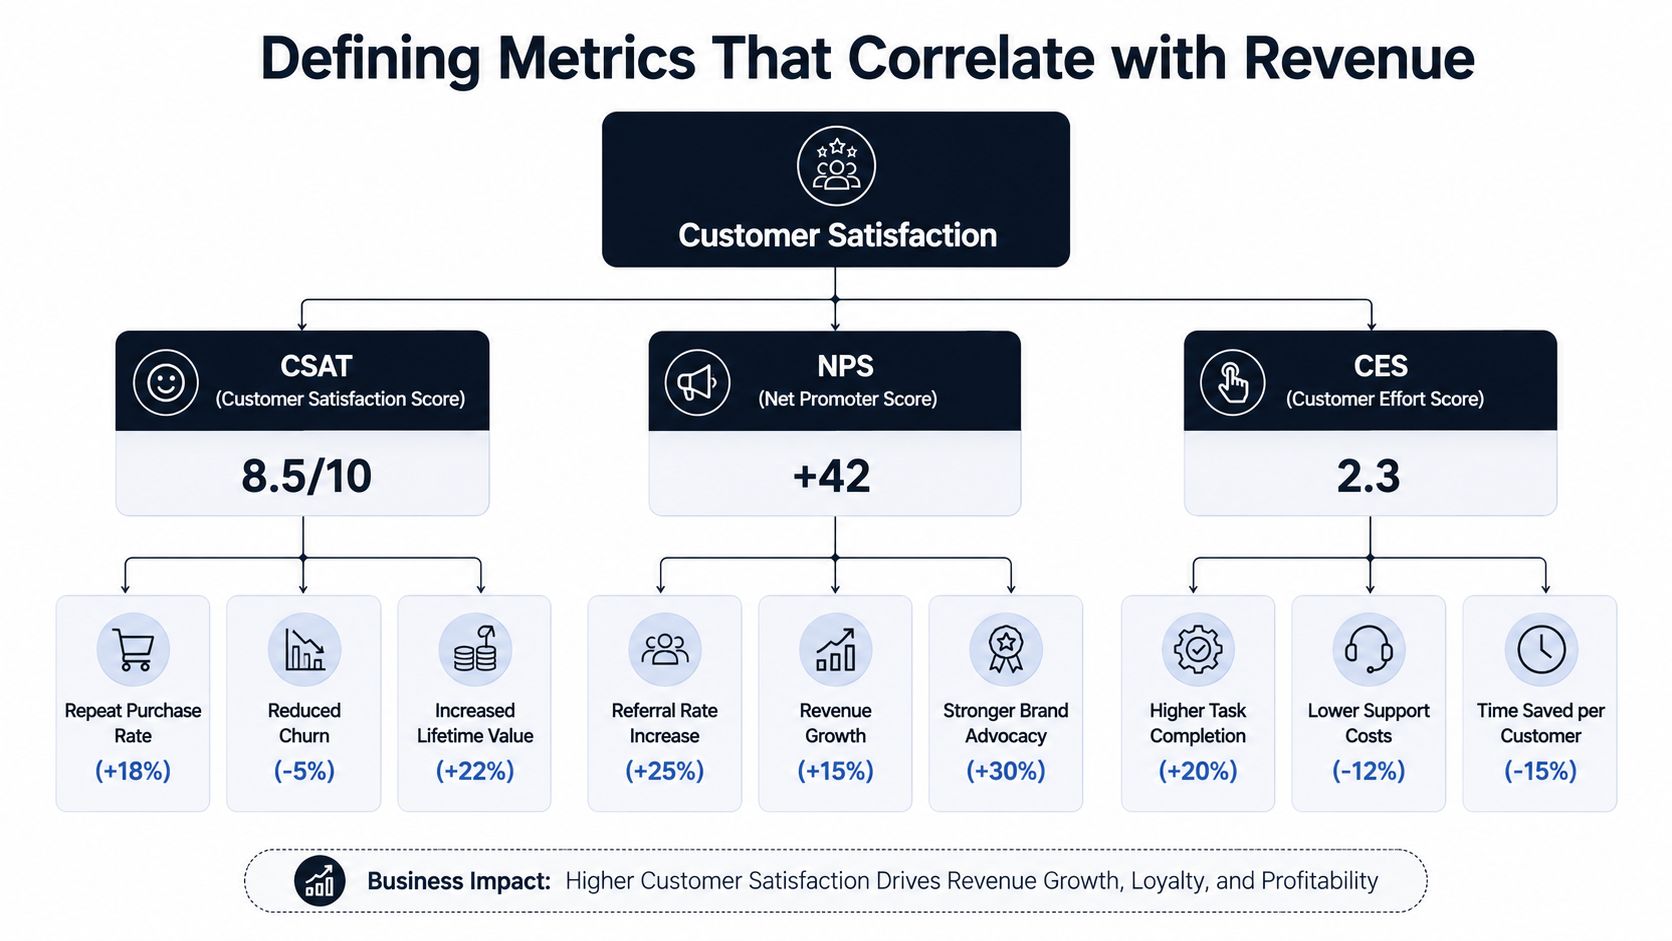
A useful metric stack starts with the customer journey, not the survey form. The right setup doesn't ask every team to worship one number. It asks each team to use the metric that best predicts the next business outcome, then roll those signals into one operational view.
Measure by journey stage, not just at the end
Capture CSAT after support, onboarding, or other high-friction moments. Use NPS as a broader loyalty signal, and CES when the primary issue is effort, not sentiment. Those three belong together because they answer different questions, and they do it at different points in the lifecycle.
A dashboard that only shows monthly averages misses the change curve. Continuous measurement is better because it catches drift early, especially when a release, workflow change, or policy update creates friction that only affects one cohort. Industry guidance also recommends mapping the journey first, then collecting feedback through surveys, live chat, social, and support interactions so teams can see where satisfaction drops and act on the highest-impact issues in near real time (customer satisfaction techniques).
Build one view that product, support, and growth can share
A shared dashboard should segment by:
- Support channel, because chat, email, and in-app support create different expectations.
- Customer cohort, because new users and long-tenured accounts rarely experience the product the same way.
- Journey stage, because onboarding frustration and renewal anxiety are not the same problem.
The goal is not more charts. The goal is an alert that says, in plain language, which segment is slipping and where it happened. A support manager needs to see which queue is creating friction. A product manager needs to see whether a specific feature or flow is driving it. A growth lead needs to see whether the issue affects conversion or expansion.
Customers don't experience your company as one score. They experience it as a sequence of moments, and the worst one often decides the relationship.
Set thresholds around change, not just level. A modest decline in one high-value segment matters more than a stable global average. Continuous, high-friction measurement is how satisfaction becomes operational instead of ceremonial.
Ingesting and Analyzing Feedback at Scale
Feedback lives everywhere, and only the loudest slice of it is read. That means support tickets get attention while chat transcripts, sales calls, reviews, and usage logs sit in separate systems. The result is a distorted view of what customers feel.
The answer is a unified pipeline. Pull the sources into one place, enrich them with tags, then analyze themes against behavioral data so you can separate noise from recurring friction. If you're comparing review collection methods, the WebscrapingHQ Yelp review analysis is a useful example of how public feedback can be organized into patterns without relying on a single channel.
Structure the unstructured data first
Raw feedback has to be normalized before it can be useful. That means tagging entries by journey stage, theme, sentiment, and customer segment. A complaint about billing after onboarding should not be lumped together with a pre-sale objection or an implementation issue.
A practical pipeline usually looks like this:
- Ingest tickets, transcripts, reviews, and logs into a unified store.
- Tag each record with the issue category and lifecycle stage.
- Run sentiment analysis to separate praise, frustration, and neutral signals.
- Compare patterns across channels to see whether the same issue is showing up in different forms.
- Correlate the themes with drop-offs in adoption, escalations, or renewal risk.
The value is not in counting mentions. It's in seeing which mention clusters line up with measurable behavior. A bug that appears a dozen times but affects critical accounts is more important than a hundred low-stakes comments about a cosmetic detail.
Use AI to surface patterns humans miss
Manual review still matters, but it doesn't scale. AI-driven analysis helps cluster similar language, detect recurring pain points, and highlight emerging themes before they dominate the backlog. That's especially important when teams are reading support notes, product reviews, and call transcripts written in different styles. The same problem can appear as “checkout failed,” “payment didn't go through,” or “I had to retry three times.”
For teams formalizing this process, the internal guide on analyzing customer feedback fits well here because it focuses on translating qualitative comments into structured themes. That structure is what lets product, support, and finance talk about the same issue without arguing over anecdote.
The shift is from volume-based reporting to impact-based analysis. Once feedback is connected to usage and account data, the team can stop asking “What did customers say?” and start asking “Which issue is changing behavior?”
Quantifying the Revenue Impact of Satisfaction Gaps
The hard part isn't finding complaints. It's proving which complaint deserves engineering time. If every issue is treated equally, nothing gets fixed in the right order, and the loudest customer wins instead of the most economically important one.
That's why a revenue model matters. You don't need fake precision, but you do need a consistent way to estimate risk. If a friction point shows up in high-value accounts, appears near renewal, or suppresses adoption of a monetized feature, it belongs near the top of the queue.
A useful way to frame it is with an internal scoring model.
| Issue Type | Churn Risk Score | Expansion Revenue at Risk | Priority Tier |
|---|---|---|---|
| Onboarding confusion | High | High | P1 |
| Billing workflow friction | High | Medium | P1 |
| Minor UI inconsistency | Low | Low | P3 |
| Feature request for advanced workflow | Medium | High | P2 |
The table isn't about pretending the numbers are exact. It's about forcing a conversation that joins customer sentiment, account value, and implementation timing. If a workflow bug blocks adoption in a segment that is likely to expand, the revenue impact is bigger than the raw complaint volume suggests.
Translate feedback into economic terms
A churn risk score should reflect three things:
- Where the issue appears in the journey.
- Who is affected, especially whether the accounts are strategic.
- What the issue blocks, such as usage depth, renewals, or expansion.
If you want a practical example of a tool that tags customer voice, sentiment, and feedback loops into operational themes, Captapi's write-up on sentiment tracking is a relevant reference point. The useful lesson isn't the branding, it's the discipline of converting text into a consistent signal before decisions are made.
Build the business case in the language finance understands
Finance doesn't fund “customer happiness.” It funds reduced risk, retained bookings, and clearer expansion paths. That means the case for a fix should say what the problem blocks, which segment feels it, and what kind of revenue is exposed. If the team can't say that, the fix is probably too vague to prioritize.
If you can't connect an issue to retention, expansion, or cost-to-serve, it's a product hygiene item, not a revenue case.
This is also where a product intelligence layer can help. SigOS is one option in that category, because it ingests support tickets, chat, sales calls, and usage signals to surface issues tied to churn and expansion. Tools like that matter when the goal is to assign economic weight to qualitative feedback, not just collect more of it.
Prioritizing Fixes and Features That Move the Needle
Once issues are scored, the next mistake is to turn the roadmap into a wish list. Customers will always ask for more than the team can build. The core job is to separate fixes that remove friction from features that drive growth.
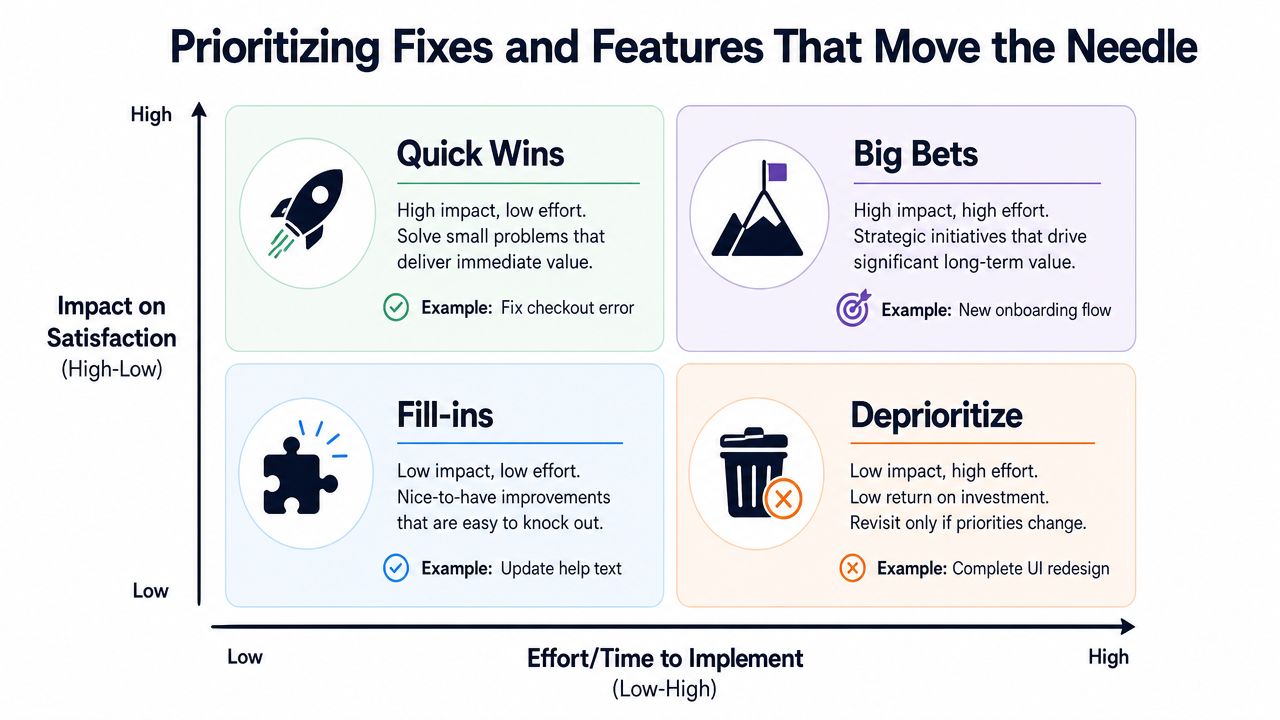
A simple 2x2 matrix works well because it cuts through debate. Put impact on satisfaction on one axis and effort to implement on the other. That gives you four buckets, and each bucket deserves a different decision.
Use the matrix to separate signal from noise
The best near-term work tends to sit in the high impact, low effort quadrant. These are the fixes that remove obvious friction, reduce support load, and improve the customer's immediate experience. They're not glamorous, but they usually pay back fast because they affect a widely felt pain point.
The high impact, high effort quadrant is where strategic work lives. That might be a new onboarding flow, a more resilient workflow, or a feature that enables larger deals. These items need tighter validation because they can consume engineering time for weeks or months, and the wrong one can crowd out more urgent work.
The low-impact quadrants are where teams waste time. Polishing something customers barely notice is a common trap, especially when internal stakeholders have opinions but no usage evidence. If an item looks attractive but affects a tiny slice of the base, it should be deprioritized unless there's a hidden strategic reason.
Validate before you commit
Usability testing is one of the fastest ways to avoid expensive mistakes. Software-product guidance cited in the research notes says testing with 5 to 10 real users can reveal about 85% of usability issues, which is why small, targeted sessions are more valuable than long debates in a planning meeting (maximizing customer satisfaction through software product engineering). That's enough evidence to confirm whether the issue is real, where it breaks, and what kind of fix is needed.
For teams building a formal roadmap process, the internal feature prioritization matrix is a useful companion because it forces the same trade-off discussion in a repeatable format. The key is not the artifact. It's the discipline of asking whether the change affects revenue, support volume, or retention behavior before the sprint starts.
Customers ask for features. Teams should build outcomes.
That's the standard. The best product decisions usually come from solving the underlying task, not the request as phrased in a meeting.
Closing the Loop and Monitoring for Emergent Patterns
A strong satisfaction program doesn't end when the ticket is closed. It ends when the customer sees that their input changed something, and the organization proves it can detect the next issue before it spreads. That's what makes the work cumulative instead of episodic.
I've seen the difference clearly in teams that treated follow-up as part of the product motion, not a support courtesy. One SaaS group sent a personalized note to customers who reported onboarding confusion, logged the fix in the changelog, and then watched for the same theme in weekly feedback clusters. The complaints didn't vanish overnight, but the trend became visible early enough to keep the problem from becoming a churn story.
Build a loop customers can see
The first step is simple. Tell the customer what changed, and make the update specific. If you fixed a broken flow, reduced a confusing step, or clarified a policy, say exactly that. A generic apology doesn't create trust, but a concrete update does.
Then push the new pattern back into the operating cadence. Weekly review of theme clusters is enough to spot emergence if the tagging is clean and the feedback sources are unified. Automated alerts should trigger when sentiment drops in a meaningful way, especially inside a strategic segment or during a release cycle.
Keep the monitoring tied to business outcomes
The last mistake teams make is measuring follow-up success only by response rate or survey sentiment. Those numbers matter, but they aren't the end state. The true check is whether the fix reduced the original friction and changed account behavior in a way that matters to the business.
A good operating rhythm looks like this:
- Customer update sent after the issue is resolved.
- Issue logged in the changelog or release note.
- Weekly theme review catches repeat patterns.
- Automated alerts surface sharp sentiment drops.
- Quarterly correlation review checks whether satisfaction signals still map to revenue outcomes.
That final review matters because the relationship between satisfaction and revenue changes as the product matures. What worked in onboarding might not predict renewal later, and what looked like a support problem may be a product adoption issue.
The teams that keep improving don't just collect feedback. They build a habit of closing the loop, monitoring the next pattern, and treating customer satisfaction improvement as an ongoing revenue discipline.
If you want a system that connects customer feedback to revenue impact instead of leaving it trapped in survey tools, visit SigOS and see how it surfaces the issues that cost real money. It's built to help product, support, and growth teams prioritize the signals that matter, then act on them before silent dissatisfaction turns into churn.
Keep Reading
More insights from our blog


Ready to find your hidden revenue leaks?
Start analyzing your customer feedback and discover insights that drive revenue.
Start Free Trial →