8 Customer Feedback Categories to Prioritize in 2026
Explore 8 customer feedback categories, with examples, detection methods, tagging ideas, and workflows to prioritize issues by churn and revenue impact.
The loudest feedback isn't always the most valuable. A request repeated across a broad, low-value segment may deserve less immediate attention than one account showing declining usage, escalating support friction, and a deal-blocking objection. Volume is evidence of recurrence, not proof of business importance.
Customer feedback categories provide the taxonomy teams need to organize qualitative comments and quantitative signals without flattening them into one undifferentiated inbox. A useful system records the source, customer context, severity, frequency, revenue or churn exposure, and recommended owner for each signal. That context lets a product manager distinguish a stated preference from a behavioral warning, then route both to the right team.
The eight categories below work best as a connected system. A bug report becomes more urgent when usage falls afterward. A feature request becomes more credible when sales objections, expansion potential, and repeated behavior point in the same direction. A low NPS response becomes more useful when linked to the support history and product events behind it.
Platforms such as SigOS are relevant because they connect support tickets, sales calls, usage metrics, and revenue context instead of treating every comment as equal. The objective isn't to collect the most feedback. It's to identify the signals that explain retention, expansion, adoption, and customer risk.
1. Product Bug Reports and Technical Issues
A product bug is a customer-reported failure in expected functionality. It may appear as an error message, a broken workflow, a timeout, data inconsistency, or an integration that no longer behaves as expected. Unlike a general complaint, a bug report can often be tied to a reproducible condition, affected feature, technical environment, and operational consequence.
The first useful distinction is between impact and inconvenience. A cosmetic defect may generate many mentions because it's visible. A less frequent authentication or data-sync failure may affect a critical workflow and put an entire account relationship at risk. Tagging should therefore capture the affected capability, reproducibility, customer segment, workflow blocked, workaround available, and account lifecycle stage.
Practical rule: Count bug reports, but prioritize the customer workflow and commercial exposure behind each report.
Usage data adds the missing context. If an account stops using a core feature after reporting an error, the bug may be an adoption barrier rather than an isolated support case. If the affected account is evaluating an expansion, the same issue can become a deal risk. SigOS can help correlate bug patterns with account value, usage changes, churn exposure, and expansion signals, giving engineering and customer success a shared basis for triage.

Tagging for engineering and customer success
A practical workflow should connect each report to:
- Failure type: Record whether the signal concerns an error, performance problem, data issue, integration, permissions, or reliability.
- Business consequence: Note the workflow blocked, users affected, and whether a workaround exists.
- Account exposure: Add plan, account value, renewal stage, open expansion opportunity, and recent usage movement.
- Action owner: Route reproducible defects to engineering, communication gaps to support, and adoption barriers to customer success.
Time-to-fix is useful only when paired with impact. A fast resolution of a low-consequence issue shouldn't obscure a severe defect affecting a strategically important account. Automated alerts for clusters can also help teams investigate systemic failures before they become widespread.
A short explainer can reinforce why the same technical issue deserves different priorities across accounts.
2. Feature Requests and Enhancement Suggestions
Feature requests express what customers want to do that they can't do easily today. They include requests for new capabilities, changes to existing workflows, additional integrations, reporting improvements, and configuration options. They reveal demand, but they don't automatically reveal priority.
A request from a customer preparing for expansion carries a different implication from the same request submitted by a user with limited adoption. The requester's account value, use case, product behavior, renewal timing, and likelihood of recommending or expanding should sit beside the request itself. Otherwise, teams risk building the most frequently requested idea rather than the capability that removes the largest commercial constraint.
Feature requests can be tagged by job to be done, affected persona, lifecycle stage, segment, urgency, competitive alternative, and expected business outcome. A request tied to onboarding friction may belong in an activation workstream. A request raised during procurement may be a deal blocker. A request from active users may point to expansion potential.
Separate demand from preference
SigOS can connect feature language with account context and behavioral data, helping teams identify whether a request is associated with expansion conversations, retention, or stalled adoption. That doesn't eliminate product judgment. It gives the product team better evidence for that judgment.
Use a prioritization process that asks:
- Who is asking: Identify account type, plan, role, and strategic value.
- Why they need it: Capture the workflow, job, or business outcome behind the request.
- What behavior supports it: Check whether the requesting segment uses related features or has encountered a measurable friction point.
- What happens commercially: Record expansion potential, renewal risk, deal status, and competitive pressure.
- Who decides: Route validated demand into roadmap review rather than promising delivery from a support queue.
For a practical framework, use this feature prioritization matrix to compare requests using more than raw counts.
Slack's thread feature, Notion's relational database capabilities, Figma's multiplayer collaboration, and HubSpot's custom properties illustrate the type of product capability customers may connect to team adoption or enterprise requirements. These examples are useful as product patterns, not as proof that every repeated request will produce the same outcome.
3. Customer Support Tickets and Help Desk Inquiries
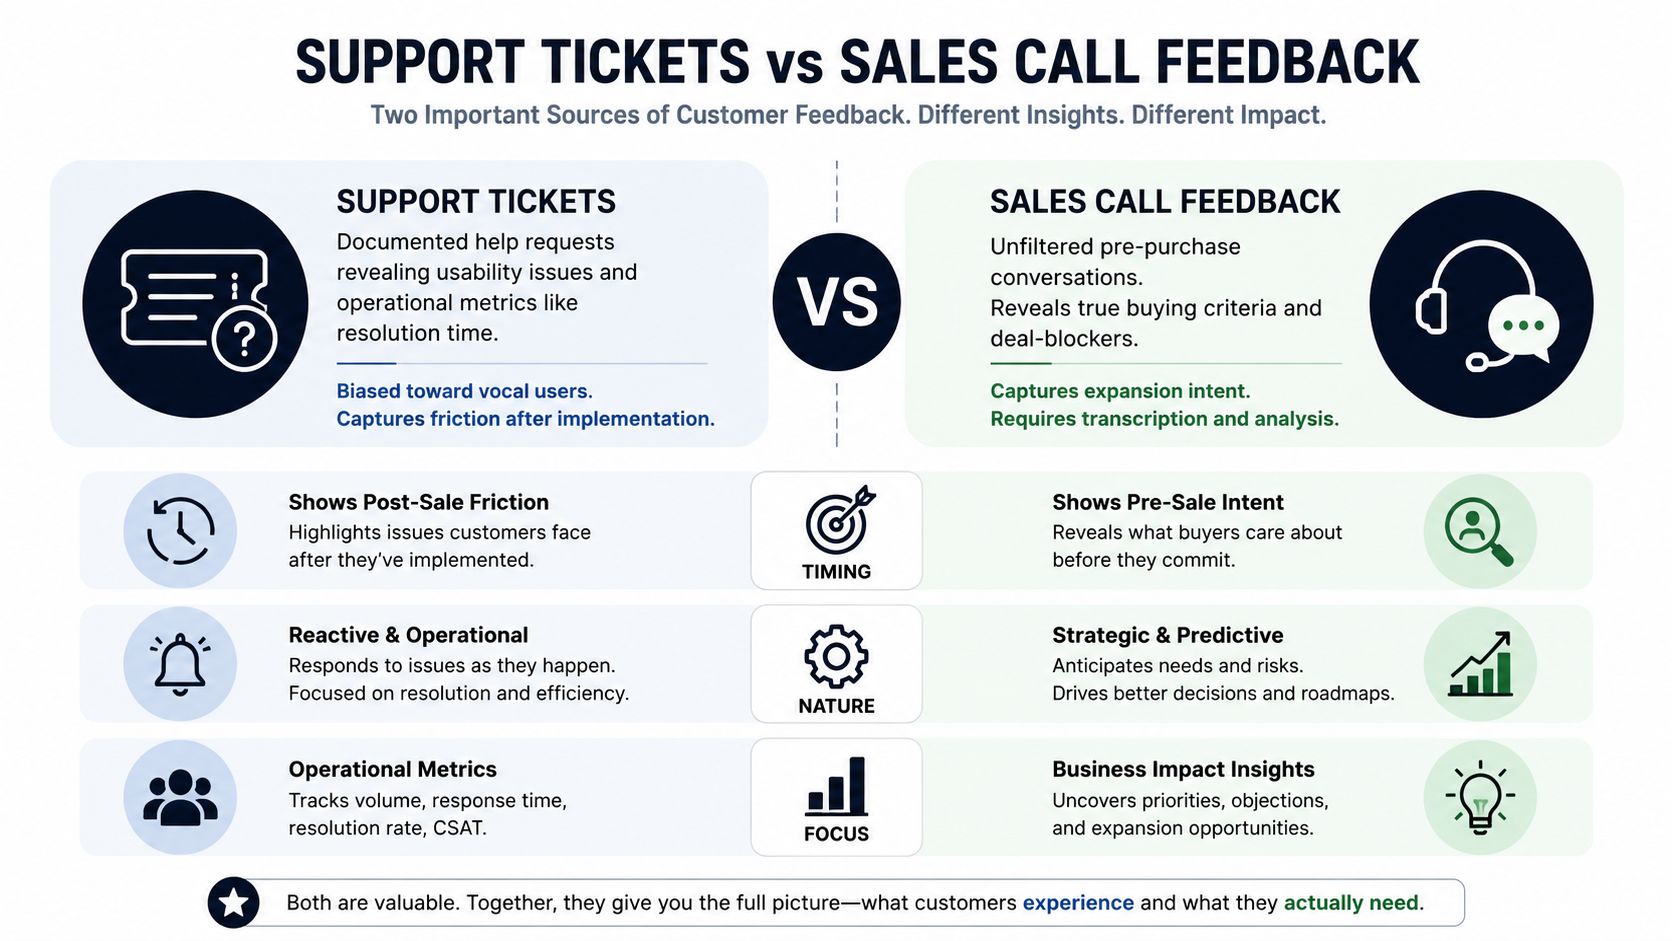
Support tickets are among the most operationally visible forms of feedback. Customers use them to ask for help, report confusion, request clarification, or document a failure. Each ticket contains more than a question. It can reveal a usability problem, an onboarding gap, weak documentation, implementation complexity, or a mismatch between the product's language and the customer's mental model.
The important distinction is between ticket count and support burden. A high volume of simple questions may indicate an easy documentation opportunity. A smaller set of complex cases may consume substantial specialist time and affect the accounts least able to tolerate friction. Tagging should capture issue theme, resolution type, customer effort, escalation level, repeat contact, feature involved, and account health.
Zendesk support analysis can reveal where documentation or workflows need attention, while Intercom conversation data can expose onboarding gaps. Freshdesk may surface repetitive requests that point toward self-service or product changes. Amplitude can help teams compare support-heavy feature usage with broader adoption behavior. These are scenarios for interpretation, not guaranteed outcomes.
Turn tickets into product evidence
Support leaders should avoid treating every ticket as a service-performance issue. If customers repeatedly ask how to complete the same task, the problem may sit in interface design, onboarding, or documentation. If tickets spike after a release, product and support need a shared investigation rather than separate explanations.
A useful routing model looks like this:
- Documentation gap: Send recurring how-to questions to enablement or knowledge management.
- Usability friction: Route repeated confusion to product design and research.
- Implementation complexity: Assign customer success or solutions engineering.
- Defect pattern: Escalate reproducible failures to engineering.
- Account risk: Notify the account owner when support burden rises alongside declining usage or renewal concerns.
SigOS can connect ticket themes with account health, revenue context, and behavioral changes. That makes it possible to distinguish a busy help desk from a deteriorating customer relationship. The most valuable support category isn't necessarily the one with the most tickets. It's the one that explains why customers can't reach or sustain value.

4. Sales Call Feedback and Deal Intelligence
Sales conversations often reveal objections before they become support tickets or churn reasons. Discovery calls, demos, procurement discussions, and expansion conversations contain customer language about pain, buying criteria, integrations, security, implementation, pricing, and competitive alternatives. Those signals can expose a market constraint while the prospect is still deciding whether to buy.
Sales feedback needs careful interpretation because it mixes stated intent with negotiation behavior. A prospect may request a feature because it is truly essential, because a competitor includes it, or because the request is part of procurement negotiation. Tagging the surrounding context helps separate these possibilities.
Record the objection, customer segment, deal stage, use case, competitor mentioned, required capability, decision consequence, and eventual outcome. Then connect the conversation to later evidence. If an objection repeatedly appears in lost deals and later emerges as a support issue among new customers, the company may have a positioning or expectation-setting problem. If a request appears in expansion calls and active users already rely on adjacent workflows, it may deserve roadmap attention.
Connect the sales promise to the customer reality
Salesforce can use call patterns to understand enterprise integration concerns. HubSpot may identify recurring objections related to legacy systems. Slack, Zoom, and Atlassian represent useful scenarios for analyzing integrations, expansion drivers, and onboarding expectations. These examples show how teams can frame the analysis, but they don't establish measured outcomes.
A practical review should ask:
- Is it a deal blocker: Would the customer stop evaluation without a change?
- Is it segment-specific: Does the objection come from enterprise, mid-market, or a particular use case?
- Does behavior confirm it: Do comparable customers show the same adoption or support friction?
- Is the promise realistic: Did sales describe a capability that product delivery can't consistently provide?
- Who owns the response: Product leadership, sales leadership, solutions engineering, or enablement?
SigOS can analyze sales call transcripts alongside account and product signals, helping teams compare what buyers say with what customers later do. That comparison turns sales intelligence into product intelligence.
5. Customer Usage Data and Behavioral Metrics
Usage data is feedback expressed through action. It records which features customers use, how often they return, how quickly they reach activation milestones, where adoption stalls, and which workflows they abandon. Customers can describe a feature as essential, but their behavior shows whether it has become part of their operating process.
Behavioral signals aren't automatically more truthful than verbal feedback. They answer different questions. A usage decline may indicate dissatisfaction, seasonal work, staffing changes, implementation disruption, or a change in business priorities. The interpretation becomes stronger when usage movement aligns with tickets, survey comments, sales conversations, or churn activity.
A useful usage taxonomy includes activation, adoption, depth, breadth, recency, frequency, feature abandonment, and plateau. Teams should connect each behavioral category to an account segment and lifecycle stage rather than treating product analytics as an account-free stream of events.
Look for divergence between words and actions
Slack may observe different retention patterns among teams using multiple channels. Dropbox can examine cross-device file activity. GitHub can compare issue and pull request behavior. Amplitude can investigate whether particular feature usage aligns with churn risk. These are analytical scenarios, not verified performance claims.
SigOS can help correlate usage patterns with churn and expansion outcomes. Product teams can use that analysis to identify an activation milestone, investigate underperforming cohorts, and alert customer success when an account's usage plateaus after an important product event. The resulting action might be a training intervention, an onboarding change, a product fix, or a conversation about changing customer needs.
Behavioral evidence is strongest when it explains a customer decision, not when it merely produces another dashboard.
Compare usage with stated feedback. If customers praise a feature but rarely use it, investigate whether the praise reflects aspiration rather than realized value. If customers don't mention a workflow but use it consistently, that behavior may reveal a retention driver they wouldn't think to name in a survey.
For teams designing a usage-monitoring practice, this guide to tracking app usage provides a relevant starting point.
6. Surveys, NPS and Public Review Platforms
Surveys and reviews combine intentional feedback with public opinion. Surveys ask customers to evaluate an experience or relationship. Reviews capture volunteered commentary that can influence prospects and expose issues customers may not report directly. Together, they provide language, sentiment, and comparative context, but neither source should be read without customer and behavioral context.
NPS-style programs group respondents into promoters, passives, and detractors. On the standard scale, scores of 9 to 10 indicate promoters, 7 to 8 indicate passives, and 0 to 6 indicate detractors, as described by SurveyMonkey's NPS benchmark guidance. The same source reports benchmark data from more than 150,000 organizations, including an average NPS of 32 and a top-quartile threshold of 72 or higher. These figures are benchmarks, not explanations. A score tells teams where to investigate, while the accompanying comment and account behavior help explain why.
Survey response rates also limit what survey-only analysis can represent. A customer feedback statistics guide places typical online survey response rates between 10% and 30%, which is why teams often combine surveys with tickets, reviews, social mentions, and behavioral data.
Treat public sentiment as a lead
SigOS can correlate NPS comments and review themes with support history, usage, account segment, and product events. That makes a detractor response more actionable when the account also shows feature abandonment or a recent unresolved issue. It also prevents teams from overreacting to a public comment that doesn't represent a recurring or commercially important pattern.
Use review monitoring to:
- Extract specific themes: Separate pricing, onboarding, reliability, support, usability, and missing capabilities.
- Segment sentiment: Compare cohorts, plans, regions, use cases, and lifecycle stages.
- Test internal assumptions: Check whether public complaints match support and usage evidence.
- Close the loop: Respond appropriately and tell affected customers when a concrete change addresses their concern.
For service teams, a CES guide for support teams can help connect effort-related feedback with support operations.
7. Churn Analysis and Exit Feedback
Churn feedback arrives when a customer cancels, downgrades, or reduces an account. Exit surveys and interviews explain the stated reason. Churn analysis adds the preceding evidence, including usage decline, support escalation, feature abandonment, missed onboarding milestones, pricing conversations, and failed expansion attempts.
This category deserves a different analytical standard because hindsight can distort the story. Customers may cite price when the deeper issue was weak adoption. They may mention a missing feature when a support failure eroded trust first. The most useful analysis compares the exit narrative with the customer's behavior and account history.
Tag each churn event by stated reason, underlying theme, preceding warning signs, time from first warning to cancellation, competitor involvement, unmet expectation, and intervention opportunity. Then compare churned accounts with retained accounts that share similar plans, use cases, and lifecycle stages. The objective isn't to produce a perfect prediction. It's to identify repeatable failure modes early enough for a human owner to act.
Separate the last reason from the first cause
SigOS can help connect cancellation feedback to usage movement, support spikes, and feature abandonment. A customer success leader can then ask whether the account would have expanded if the earlier friction had been resolved. Lost expansion matters because it shows where growth stopped, even when the account hasn't technically churned.
Useful questions include:
- What changed first: Did usage fall before support volume rose, or did a service failure precede both?
- Was the expectation set correctly: Did sales, onboarding, and product communicate the same capability?
- Was the problem recoverable: Could training, enablement, or a product fix have changed the outcome?
- Was intervention timely: How much time separated the first warning from the cancellation decision?
- Is the pattern concentrated: Does the failure mode appear in a particular segment or use case?
A structured client churn analysis approach can help teams move beyond a cancellation reason field and examine the sequence that produced the outcome. The relevant sales-intelligence perspective is also covered in this GTM guide to sales intelligence.
8. Competitive Intelligence and Win/Loss Analysis
Competitive feedback explains how customers evaluate alternatives and why they choose, delay, or reject a product. It includes competitor mentions in sales calls, procurement criteria, replacement decisions, pricing comparisons, perceived strengths, and gaps that make a deal difficult. Win/loss analysis turns these observations into a view of market positioning.
The key mistake is to treat every competitor mention as a feature gap. Buyers may select one product for user experience, implementation confidence, integration depth, flexibility, price, compliance, or internal familiarity. A competitor may win without offering more capabilities because the buyer understands its value more clearly.
Create a consistent win/loss record with competitor, segment, use case, evaluation criterion, perceived advantage, missing requirement, decision stage, deal outcome, and confidence in the source. Then distinguish must-have requirements from differentiators. A missing requirement blocks consideration. A differentiator improves preference among products that already meet the baseline.
Compare perception with product reality
Slack can analyze whether buyers compare it with Teams primarily on experience or capability. Figma can examine multiplayer collaboration as a differentiation theme. Stripe can investigate developer experience in payment evaluations. Notion can study whether buyers value flexibility over specialized tools. These scenarios demonstrate the questions a win/loss program can answer, without claiming a measured result.
SigOS can analyze sales transcripts for competitive language and connect those themes with account segment, deal outcome, and later product behavior. That connection helps product leaders avoid building a feature solely because a competitor advertises it. The stronger case exists when a competitive objection also appears in lost deals, support friction, usage barriers, or expansion conversations.
Review competitive findings at a consistent cadence with product and sales leadership. Route positioning gaps to enablement, genuine capability gaps to roadmap review, and inaccurate expectations to marketing and sales operations. The output should be a decision about what to build, explain, package, or stop pursuing.
8-Point Customer Feedback Comparison
| Item | Implementation Complexity 🔄 | Resource Requirements ⚡ | Expected Outcomes 📊 | Ideal Use Cases 💡 | Key Advantages ⭐ |
|---|---|---|---|---|---|
| Product Bug Reports and Technical Issues | Medium–High: technical diagnosis, repro steps required 🔄 | High: engineering time, incident/monitoring tools ⚡ | Reduced outages, lower churn, improved reliability 📊 | Urgent failures, high-ARR customer-impacting defects 💡 | Actionable fixes with clear ROI and reliability gains ⭐⭐⭐ |
| Feature Requests and Enhancement Suggestions | Low–Medium: design validation and scoping 🔄 | Medium: product research, prototyping, prioritization ⚡ | New capabilities, expansion revenue, improved PMF 📊 | Roadmap prioritization, expansion from high-value accounts 💡 | Reveals market demand and enables targeted upsells ⭐⭐⭐ |
| Customer Support Tickets and Help Desk Inquiries | Low: operational triage; analysis can be deeper 🔄 | Medium: support agents, ticketing systems, QA ⚡ | Operational efficiencies, better docs/onboarding, lower support cost 📊 | Onboarding, usability fixes, recurring friction points 💡 | Quantifiable metrics for support efficiency and quick wins ⭐⭐ |
| Sales Call Feedback and Deal Intelligence | Medium: transcription + qualitative analysis 🔄 | Medium: call recording, IA tools, analyst time ⚡ | Improved messaging, fewer deal-blockers, higher win rates 📊 | GTM refinement, objection handling, expansion plays 💡 | Early buyer intent and competitive signals to inform GTM ⭐⭐⭐ |
| Customer Usage Data and Behavioral Metrics | High: instrumentation, analytics, cohort analysis 🔄 | High: analytics platform, data engineering, privacy controls ⚡ | Predictive churn/expansion models, objective product signals 📊 | Retention modeling, feature adoption optimization, personalization 💡 | Most predictive source of retention/expansion outcomes ⭐⭐⭐⭐ |
| Surveys, NPS and Public Review Platforms | Low–Medium: survey design and sentiment analysis 🔄 | Low: survey tools, review monitoring, follow-up resources ⚡ | Sentiment trends, benchmarking, reputational signals 📊 | Satisfaction tracking, competitive reputation, executive KPIs 💡 | Standardized benchmarking and public credibility signals ⭐⭐ |
| Churn Analysis and Exit Feedback | Medium–High: correlation of events and narrative analysis 🔄 | Medium: exit surveys, interviews, historical data analysis ⚡ | Root-cause identification, targeted interventions to reduce churn 📊 | Post-cancellation analysis, product-market fit diagnostics 💡 | Candid insights into failures and prevention opportunities ⭐⭐⭐ |
| Competitive Intelligence and Win/Loss Analysis | Medium: structured deal capture and synthesis 🔄 | Medium: sales enablement, analysis tools, confidentiality handling ⚡ | Clear positioning, prioritized roadmap gaps, pricing insights 📊 | GTM strategy, pricing, competitive feature prioritization 💡 | Reveals perceived differentiation and competitor-driven gaps ⭐⭐⭐ |
Turn Categories Into a Feedback Operating System
A taxonomy becomes useful when it changes what people do. Start with a controlled hierarchy rather than an unlimited tag list. The MIT Sloan voice-of-the-customer framework describes VOC through customer needs, hierarchy, priorities, and perceived performance. That structure is more useful than a flat count because it connects themes to importance and measurable gaps.
A practical starting point is 4 to 6 top-level categories, followed by more specific labels such as feature requests, bugs, usability problems, onboarding and activation, pricing and packaging, and support issues, as outlined in this customer feedback categorization guidance. Test the taxonomy on an initial batch of 50 to 100 feedback items before automating it. If two reviewers classify the same item differently, the label definition needs work.
Use the following operating sequence:
- Define the taxonomy: Establish source, top-level theme, subtheme, lifecycle stage, severity, and owner fields. Keep the hierarchy compact. Recent guidance recommends roughly 30 to 50 themes for practical categorization, while warning that excessive granularity can make action harder, as discussed in customer feedback categorization research.
- Capture account context: Add plan, customer segment, account value, renewal timing, usage state, churn risk, expansion potential, and deal status.
- Tag the evidence: Distinguish direct feedback, indirect feedback, and inferred behavioral signals. A guide to customer feedback types explains why direct sentiment, volunteered pain points, and usage behavior should not be treated as interchangeable.
- Validate the pattern: Look for agreement across sources. A feature request supported by sales objections, usage friction, and churn feedback is stronger than a repeated request with no behavioral consequence.
- Score exposure: Assess severity, affected workflow, frequency, account importance, churn risk, expansion potential, and confidence in the classification.
- Assign an owner: Route bugs to engineering, recurring support friction to product and enablement, feature demand to roadmap review, sales objections to product and sales leadership, and churn patterns to customer success.
- Review on a cadence: Examine new themes, rising severity, unresolved clusters, adoption changes, and commercial exposure consistently. Don't wait for an annual customer feedback review to discover a pattern that has been visible for months.
SigOS is one relevant option for this workflow. It can ingest support tickets, chat transcripts, sales calls, usage metrics, and other feedback sources, then connect issue themes with revenue-impact signals. Its integrations with Zendesk, Intercom, Linear, Jira, and GitHub can support routing from insight to issue creation, while grouping feedback by customer type, plan, or custom tags helps teams preserve account context. A scalable social feedback strategy can complement those operational sources by adding public conversation to the same evidence system.
The final discipline is to close the loop. Tell customers when a problem is fixed, explain when a request doesn't fit the roadmap, and give internal teams a clear record of the evidence behind each decision. The best customer feedback categories don't produce more labels. They create a shared operating language for deciding what deserves attention, who should act, and how the business will know whether the intervention worked.
SigOS connects support tickets, chat transcripts, sales calls, usage metrics, and account context so teams can prioritize customer feedback by churn exposure, expansion potential, and revenue impact. Visit SigOS to see how your team can turn these customer feedback categories into routed workflows and clearer product decisions.
Keep Reading
More insights from our blog


Ready to find your hidden revenue leaks?
Start analyzing your customer feedback and discover insights that drive revenue.
Start Free Trial →