Customer Feedback Dashboard for SaaS
Build a revenue-driven customer feedback dashboard for SaaS. Learn must-have metrics, data integrations, and AI prioritization to turn noise into action.
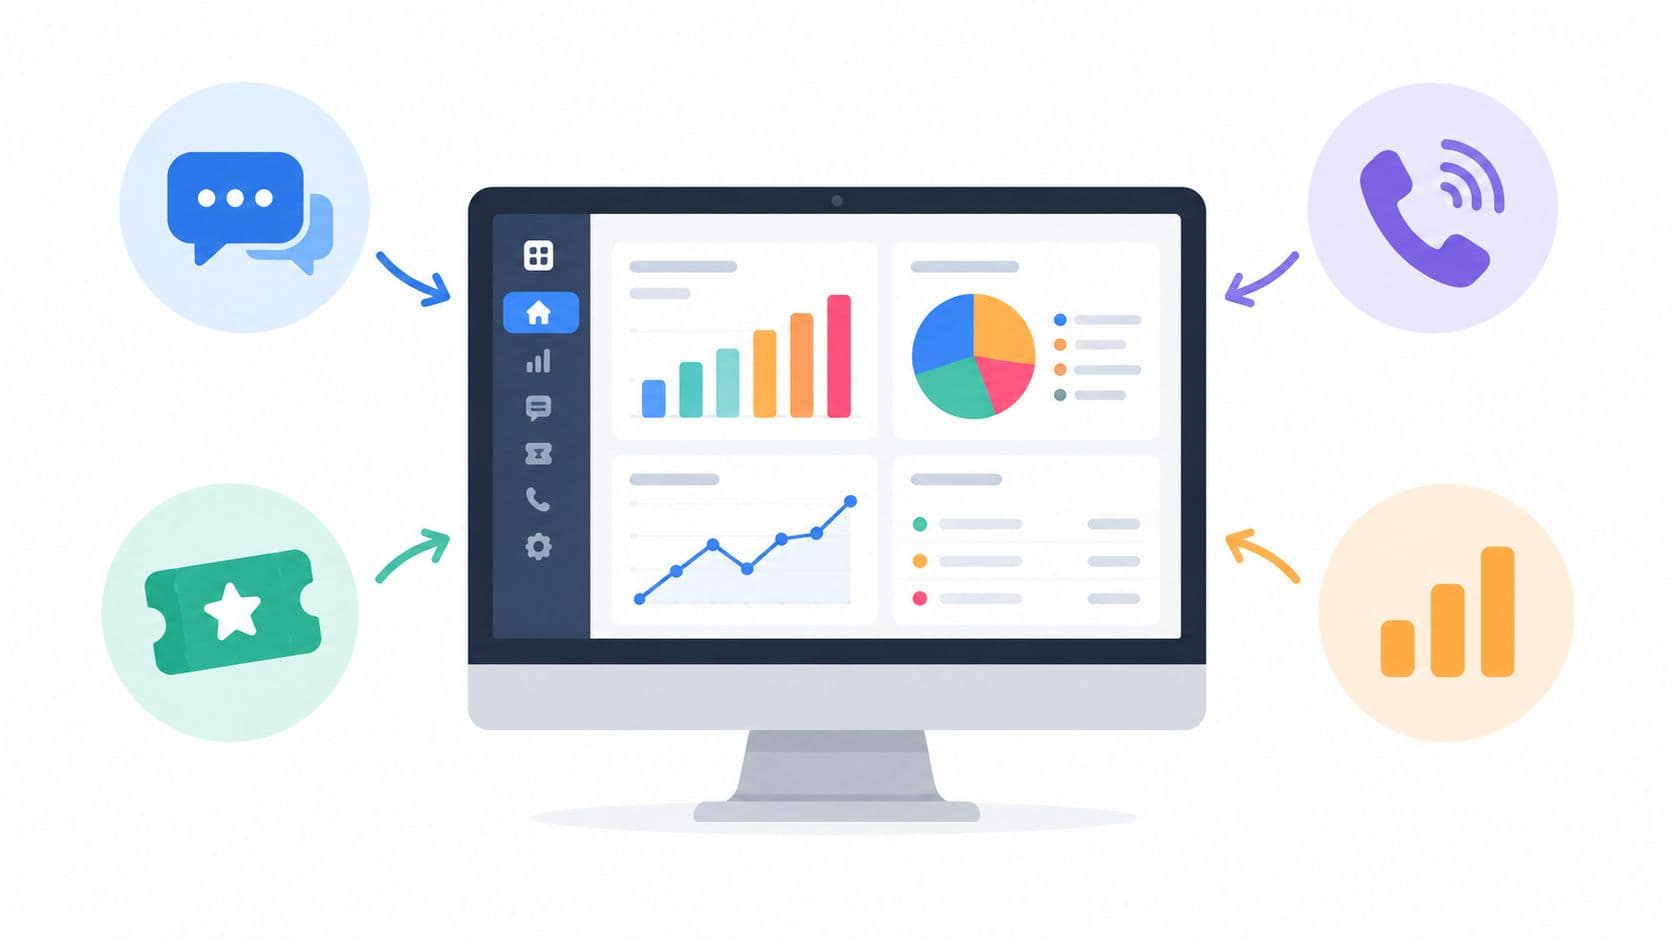
Most advice about a customer feedback dashboard starts in the wrong place. It tells SaaS teams to collect more responses, display NPS and CSAT, and add another trend chart. That produces a cleaner rearview mirror, not necessarily a better product or a stronger retention motion.
A useful dashboard answers a harder question: which customer problems threaten revenue, and what should someone do next? That means connecting feedback with ARR, lifecycle stage, product usage, churn signals, expansion opportunities, and operational ownership. Scores still matter, but they're inputs to a decision system rather than the decision itself.
The shift also changes how teams evaluate tooling. A survey-only dashboard can summarize what customers said. An AI-driven product intelligence layer can connect what customers said with what they bought, how they use the product, and whether the business is responding. That distinction is where feedback programs either create commercial value or become another reporting obligation.
Moving Beyond Vanity Metrics in Feedback Tracking
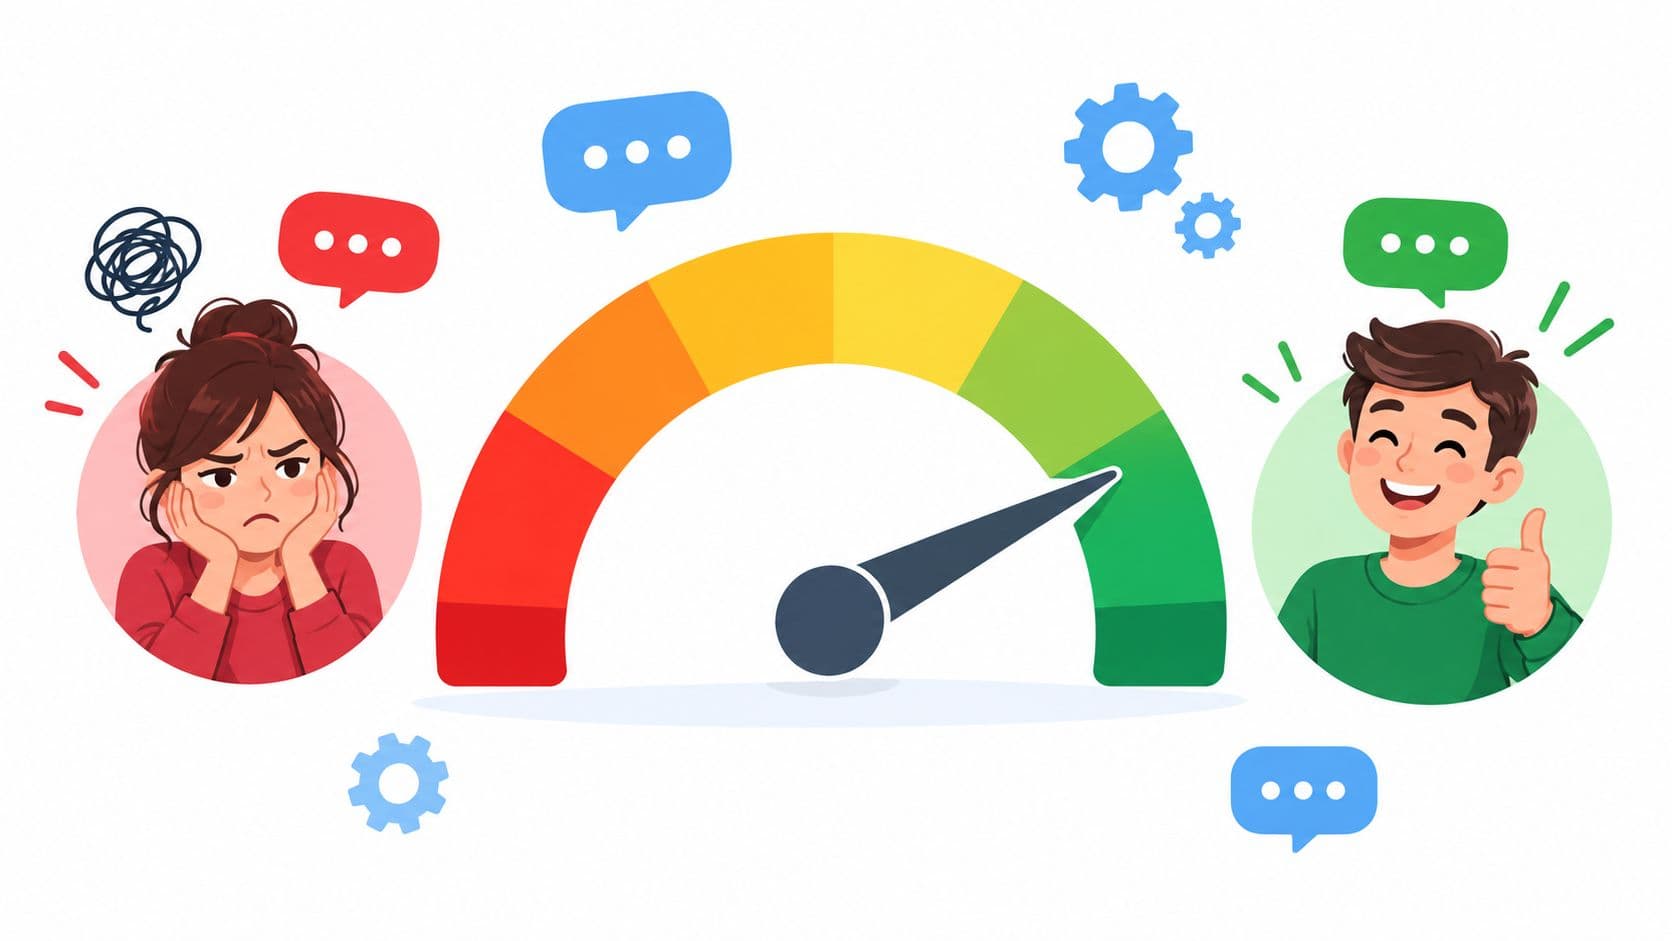
NPS and CSAT are popular because they're easy to explain. A leadership team can understand a score, a trend line, and a comparison with the previous reporting period. The problem starts when teams treat those measures as a product roadmap. A lower score signals friction, but it rarely identifies the account value at risk, the workflow causing the problem, or the fix most likely to protect renewal.
The historical role of NPS is important. In 2003, Frederick F. Reichheld published the Harvard Business Review article “The One Number You Need to Grow,” helping establish NPS as a leading loyalty and growth metric through feedback channels, as documented in this history of customer experience analytics. Earlier discussions of customer feedback systems, including work associated with Gartner analyst Esteban Kolsky in 2001, helped lead toward the enterprise feedback management category. The original contribution was to make feedback more operational, not to make one score sufficient for every product decision.
Practical rule: Treat NPS or CSAT as a symptom indicator. Pair it with account value, behavior, theme, and ownership before turning it into a priority.
A score needs commercial context
A ten-point decline among trial users may require a different response from a cluster of negative comments among strategic accounts approaching renewal. Averaging the two populations can create a misleading sense of urgency in one area and hide material risk in another.
A revenue-driven dashboard therefore joins feedback to the customer record. For each theme, product leaders should be able to ask:
- Which ARR tier is reporting the issue?
- Which lifecycle stage is affected?
- Which product area generates the friction?
- Is usage declining after the issue appears?
- Is the account renewing, expanding, or already at risk?
- Who owns the next action?
This is also why feedback analytics should sit alongside broader operational measurement. Teams reviewing enterprise QA transformation metrics can apply the same discipline to feedback operations, separating activity from outcomes such as resolution quality, responsiveness, and repeat failure.
From collection to product intelligence
A static survey tool records declared sentiment at selected moments. A product intelligence system combines declared feedback with observed behavior and commercial context. That broader view supports a more useful analysis of how to measure customer engagement, particularly when engagement means more than survey participation.
The dashboard becomes valuable when it changes a decision. A product manager pauses a low-value request because a recurring issue affects few strategic accounts. A customer success leader escalates a workflow defect because high-ARR customers are encountering it during onboarding. A growth team identifies an expansion blocker that customers mention in calls but never report through a survey.
That's the standard to use. If the dashboard can't connect a theme to a business consequence and a responsible person, it's still a reporting surface.
Must-Have Metrics and Revenue Segmentation
A dashboard can show excellent NPS while renewal-stage accounts accumulate unresolved defects. That is why the first view should connect feedback quality with commercial exposure, rather than treating satisfaction as the final objective. Keep a focused group of headline measures above the fold and make the underlying responses easy to inspect. CustomerEcho's customer feedback analytics dashboard guide recommends prioritizing three to five headline metrics, including overall satisfaction, response volume, negative feedback percentage, and unresolved issues.
Each metric covers a different operating question. Satisfaction indicates perceived experience quality. Response volume shows whether collection is working. Negative feedback percentage signals pressure in the customer experience. Unresolved issues show whether the organization converts feedback into action.
The first view should expose risk
A practical top row might include:
- Overall satisfaction: Use it as a directional signal, then examine the accounts, themes, and lifecycle stages behind the score.
- Response volume: Investigate sudden drops for broken surveys, integrations, triggers, or channels before interpreting the result.
- Negative feedback percentage: Pair the rate with themes and customer segments so the dashboard explains what changed.
- Unresolved issues: Measure responsiveness and aging, not only the number of complaints received.
- Revenue exposure: Show the ARR associated with affected accounts or themes when the data model supports it.
Revenue exposure connects feedback operations with prioritization. It does not require assigning a precise financial value to every comment. It makes enough commercial context visible to distinguish a minor inconvenience from a renewal risk or an expansion blocker.
Segment before interpreting
The same NPS or CSAT movement can represent different problems depending on who responded. Enterpret's guidance on voice-of-customer dashboards highlights the risk of reading an aggregate score without context such as ARR tier, lifecycle stage, or product area.
Build filters for:
- ARR tier: Separate strategic, mid-market, and lower-value accounts according to your commercial model.
- Lifecycle stage: Compare onboarding, adoption, renewal, expansion, and recently churned customers.
- Product area: Connect themes to the feature, workflow, integration, or service surface involved.
- Account status: Distinguish healthy, at-risk, renewing, and expanding customers.
- Channel: Compare surveys, support tickets, reviews, chat, and sales conversations without assuming they represent the same population.
Use historical baselines from your own business instead of static industry averages. A score can look acceptable externally while still showing a meaningful regression for your customers. Relative thresholds become more useful when they reflect normal performance by segment, channel, and lifecycle stage.
| Metric Type | Vanity Example | Revenue-Impact Example |
|---|---|---|
| Satisfaction | Overall CSAT trend | CSAT among high-ARR accounts during renewal |
| Feedback volume | Total responses | Response volume by channel and lifecycle stage |
| Sentiment | Percentage of negative comments | Negative themes linked to declining usage or renewal risk |
| Feature demand | Most-requested feature | Requests associated with expansion conversations |
| Issue backlog | Number of open feedback items | Unresolved issues ranked by affected ARR and severity |
A dashboard becomes decision-grade when every metric supports a defined action. If negative feedback rises among new users, improve onboarding. If an integration problem appears in renewal-stage accounts, route it to the product owner with account context. If a request recurs across expansion conversations, validate the commercial opportunity before adding it to the roadmap.
Unifying Data Sources and AI Classification
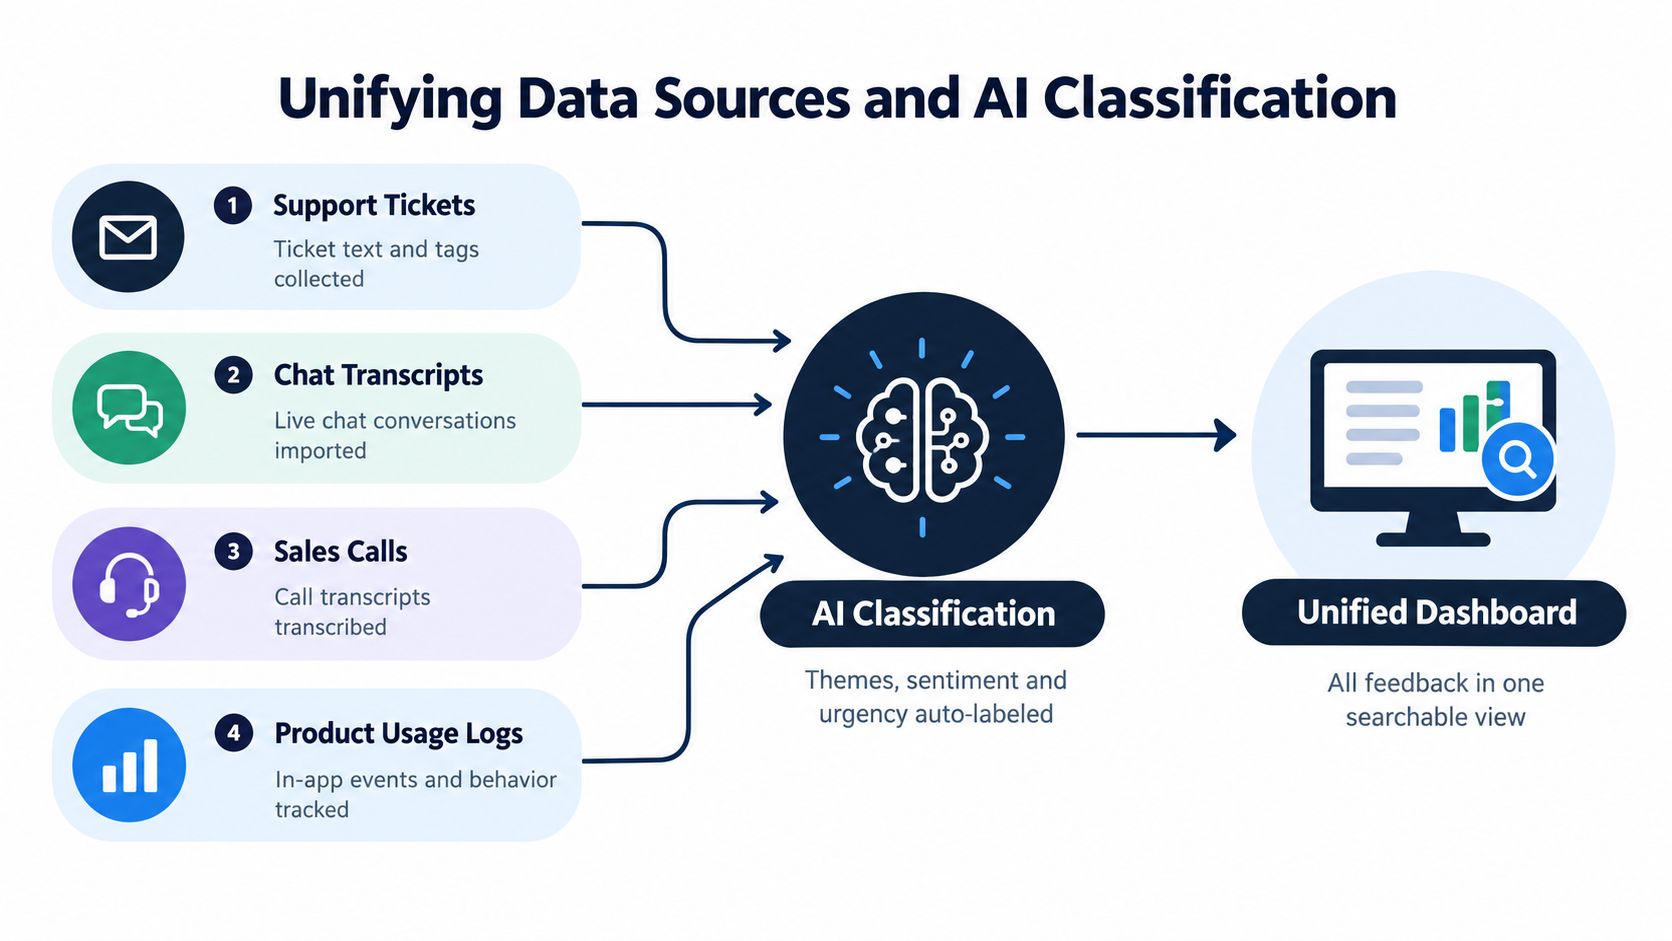
Customer feedback rarely lives in one system. Surveys capture explicit opinions, support tickets contain troubleshooting detail, sales calls reveal buying objections, and product usage logs show whether customers behave as if the product is delivering value. A dashboard built from only one source will often describe the loudest channel rather than the full customer experience.
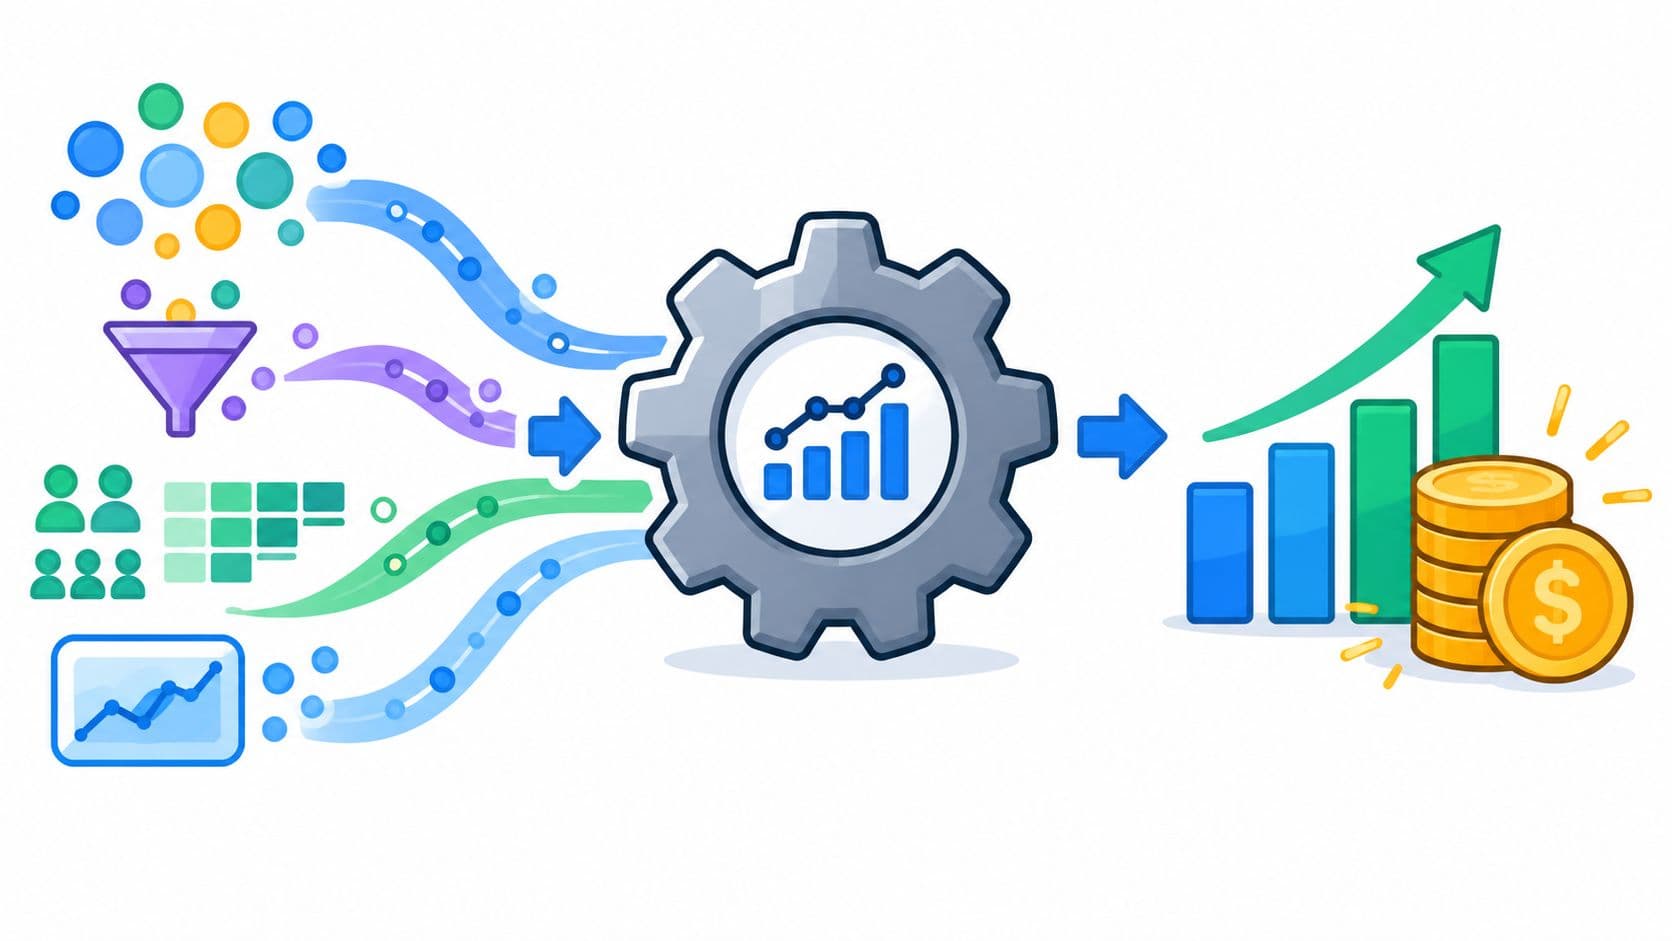
The technical answer is a unified ingestion pipeline. Connect each source, preserve the original text and metadata, normalize account and product identifiers, then classify the content into a shared taxonomy. The goal isn't to erase source differences. It's to make them queryable together.
Build the pipeline around traceability
Start with stable identity resolution. A support ticket, sales opportunity, survey response, and usage record should map to the same account where permission and data quality allow it. Without that connection, the dashboard can identify a theme but can't show whether it affects a renewal, an active opportunity, or a low-engagement account.
Then normalize the fields that analysts and models will use:
- Account metadata: ARR tier, segment, region, plan, owner, and lifecycle stage.
- Conversation metadata: Channel, timestamp, participant role, ticket status, and related product area.
- Behavioral metadata: Relevant in-app events, usage changes, feature adoption, and workflow completion.
- Commercial metadata: Renewal timing, opportunity stage, expansion status, and churn reason.
Teams planning this architecture should also review practical principles for multi-source data integration, especially around consistent identifiers, refresh behavior, and failure handling.
Use AI to classify, not to replace judgment
Open-text feedback needs more than keyword matching. AI and NLP can classify sentiment, themes, urgency, product areas, and intent across surveys, reviews, support transcripts, and other unstructured inputs. Technical guidance on feedback analytics software emphasizes combining real-time ingestion, AI or NLP classification, and drill-down from aggregate trends into raw responses for fast root-cause analysis.
The drill-down matters. A model may label a cluster “reporting difficulty,” but a product manager needs to inspect representative responses and determine whether the issue concerns configuration, missing functionality, confusing terminology, or poor documentation. Keep the raw response attached to every classification, along with confidence indicators and a way to correct taxonomy errors.
Continuous processing also changes the operating rhythm. Instead of waiting for a monthly survey review, teams can detect an emerging theme while the context remains current. But automation should surface evidence and prioritize investigation, not create a product decision on its own without human review.
Closing the Action Gap with Automated Workflows
A feedback dashboard earns its place in the operating process only when an insight reaches the person who can act on it. Otherwise, teams collect complaints, discuss them, and leave resolution ownership unclear. Industry coverage of the voice-of-customer action gap describes how voice-of-customer systems often stop at reporting instead of routing issues, assigning owners, and measuring resolution.
Set the workflow before adding more charts. Every high-priority insight should leave the dashboard with a destination, an accountable owner, supporting evidence, and a status that can be reviewed later.
Route by issue type and commercial exposure
Routing should reflect both the problem and its business context. A product defect may create a Jira or Linear issue. A service failure may belong in Zendesk. A renewal risk should alert the customer success owner and appear in the account plan. A feature request connected to an active opportunity should reach the product manager and revenue team together.
Useful rules combine several signals:
- Theme: Which problem or request recurs across responses?
- Severity: How seriously does it disrupt the customer's workflow?
- Account value: Which ARR tier is affected?
- Lifecycle timing: Is a renewal or expansion decision approaching?
- Evidence strength: Does the pattern appear across channels or in one comment?
- Existing ownership: Which team controls the relevant action?
Do not create a ticket for every negative comment. That floods engineering with low-value work and trains stakeholders to disregard automated alerts. Route clusters, material account risks, and confirmed defects. Keep lower-confidence observations available for analysis until more evidence appears.
Revenue segmentation makes these rules more useful. A recurring issue among high-ARR accounts nearing renewal may deserve immediate investigation, even if fewer customers mention it than a minor usability complaint. Lifecycle stage adds urgency that a satisfaction score alone cannot show.
Measure completion, not activity
The dashboard should show whether an insight moved through the operating process. Record the assigned owner, creation date, status, resolution time, linked accounts, and customer-facing follow-up. For product work, connect the feedback item to the issue or release that addressed it. For customer success work, record whether the account recovered, renewed, expanded, or remained at risk.
A morning briefing helps when it surfaces decisions that need attention rather than repeating every new comment. Automated report generation can keep stakeholders informed on a weekly or monthly cadence, as described in AskNicely's customer feedback report guidance. The report should summarize active work and unresolved decisions, not replace ownership.
Operational test: Every alert should answer three questions: who acts, what evidence supports the action, and when will the team know whether it worked?
A workflow is complete only when the outcome returns to the feedback system. Close the loop with the linked account, product area, and original theme so future prioritization reflects what changed. This turns feedback from a record of dissatisfaction into an operating input tied to retention, expansion, and product investment.
Dashboard Templates for Product and Growth Teams
A single feedback dashboard can create a false sense of alignment. Product, customer success, sales, and growth teams may share the same source data, yet each needs different decisions. Product managers need evidence for sequencing. Customer success needs account risk and follow-up. Growth and revenue teams need buying objections, expansion signals, and friction across adoption.
Use one shared data model, then give each role a focused working view. Shared definitions preserve consistency. Role-specific filters keep commercial signals from disappearing inside an average satisfaction score.
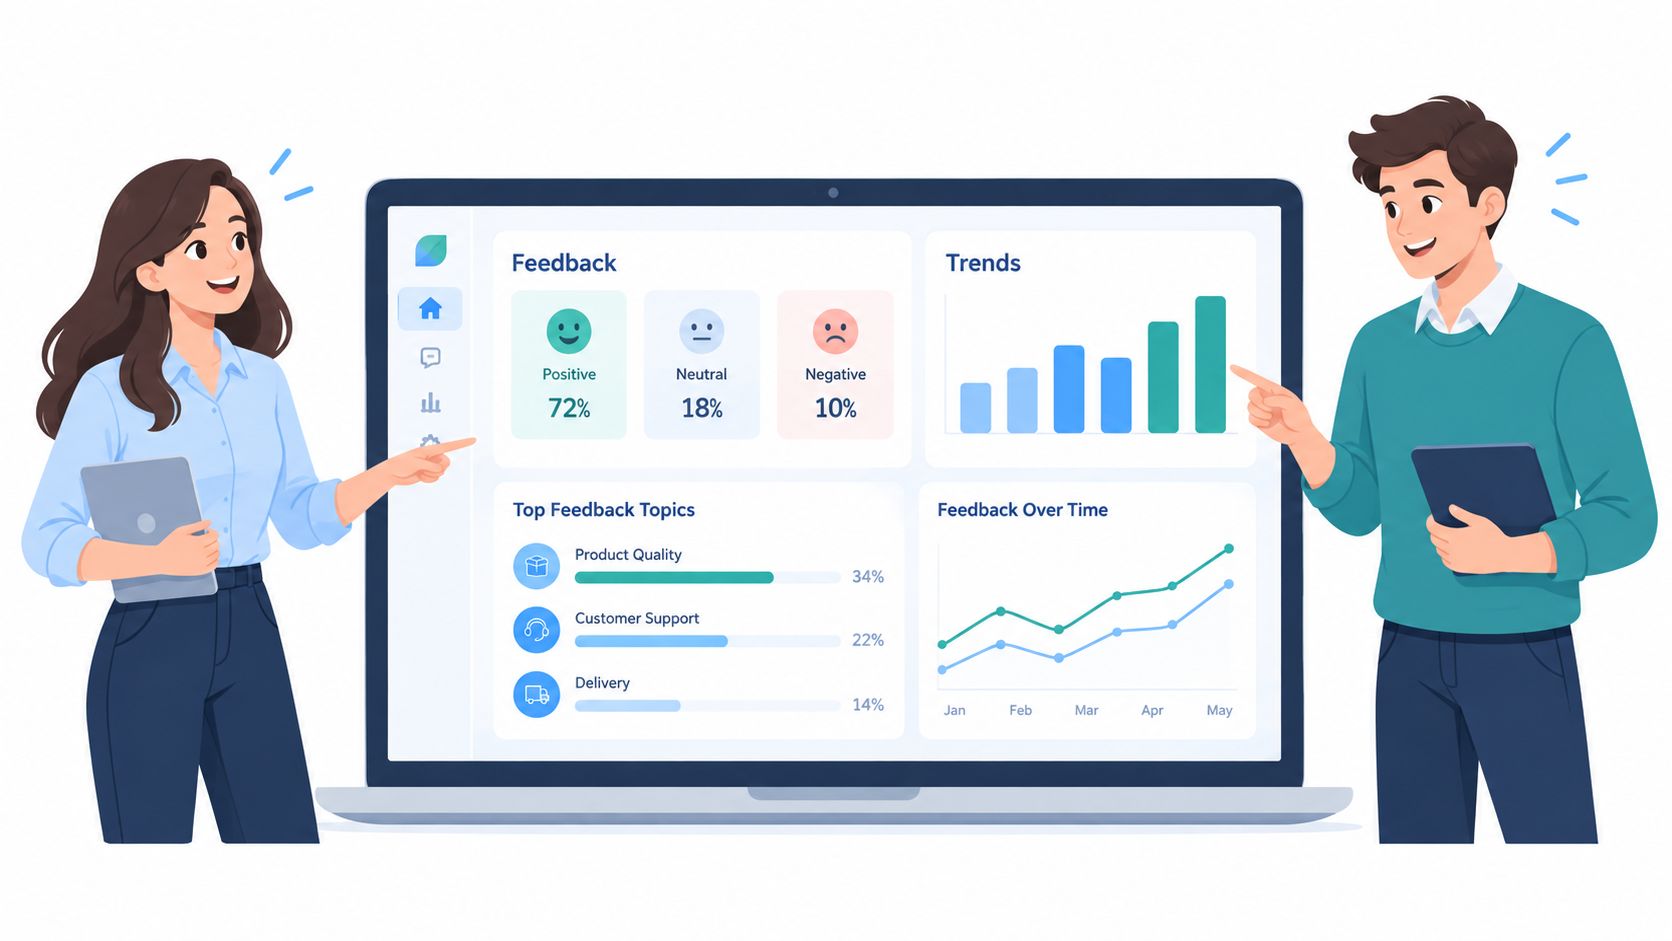
Product prioritization view
Rank themes by business impact, not comment volume. Each theme should show the affected product area, representative evidence, account count, ARR exposure, lifecycle distribution, relationship to usage, and current status. Segmenting by ARR and lifecycle stage helps teams separate broad low-value noise from a smaller issue that could block expansion or put a renewal at risk.
A practical product view can include:
- Top revenue-exposed problems: Issues ranked by affected account value and urgency.
- Feature demand clusters: Requests grouped by job to be done rather than slightly different wording.
- Adoption context: Usage patterns associated with each theme.
- Evidence panel: Relevant support, sales, survey, and review excerpts.
- Decision state: Investigate, validate, planned, in progress, released, or rejected.
This structure beats a “most requested features” chart because popularity does not establish commercial value. Many low-value votes can outweigh a smaller cluster in a basic count, while the smaller cluster may be blocking a strategic expansion.
Customer success and growth views
Start the success view with accounts that need attention. Useful filters include renewal stage, unresolved negative feedback, declining engagement, repeated support friction, and open product requests. Owners should be able to open the supporting conversation without leaving the dashboard.
The growth view should group buying objections and expansion opportunities by segment, ARR, and lifecycle stage. Sales teams can distinguish isolated objections from recurring product gaps. Product leaders can then see whether a request supports an active commercial motion or reflects speculative interest.
A daily briefing that surfaces only prioritized issues and supporting evidence replaces manual spreadsheet compilation. It keeps urgent signals visible between scheduled reviews, while scheduled reports can provide a broader record for stakeholder planning. The briefing should point to a decision, owner, and account context rather than reproduce every new comment.
The video below offers another visual reference for presenting customer feedback and trend data to cross-functional stakeholders.
Security and Governance in AI Feedback Analysis
A customer feedback dashboard handles material that customers expect you to protect: support conversations, sales calls, account details, product behavior, and sometimes personal information. Its commercial value disappears if it creates a privacy incident or breaches a customer agreement.
Set security requirements before ingestion. Ask vendors where data is stored, how it moves between systems, who can access raw transcripts, how permissions map to customer roles, and whether customer data remains isolated from other tenants. Confirm whether models are trained or retrained on proprietary content. For sensitive SaaS environments, require clear answers in the contract, not only in sales documentation.
Build controls into the data flow
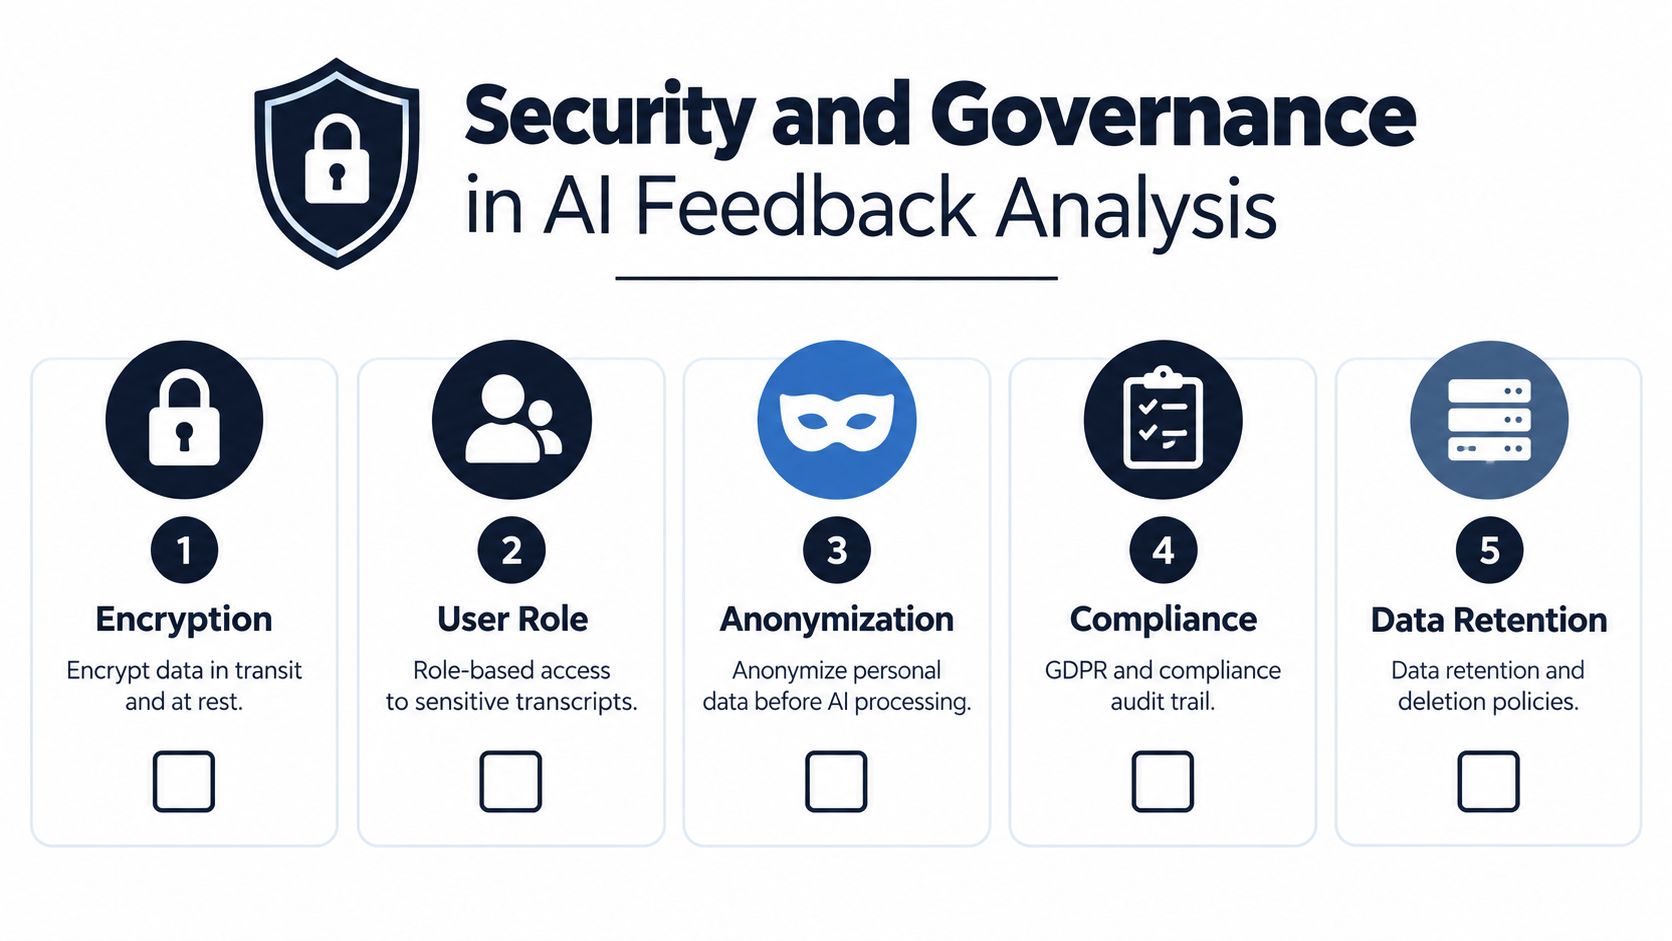
Security spans collection, transport, storage, model processing, access, and deletion. Treat each stage as a control point:
- Encrypt data in transit and at rest: Protect feedback as it moves through integrations and while it is stored.
- Apply role-based access: Give product, success, support, and leadership teams only the transcript access their work requires.
- Mask personal data: Remove or anonymize unnecessary personal information before AI processing.
- Maintain an audit trail: Record access, classification changes, exports, and administrative actions for compliance review.
- Define retention and deletion: Set rules for how long raw conversations, derived themes, and linked account data remain available.
A governance process also needs a correction path. If a customer requests deletion, the organization should be able to locate the original response, derived classification, cached copy, and downstream task. If a model misclassifies sensitive content, an authorized reviewer must be able to correct the label while preserving the source evidence.
Turn vendor promises into testable requirements
“Enterprise-grade security” is not sufficient documentation. Request details on encryption, access controls, tenant isolation, subprocessors, deletion behavior, incident response, and model data policies. Teams can use data governance best practices to turn those questions into a repeatable review process.
Access should match the decision being made. Aggregate themes may be enough for a roadmap meeting. An account owner may need the original conversation, while a support manager may need operational details but not sales compensation or unrelated personal data. This balance preserves feedback's usefulness without exposing every record to every team.
Measuring the ROI of Product Intelligence
A dashboard does not create ROI by displaying attractive charts. It earns continued investment when it protects revenue, supports expansion, reduces wasted product effort, or improves operating decisions with stronger evidence.
Start with a baseline. Define the feedback sources included, the accounts covered, the decisions influenced, and the actions created. Then connect each material action to a business outcome. Avoid claiming that every improvement came from one dashboard, especially when pricing, sales activity, support, and market conditions also affect results.
Track the chain from signal to result
For a resolved bug, record the affected accounts, ARR tier, product area, identification date, owner, release or service change, and post-resolution behavior. If renewal risk falls afterward, document the supporting evidence and label the relationship as influenced rather than automatically claiming causation.
For an expansion request, capture the opportunity context before prioritization. Track whether the feature shipped, whether the opportunity progressed, and whether the customer used the capability after release. Segmenting requests by ARR and lifecycle stage helps separate a repeated request from a commercially important one. It also prevents high-volume, low-value feedback from crowding out a smaller signal tied to a renewal or expansion decision.
For an early warning alert, compare the customer's status before and after intervention. Did the success team create a recovery plan? Did usage stabilize? Did the account renew? Preserve these connections so leadership can inspect the full path from signal to action to outcome.
A practical value ledger can include:
- Protected revenue: ARR associated with accounts where a validated issue was resolved before a renewal decision.
- Influenced expansion: Opportunity value connected to a prioritized request and later product adoption.
- Avoided waste: Roadmap effort redirected from low-impact work toward a problem with stronger commercial evidence.
- Operational recovery: Unresolved issues closed with documented ownership and customer follow-up.
- Decision speed: Time saved by replacing manual synthesis with searchable, classified evidence.
Keep the headline metrics honest
The top-line dashboard still needs a compact operating view. Overall satisfaction, response volume, negative feedback percentage, and unresolved issues provide the health check. Segmentation and workflow data explain what those movements mean, including which ARR tiers and lifecycle stages require attention. For practical guidance on structuring a customer feedback analytics dashboard, use the earlier metrics recommendations as the starting point, then connect them to commercial outcomes.
Do not reduce ROI to one unqualified number. Show the evidence path, confidence level, affected accounts, intervention, and outcome. Finance can challenge the assumptions, while product and customer teams can improve prioritization when the underlying evidence remains visible.
The strongest programs turn qualitative input into a commercial operating loop. Customers describe friction, AI groups the evidence, account context sets priority, a team owns the action, and revenue or retention outcomes inform the next decision. That is how a customer feedback dashboard progresses from satisfaction tracking to product intelligence.
SigOS connects support tickets, chat transcripts, sales calls, and usage metrics to recurring themes, churn signals, expansion opportunities, and revenue-aware priorities. Teams replacing survey-only reporting can visit SigOS to review its dashboard and workflow integrations.
Keep Reading
More insights from our blog

Ready to find your hidden revenue leaks?
Start analyzing your customer feedback and discover insights that drive revenue.
Start Free Trial →