SaaS Product Analytics: A Revenue-Driven Guide
Master SaaS product analytics to connect user behavior with revenue. Learn core metrics, data quality practices, and playbooks to reduce churn and drive growth.
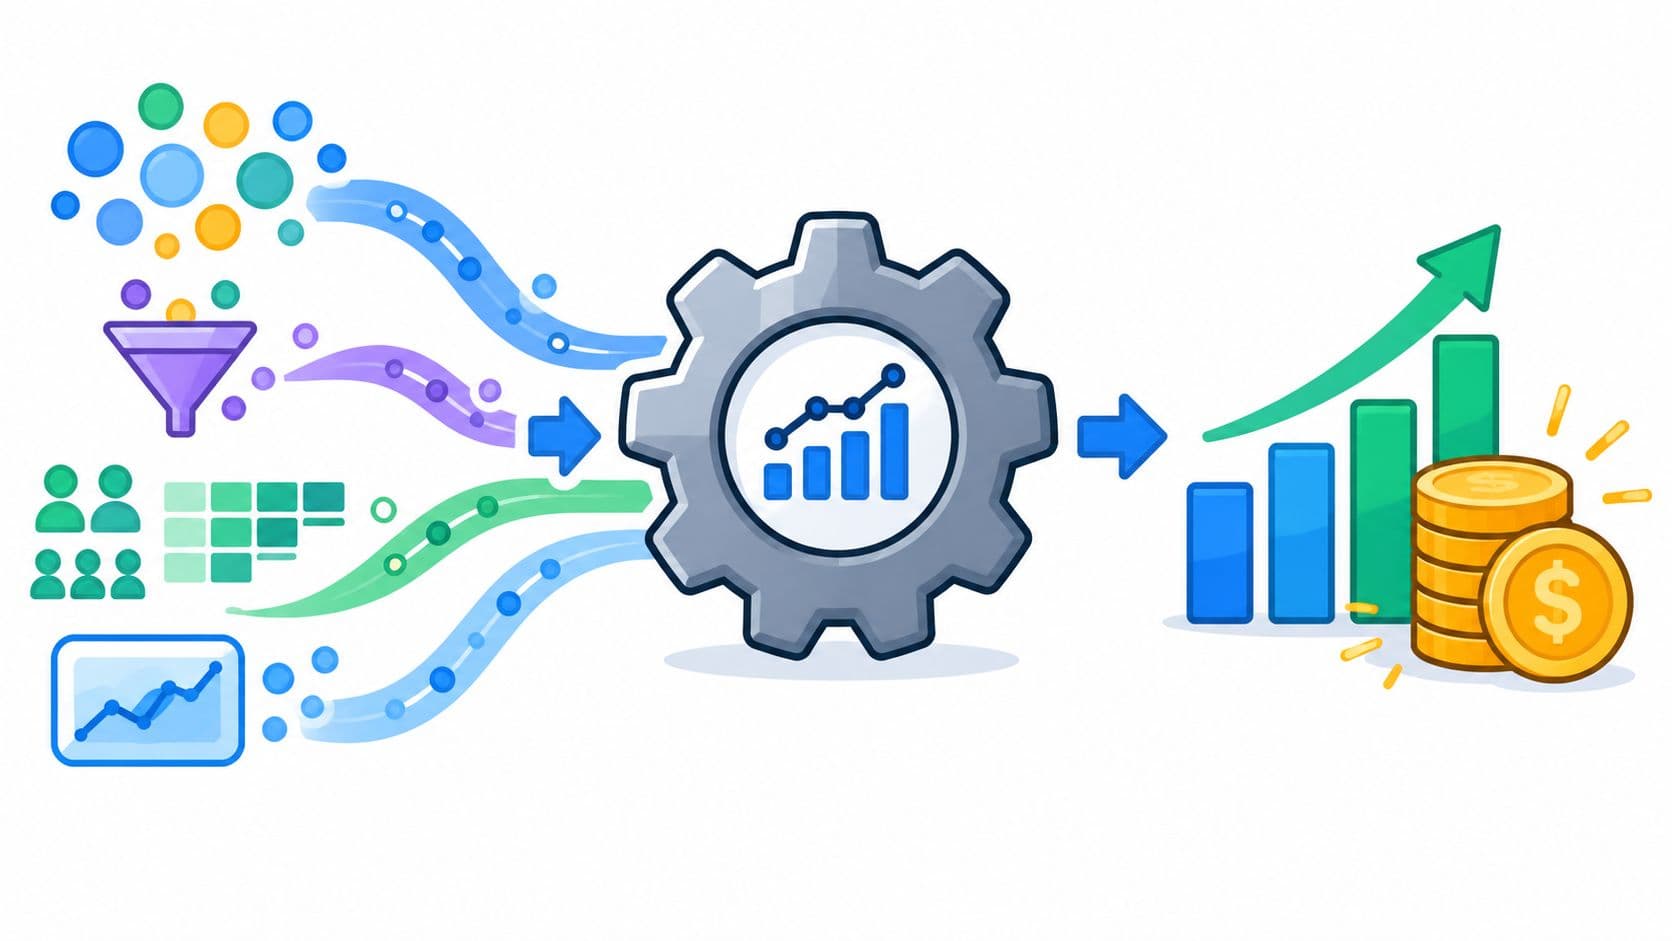
Most advice about SaaS product analytics starts with the wrong question: “Which dashboards should we build?” More dashboards rarely solve a prioritization problem. They often give teams more ways to celebrate activity while avoiding the harder question, which user behavior changes revenue, and by how much?
A daily active user count can rise while high-value accounts stop using a critical workflow. A feature can receive enthusiastic requests yet fail to influence retention, expansion, or deal size. Product analytics earns its place in a SaaS business when it connects the event stream to commercial outcomes, then turns that connection into a decision about what to fix, build, or escalate.
Redefining SaaS Product Analytics for Revenue Impact
SaaS product analytics began with event tracking and usage reports. It now functions as a decision layer for product, growth, customer success, and revenue teams. Market estimates place the category at roughly USD 9.6 billion in 2021 and USD 14.81 billion in 2023, with forecasts ranging from about USD 25.3 billion by 2026 to USD 58.78 billion by 2030, according to MarketsandMarkets' product analytics market analysis. The range reflects different methodologies, but the direction is consistent. Companies increasingly treat analytics as strategic infrastructure rather than optional reporting.
That investment only makes sense if analytics helps answer financial questions. “How many users clicked the feature?” is descriptive. “Which accounts that adopted the feature expanded, renewed, or reduced usage?” is operational. “What revenue is exposed if this workflow fails for a high-value segment?” is the question that should influence a roadmap.
Replace activity metrics with economic questions
A revenue-driven analytics practice starts with a business outcome and works backward:
- Churn: Which usage decline, unresolved workflow, or missing capability appears before cancellation?
- Expansion: Which behaviors distinguish accounts that add seats, upgrade plans, or purchase adjacent products?
- Deal size: Which product capabilities repeatedly appear in larger opportunities or unblock procurement?
- Retention: Which activation path produces sustained account-level value rather than a short burst of activity?
This doesn't mean abandoning engagement metrics. It means assigning them a job. A login is weak evidence. Completion of a core workflow by several relevant roles in an account is stronger evidence. A repeated behavior that occurs before renewal or expansion is stronger still, provided the team tests the relationship rather than treating correlation as proof.
Practical rule: Never promote a product metric to a company KPI until you can state which customer outcome it helps explain and what decision changes when the metric moves.
Teams often need a shared operating model before they need another tool. A useful product analytics platform overview should be judged by whether it supports identity resolution, cohort analysis, account-level context, revenue joins, and action workflows. A visually polished dashboard that can't connect usage to billing or CRM records is still a reporting surface.
The practical shift is simple but demanding. Stop asking whether users are “engaged” in the abstract. Ask whether the right users are completing the behaviors that create durable value for the account, and whether those behaviors are associated with the revenue outcomes leadership is trying to improve.
Core Metrics and Measurement Primitives
Revenue attribution fails when the measurement primitives are vague. Before a team models churn or expansion, it needs a consistent definition of what happened, who performed the action, when it occurred, and which account and commercial context applied.
An event should describe a meaningful product action, not an incidental interface state. report_exported is more useful than button_clicked because it represents an outcome in the user journey. Properties should carry the context needed for analysis, such as account identifier, plan, role, workflow type, object identifier, and whether the action completed successfully.
Build the event model around decisions
A practical taxonomy usually contains four layers:
- Lifecycle events, such as signup, invitation, onboarding completion, activation, upgrade, downgrade, and cancellation.
- Outcome events, such as a successful report export, integration sync, workflow completion, or published result.
- Friction events, such as validation failure, permission denial, timeout, import error, or abandoned setup.
- Context properties, including plan, account, role, acquisition source, environment, and product version.
Funnels then connect these events into a journey. Use them to find where users stop, but don't assume every journey is linear. A B2B buyer may invite colleagues, return through an integration, complete setup later, and only then reach the core outcome. A funnel should reflect the business process, not force behavior into an artificial sequence.
Use cohorts to expose what aggregates hide
Aggregate active-user totals mix new, mature, expanding, and declining accounts into one number. Cohort analysis fixes that by grouping users according to a shared attribute, such as signup period, plan, or first completion of a meaningful action, then tracking each group over time. Amplitude's guide to cohort analysis describes why this approach reveals retention and churn patterns that a single aggregate metric conceals.
For B2B SaaS, weekly cohorts often provide a useful balance between signal stability and product usage frequency. Daily cohorts can create noise when customers use the product for periodic workflows, while broad monthly cohorts can hide changes in onboarding or release quality. The correct interval depends on the product's natural cadence, but the principle is stable: choose a cohort window that matches how customers receive value.
A retention curve is only the beginning. Add commercial outcomes to the cohort view:
| Cohort dimension | Behavioral view | Revenue question |
|---|---|---|
| Signup week | Core workflow completion over time | Which acquisition periods produce durable customers? |
| Plan type | Feature adoption and active roles | Which plan experiences expansion or contraction? |
| Activation path | Time to first value and repeat usage | Which path predicts renewal quality? |
| Account segment | Breadth and depth of usage | Which segments support larger deals? |
A SaaS metrics dashboard framework should make these comparisons easy without encouraging teams to chase every available metric. The best dashboard answers a decision question, identifies the affected accounts, and points to the next action.
Implementation Best Practices and Data Quality
A revenue model built on unreliable events produces confident nonsense. Teams should treat instrumentation like a production system, with ownership, validation, versioning, and observable failure states.
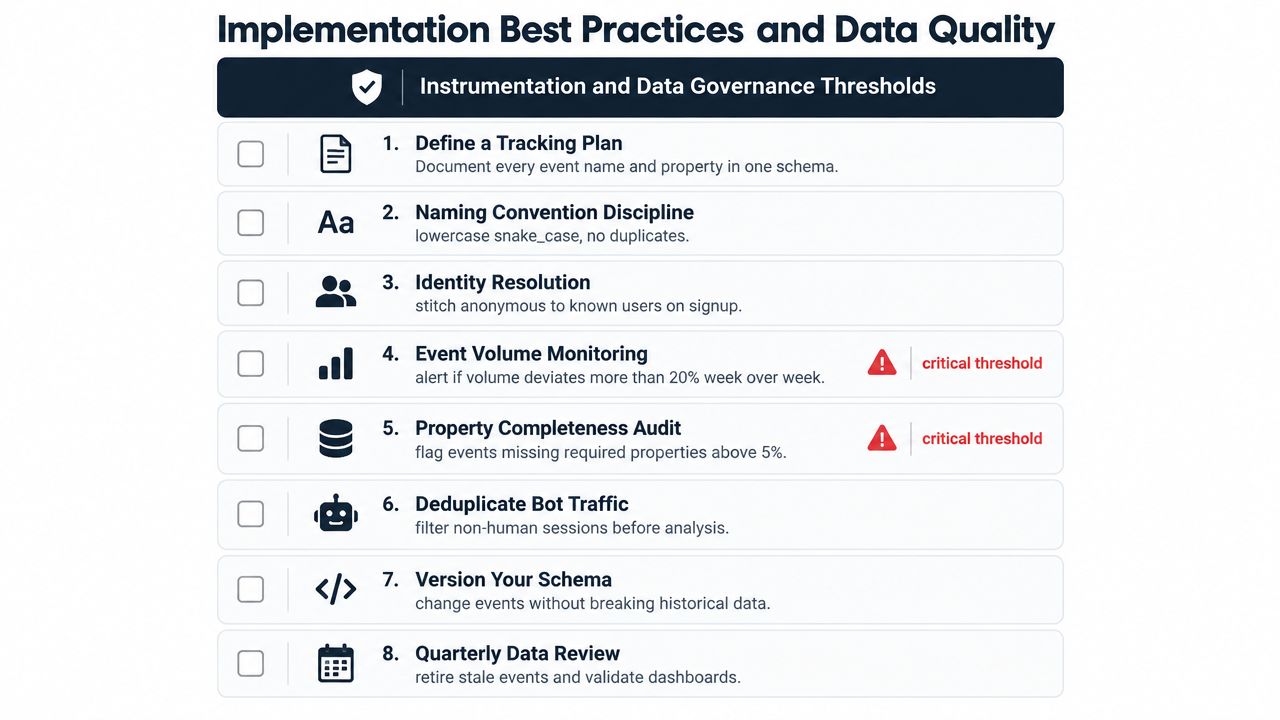
Start by writing a tracking plan before adding SDK calls. For each event, record its name, purpose, triggering condition, required properties, owner, source system, and acceptable delay. Define the business question beside the event. If nobody can explain what decision an event supports, it probably doesn't belong in the first implementation.
Establish controls before analysis
A practical implementation sequence looks like this:
- Define the canonical schema. Use stable names for events and properties, and distinguish attempts from successful outcomes.
- Resolve identity deliberately. Connect anonymous activity to the known user after authentication, then associate that user with the correct account.
- Validate in development and production. Test payloads, permissions, duplicate firing, browser behavior, mobile behavior, and server-side events.
- Join product and commercial data. Map account identifiers across the product database, warehouse, billing system, and CRM. Keep personal data exposure limited to what the analysis requires.
- Monitor quality continuously. Alert on missing properties, unexpected volume changes, stale timestamps, and schema drift.
- Document exceptions. Imports, backfills, migrations, bots, internal users, and automated agents can distort behavioral analysis unless teams label or exclude them consistently.
A strong stack should target accuracy near 98% or higher, completeness near 95% or higher, validity near 99% or higher, and timeliness under 15 minutes for operational reporting, as outlined in Quantum Metric's product analytics guide. These are control thresholds, not proof that a model is correct. A perfectly captured event can still represent the wrong business concept.
Protect the joins that make attribution possible
The most damaging errors often occur between systems. A product event may use a user ID, billing may use a subscription ID, and the CRM may use an account ID. Create a governed mapping layer rather than relying on analysts to reconcile identifiers manually in every query.
Review quality at the level of the decision. If the customer success team receives an account risk alert, confirm that the account association, plan, renewal status, and recent usage window are all valid. If product managers use feature adoption to prioritize work, confirm that the event captures successful use rather than merely rendering a screen.
Teams that ignore governance usually discover the problem during a high-stakes review, when a missing property or identity mismatch has already biased funnel, retention, or churn analysis. Treat data quality as part of product operations, not as cleanup assigned to an analyst after launch. Guidance on recurring data quality issues can help teams formalize that ownership.
Advanced Analysis Techniques for Revenue Signals
The useful unit of analysis isn't always the user. In enterprise SaaS, the account is often the commercial unit, while users and events provide the behavioral evidence. A revenue-weighted model therefore needs to connect individual actions to account-level outcomes without pretending that every correlation is causal.
Start with a labeled outcome table. For each account and observation period, record the relevant product behaviors, plan and contract context, support interactions, renewal or expansion outcome, and deal attributes where available. Then compare behavior across accounts with similar lifecycle and commercial conditions. This helps separate a genuine product signal from a simple size effect, where larger accounts naturally produce more activity.
Analyze behavior that precedes commercial movement
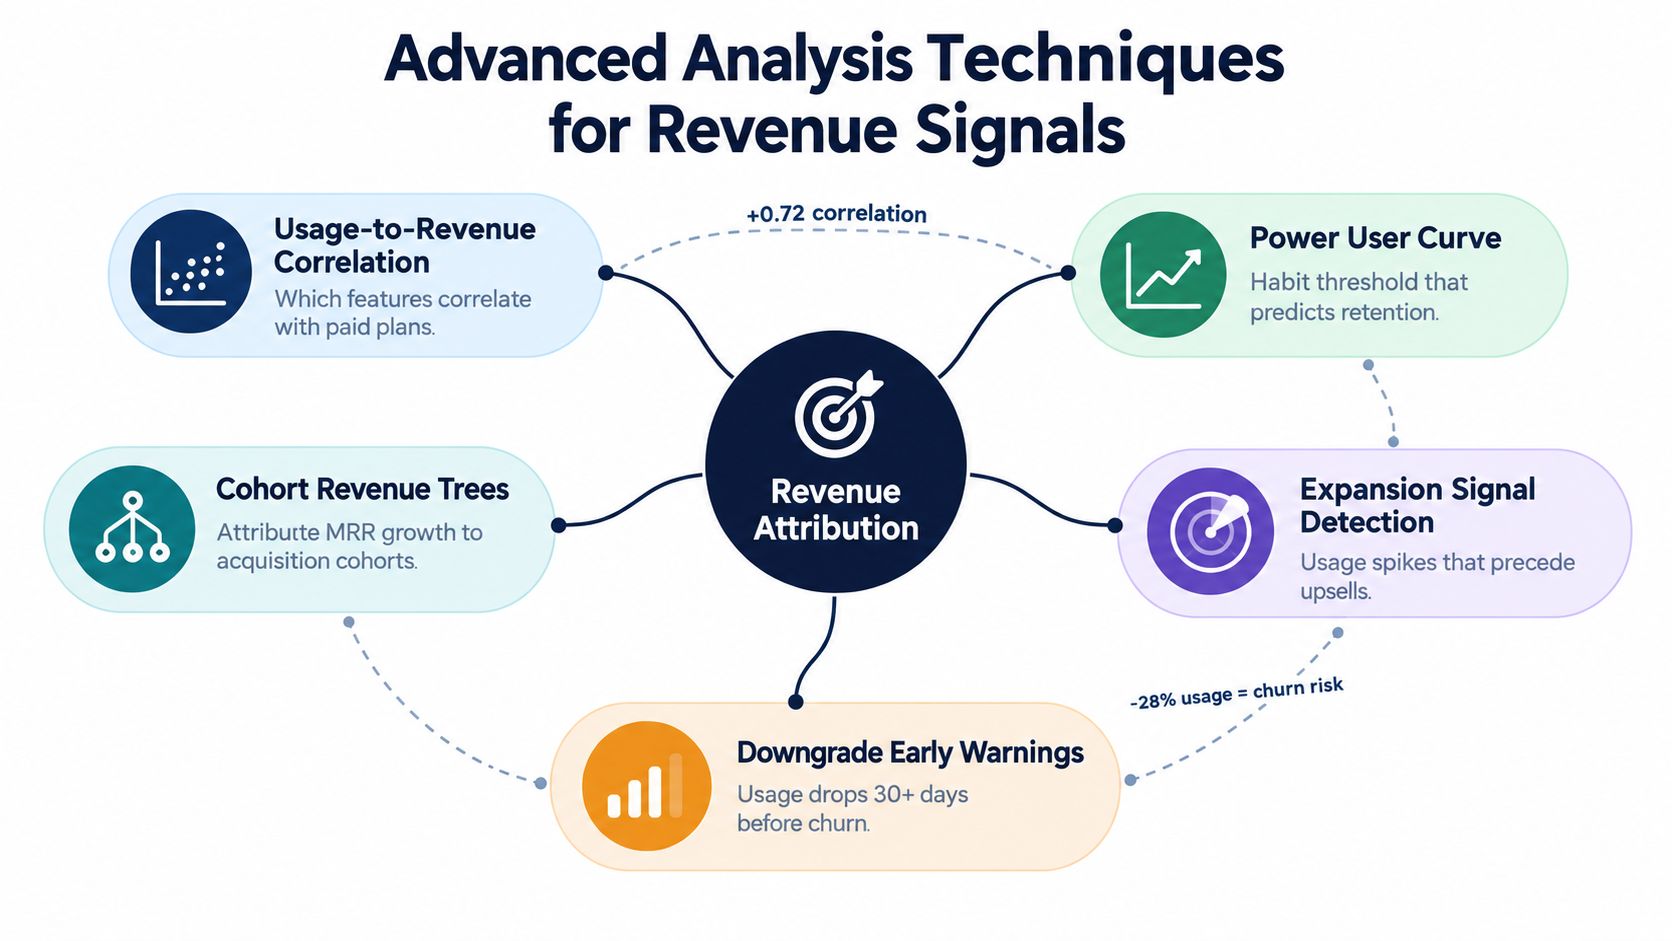
Five techniques are particularly useful:
- Usage-to-revenue correlation: Compare feature adoption and successful workflow completion with paid plan, renewal, expansion, and deal-size segments. Use controls for account size, tenure, and plan before treating a pattern as prioritization evidence.
- Power-user curves: Identify the usage depth or breadth associated with durable retention. The threshold isn't universal, so derive it from your own cohorts rather than importing a benchmark.
- Expansion signal detection: Look for increases in relevant users, workflow volume, integration breadth, or limit pressure before upgrades. Send qualified signals to sales or customer success only after checking whether the pattern repeats.
- Downgrade early warnings: Detect meaningful declines from an account's own baseline, then inspect which workflows disappeared. A drop in total activity matters less than the loss of the behavior that previously represented value.
- Cohort revenue trees: Attribute new, retained, expanded, contracted, and churned revenue to acquisition cohorts and activation paths. This shows whether a growth channel creates customers who remain commercially healthy.
Turn models into ranked decisions
The category is moving toward product-led revenue tracking and warehouse-native analytics, but tool adoption alone doesn't solve attribution. Product-Led Alliance's State of Product Analytics report highlights the gap between generic dashboards and the harder task of connecting usage to churn, expansion, and deal size.
A practical prioritization score can combine:
- affected account value,
- number of similar accounts showing the pattern,
- confidence in the behavioral relationship,
- severity and reversibility of the problem,
- strategic importance of the segment,
- engineering effort and time to impact.
Don't turn that score into false precision. Its job is to make trade-offs visible. A bug affecting fewer accounts may outrank a broad usability request if those accounts carry materially greater renewal exposure. A feature request from a large prospect should gain weight when usage analysis shows the capability is also relevant to retained and expanding customers.
Teams that analyze collaboration data may also benefit from boost Slack community insights when community conversations reveal recurring friction or emerging demand. Treat those insights as qualitative context, then validate them against product behavior and account outcomes.
Actionable Playbooks for Product and Growth Teams
Analytics creates value only when it changes what someone does. The operating model should connect detection to ownership, intervention, and measurement without requiring an analyst to manually interpret every alert.
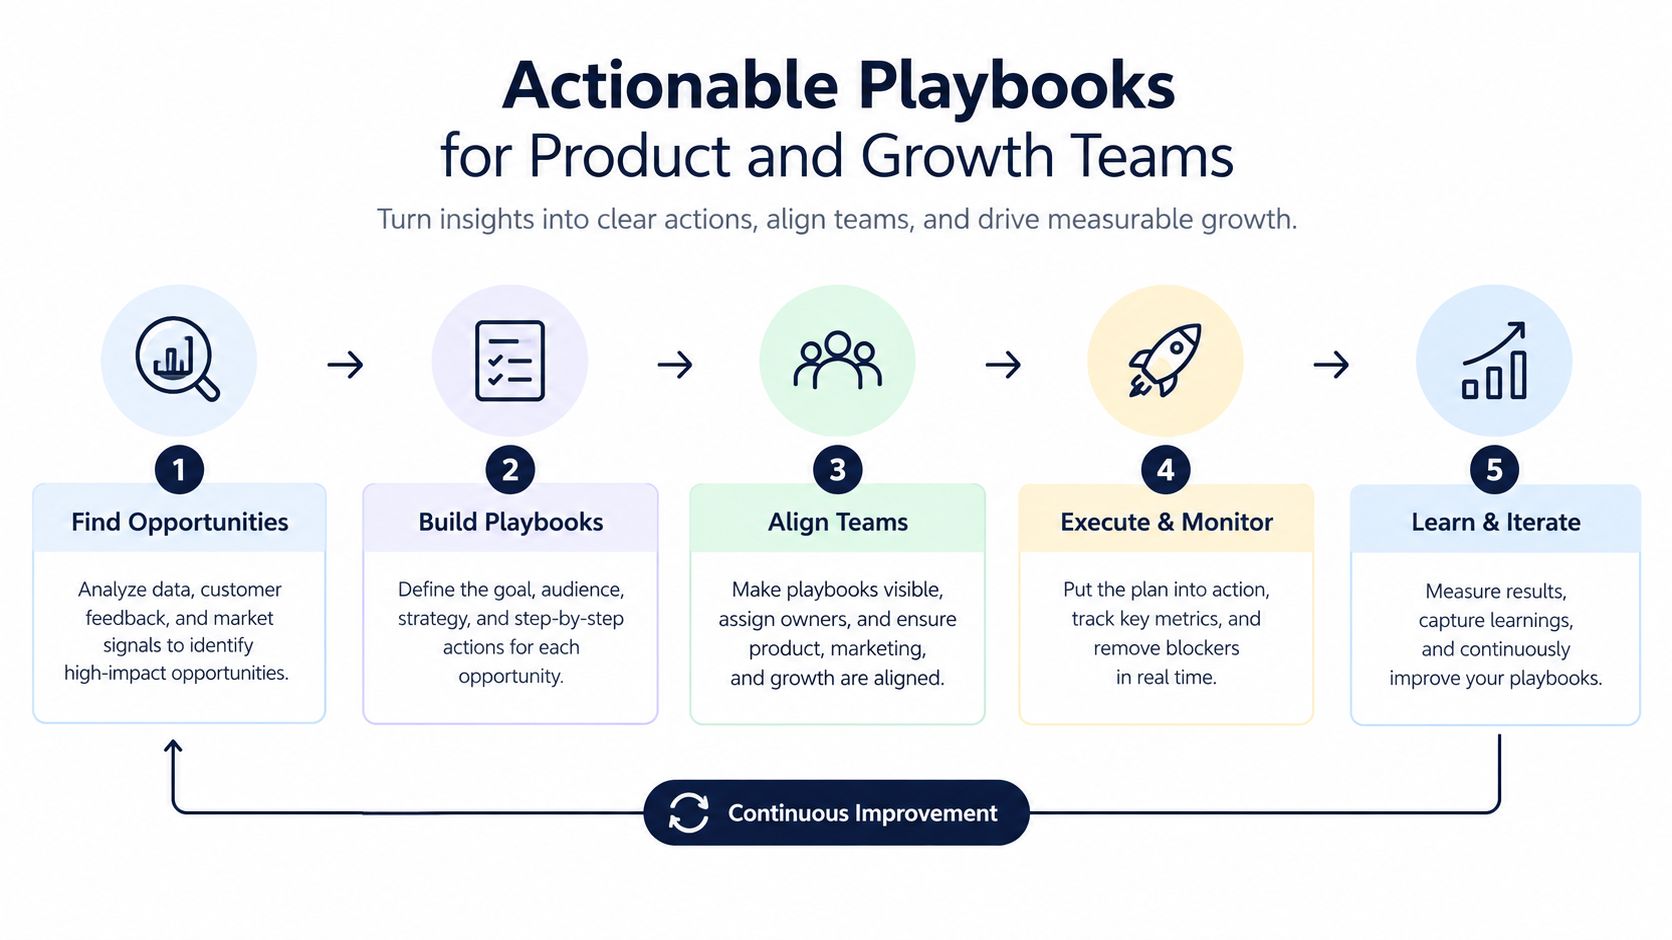
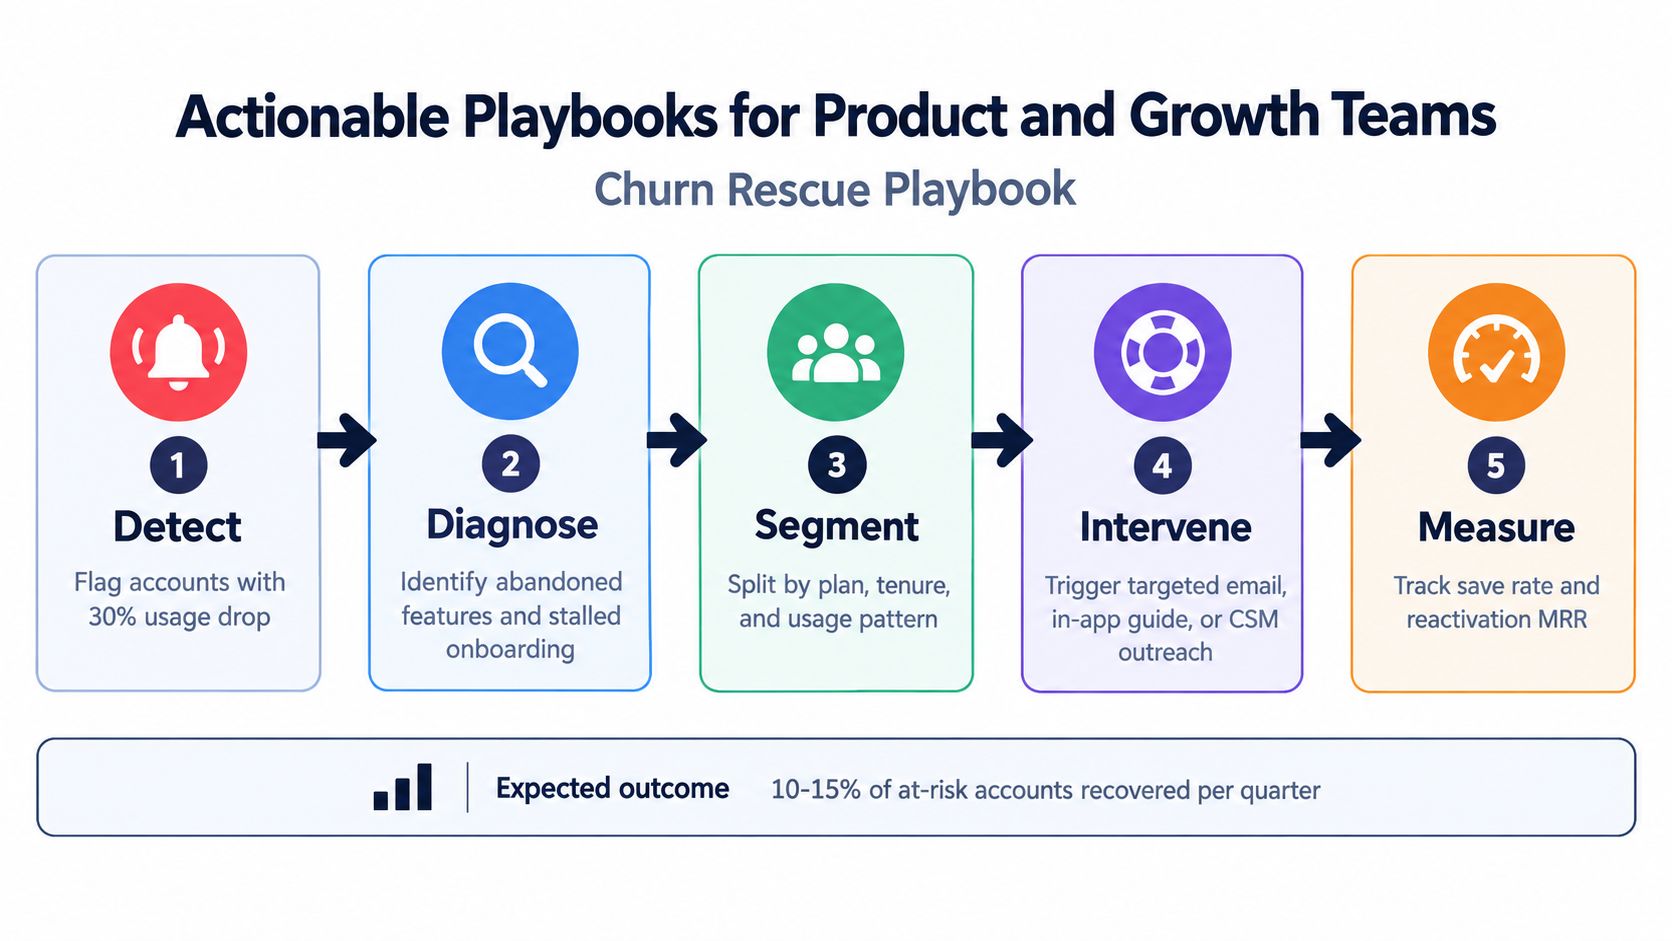
Churn rescue playbook
Detect. Define an account-level alert for a material decline in a key workflow relative to that account's established baseline. Avoid alerting on generic logins alone. A workflow drop is more actionable because it points to lost value.
Diagnose. Examine the abandoned feature, failed event, support history, onboarding status, and affected roles. Customer success needs enough context to distinguish a temporary change from a blocked business process.
Segment. Group the account by plan, tenure, role mix, implementation stage, and usage pattern. An enterprise account with a failed integration needs a different response from a small account that never completed setup.
Intervene. Route the signal to the appropriate channel. That may be an Intercom message, a Zendesk task, an in-app guide, or direct CSM outreach. The intervention should address the diagnosed friction, not promote an unrelated feature.
Measure. Track reactivation, restored workflow completion, renewal progression, and retained revenue. A sent email isn't a success metric. The team should know whether the account returned to a valuable behavior.
Expansion prioritization playbook
Start with the commercial question. Ask which capabilities appear in larger deals, which behaviors precede upgrades, and which customer requests recur among accounts already showing healthy usage. Then create a ranked backlog item that includes the affected segment, evidence, revenue context, confidence, and proposed success event.
Push that context into Jira or Linear rather than leaving it in a quarterly slide deck. When engineering completes the work, connect the release to a cohort or account analysis. Measure adoption among the intended segment, then check whether the behavior changes expansion or deal progression.
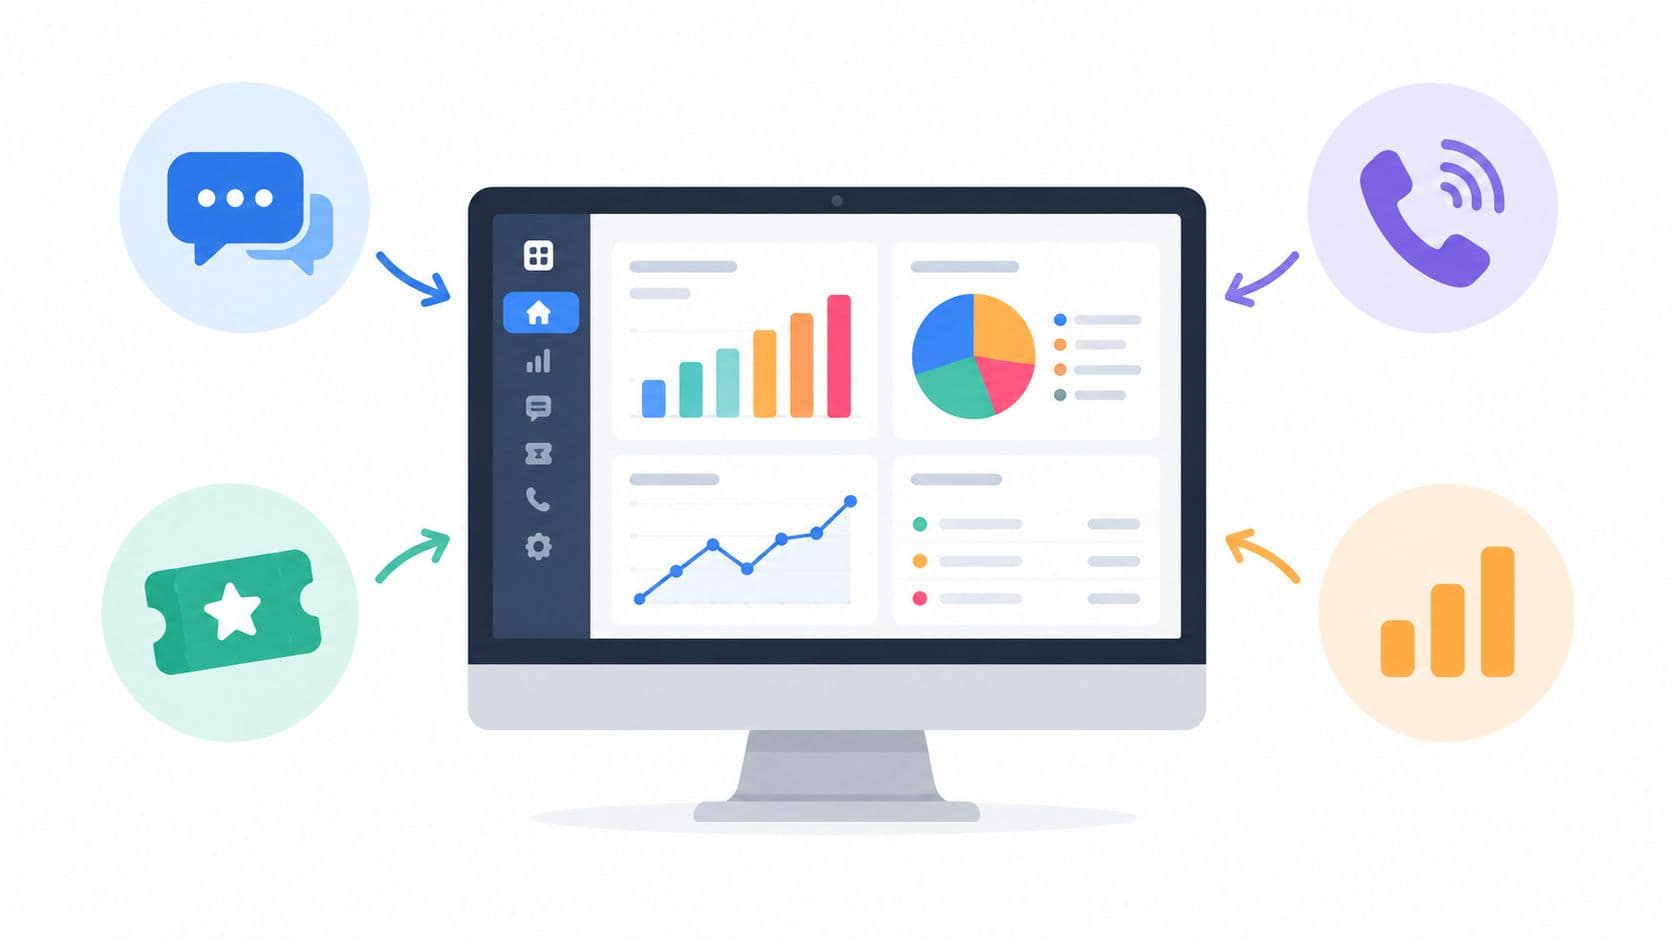
The playbook should also reject weak evidence. A loud request from one customer isn't automatically a priority. A request supported by repeated behavioral friction, multiple qualified accounts, and a clear commercial use case deserves more attention. SigOS can serve as one option for teams that want to combine product usage with support tickets, sales calls, chat transcripts, and revenue context, then create prioritized recommendations and revenue-impact scores.
Common Misconceptions and Analytics Pitfalls
The first misconception is that more data creates better decisions. It doesn't. More events can increase ambiguity when the taxonomy lacks ownership, properties are inconsistent, or teams can't distinguish meaningful outcomes from interface activity.
The second is that DAU is a reliable health metric for every SaaS product. It isn't. A product used for periodic, high-value workflows may show modest frequency while delivering strong commercial value. A daily visit can also indicate confusion, monitoring behavior, or an unresolved task rather than success.
Feature factory versus signal-driven product work
| Feature-factory behavior | Signal-driven alternative |
|---|---|
| Prioritize the request with the loudest internal sponsor | Compare the request with usage, account value, and repeated customer evidence |
| Measure launch success by clicks or views | Define the successful outcome before release |
| Treat all accounts as equally important | Weight exposure by plan, renewal context, and commercial value |
| Use an AI summary as the conclusion | Use automation to surface patterns, then validate cohorts and account context |
| Add tracking after the feature ships | Define the events and quality checks before implementation |
Customer feedback remains essential, but it describes intent, frustration, or a desired solution. Behavioral data shows what customers do under real constraints. Neither source is sufficient alone. A customer may request a feature because the current workflow is difficult, while the underlying solution is better onboarding or a permission fix.
AI summaries create a related risk. They can find anomalies and compress routine analysis, but they can't repair a broken event definition or understand an unexamined account join. Teams should use AI to propose questions, segments, and possible explanations, then validate those explanations with cohorts, event quality checks, and direct customer context.
Decision test: If a metric changes, can the team name the customer behavior behind the change and the action it will take? If not, the metric is probably occupying dashboard space without creating operating value.
Building a Signal-Driven Product Culture
A SaaS analytics program becomes durable when product, support, success, sales, and finance use the same account vocabulary and agree on what counts as value. Product teams need behavioral evidence. Revenue teams need commercial context. Customer-facing teams need an explanation they can act on, not a score they can't interpret.
The market's scale reinforces the strategic importance of this work. One recent estimate places the worldwide product analytics opportunity at USD 14.4 billion in 2026, projecting growth to USD 36.9 billion by 2033, as described by Persistence Market Research. The investment won't create an advantage by itself. Teams gain an advantage when they build a feedback loop from event quality to analysis, from analysis to prioritization, and from prioritization to measured commercial outcomes.
A practical starting sequence
- First, audit the foundation. List the events used in churn, retention, activation, and expansion decisions. Remove ambiguity and assign owners.
- Next, choose one commercial outcome. Start with a clearly defined churn, expansion, or deal-progression question rather than attempting a company-wide model.
- Then, build the account join. Connect product identity with billing and CRM records while limiting unnecessary personal data.
- After that, create one intervention. Route a validated risk or opportunity signal to a person who can act on it.
- Finally, review the result. Compare behavior and commercial outcomes for the affected cohort, document what changed, and update the model.
The cultural shift is from “What should we put on the dashboard?” to “What decision deserves better evidence?” Once teams ask that question consistently, product analytics stops being a passive reporting layer. It becomes a shared operating system for building what customers use, protecting revenue at risk, and investing in the behaviors that support expansion.
SigOS helps SaaS teams connect product usage with support conversations, sales feedback, and revenue context to identify patterns tied to churn, expansion, and prioritization. If you want to replace subjective backlog debates with revenue-aware product signals, visit SigOS and explore how the platform can fit into your analytics workflow.
Keep Reading
More insights from our blog


Ready to find your hidden revenue leaks?
Start analyzing your customer feedback and discover insights that drive revenue.
Start Free Trial →