Data Pipeline Automation: A Practical Guide for SaaS Teams
Learn how data pipeline automation works, its business benefits, architectures, KPIs, and an implementation roadmap tailored for SaaS product and growth teams.
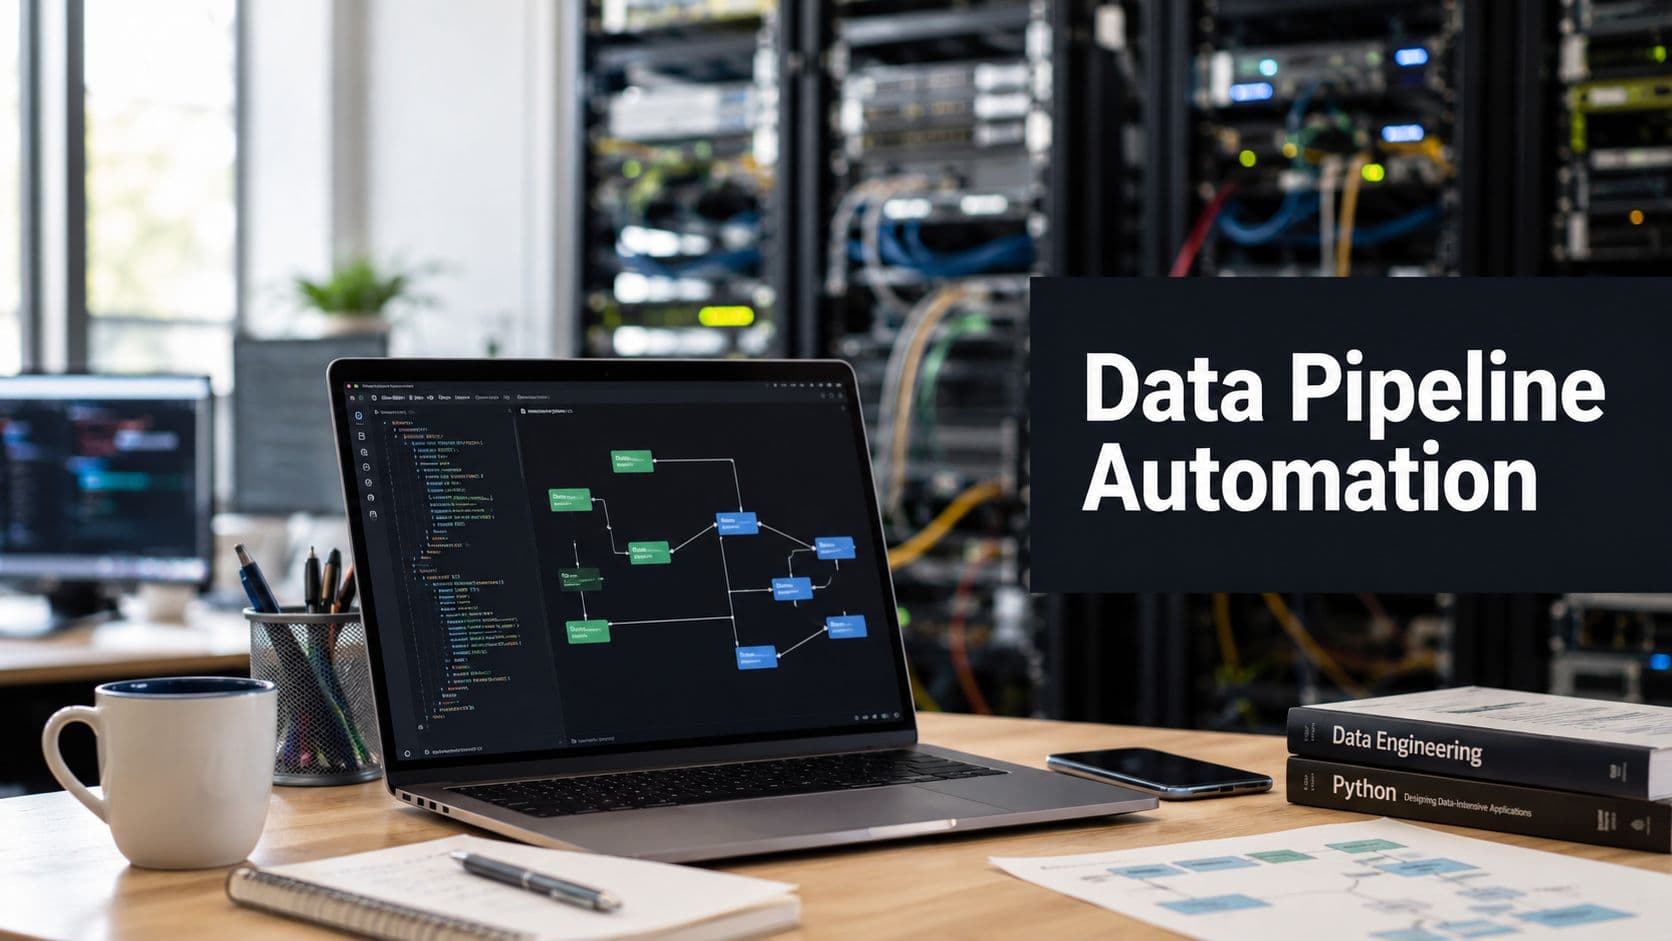
Data pipeline automation has crossed a line. The global data integration market was estimated at USD 15.18 billion in 2024 and is projected to reach USD 30.27 billion by 2030, a signal that pipeline automation is no longer a niche engineering convenience, it's mainstream infrastructure for modern businesses. For SaaS teams, that matters because the data behind activation, churn, expansion, and product usage can't sit in brittle scripts and manual exports if leaders want decisions that arrive on time.
The problem is familiar: a dashboard breaks after a schema change, a growth report lands late, a support export misses records, and someone on the data team spends the morning stitching together point integrations. Automation is supposed to remove that drag, but the challenge isn't just moving data faster. It's coordinating sources, transformations, governance, and downstream actions across fragmented systems without making the environment harder to trust.
That's the lens here. The practical question isn't whether pipelines can be automated, it's what should be automated, where orchestration matters most, and where AI still falls short. For SaaS product, growth, and data teams, the answer changes how you think about reliability, experimentation speed, and the signals that drive revenue.
Why Data Pipeline Automation Matters Now
The market is telling the same story as the engineering teams. When a category like data integration is measured in the tens of billions and still projected to grow strongly through 2030, it's usually because the underlying work has become essential business infrastructure, not a specialty concern tucked inside one team's backlog. The shift from manual exports and point-to-point scripts to managed integration platforms, iPaaS, streaming tools, and cloud-native orchestration reflects a simple reality, organizations need data to move reliably enough for analytics and operational decisions to work at scale. Grand View Research on the data integration market makes that scale visible.
For SaaS teams, the timing pressure is obvious. Product usage, billing, support, sales, and lifecycle data all need to line up before a growth meeting or a retention review turns into guesswork. If those feeds arrive late or break, the team ends up debating numbers instead of acting on them.
The business shift underneath the tooling
The deeper change is that pipeline automation is no longer just about reducing toil in the warehouse. It now supports real-time operational intelligence, lower maintenance overhead, and faster time-to-insight across major markets where adoption is strongest, including North America and Europe, as described in the same market forecast. That matters because the business value isn't the pipeline itself, it's the speed and trust it gives to the people who rely on it.
A useful way to think about the current state is this, organizations aren't trying to automate one job at a time anymore. They're trying to make the whole path from source system to decision point resilient enough that growth, product, and support can work from the same live truth.
Practical rule: if a dataset can break your weekly review when it's late, it's already operational infrastructure, not a side project.
Teams that treat data movement as a background task usually discover the cost only after the first serious outage or reporting dispute. Teams that treat it as part of the product operating system get better odds of seeing problems early, fixing them faster, and trusting the numbers when they matter most.
What Data Pipeline Automation Actually Means
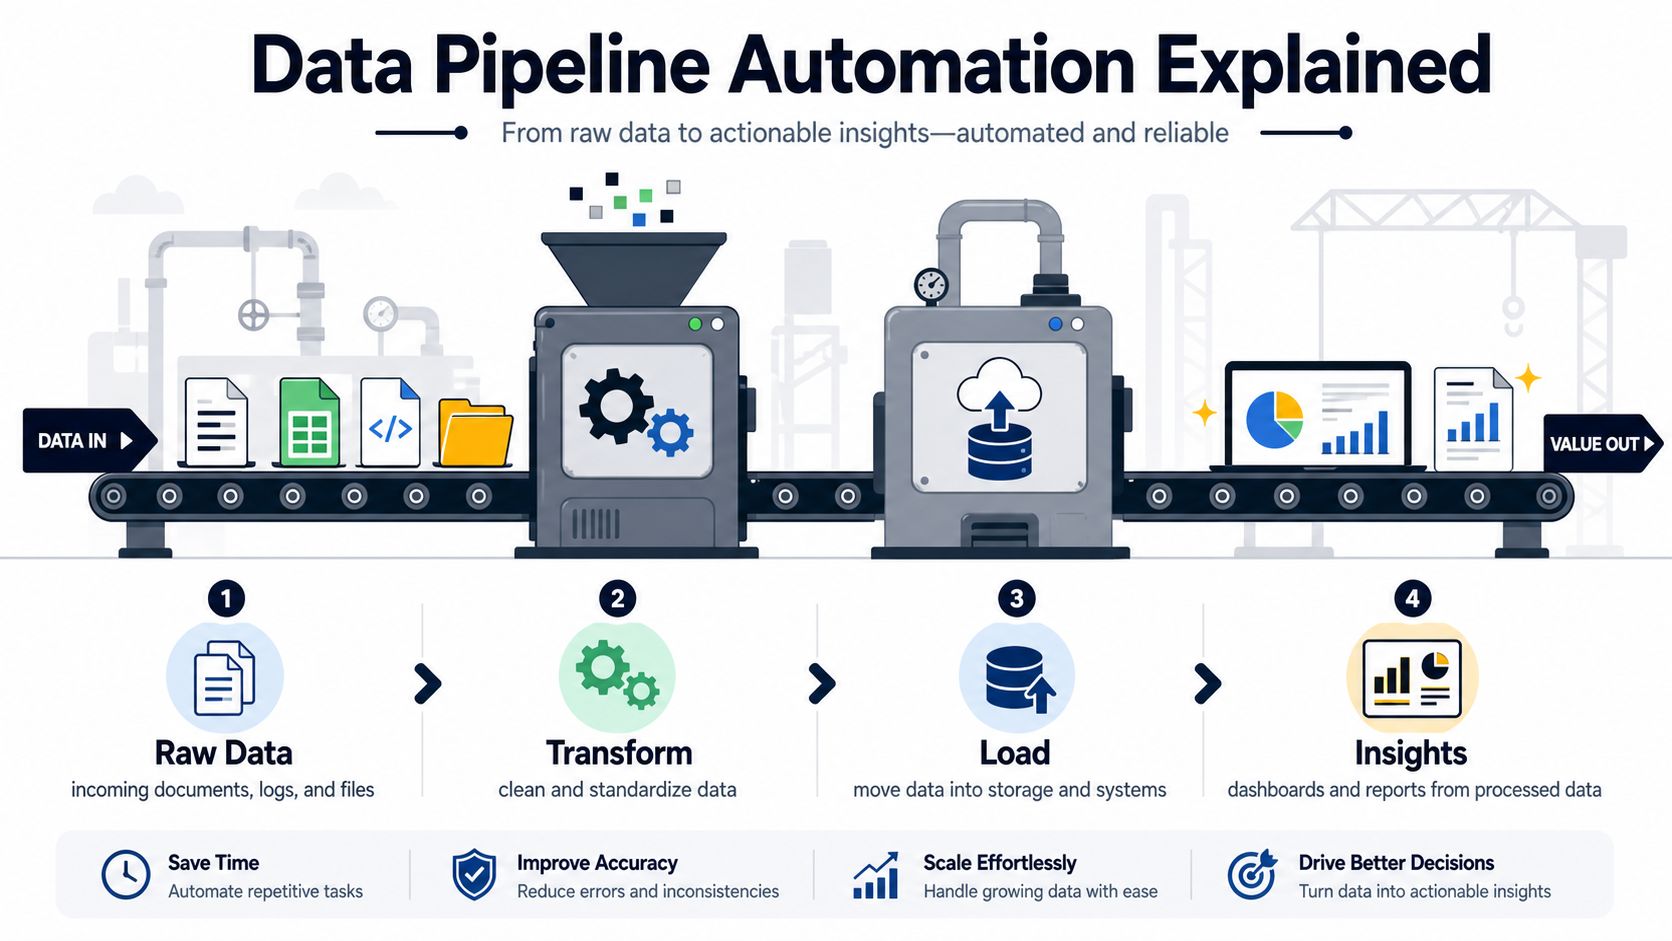
A good mental model is a factory conveyor belt. Raw materials enter at one end, machines reshape them along the line, and finished goods leave ready for use, without a worker carrying each item between stations. Data pipeline automation works the same way, source data enters, processing happens in controlled steps, and outputs land in analytics, reporting, or operational systems with minimal manual handling.
That automation is more than scheduling. It combines scheduling, dependency management, retries, and alerting so failures don't become catastrophic. A cron job can start a script on time, but it can't coordinate the full lifecycle of a data movement path across source systems, transforms, warehouses, and downstream consumers.
The distinction matters because teams often call a script “automation” when it's really just a timed manual process. If one step fails and nobody knows until a stakeholder complains, that's not orchestration, it's deferred firefighting.
ETL, ELT, orchestration, and iPaaS in plain English
ETL and ELT are process patterns. ETL extracts data, transforms it, then loads it. ELT extracts and loads first, then transforms inside the target system. Orchestration is the control layer that coordinates how those steps happen, in what order, with what dependencies, and what happens when a task fails.
iPaaS sits nearby as an integration layer for connecting apps and systems, especially when the problem spans SaaS tools and cloud services. In practice, vendors often blur these categories because the buyer is usually looking for a working system, not a taxonomy lesson. The challenge is recognizing whether you need a point solution for one flow or an orchestration layer that can coordinate many.
A pipeline is automated when the system can keep moving data, handle exceptions, and tell you what happened without someone grepping logs at midnight.
For a useful external orientation on adjacent data engineering responsibilities, TekRecruiter's overview of data engineering is a straightforward place to map pipeline automation back to the broader discipline. It helps separate the mechanics of moving data from the job of designing the platform that makes that movement dependable.
Core Components and Architectures of an Automated Pipeline
An automated pipeline is a set of coordinated responsibilities, not a single tool. Ingestion pulls data from databases, APIs, files, event streams, and SaaS applications. Transformation then standardizes schemas, applies business rules, and shapes records for the warehouse or downstream service.
The orchestration engine provides the control plane. It defines what runs, what waits, which tasks retry, and when a dependency failure should stop downstream work. That coordination separates a collection of scheduled jobs from a system that can operate predictably under pressure.
Key layers for a resilient architecture
The storage layer holds the results, commonly in a warehouse or lakehouse that serves analytics and product workflows. The observability plane spans the stack, collecting logs, metrics, lineage, and failure signals. Teams need those signals to identify what happened, locate the break, and trace its downstream impact. For a visual planning aid, SigOS's data architecture diagrams guide shows how to map these layers and their relationships.
Architecture should follow operating conditions, not vendor popularity. Batch ETL suits stable timing windows and workloads that can tolerate delay. ELT fits environments where the warehouse handles most transformation work. Streaming is appropriate when latency affects a business process, while event-driven designs fit triggers generated by system activity rather than a fixed schedule.
Operational insight: fragmented SaaS and cloud stacks increase the value of centralized orchestration. Without a shared control layer, each connector can leave ownership split across teams, making failures slower to diagnose and recover.
Transformation logic also needs a clear home. Code buried in a notebook or app-specific script is difficult to test, govern, and restore after an incident. Explicit dependencies in the orchestration layer expose a failure's blast radius before it reaches a stakeholder.
AI can help generate mappings, classify fields, and suggest transformations, but it cannot resolve unclear ownership or decide whether a metric's business definition is correct. Product and growth teams still need agreed contracts, accountable owners, and review points. For a broader perspective on how analytics supports teams that build a data-driven startup culture, see the linked resource.
Strong architectures allow different flows to use different execution models. The consistent requirements are visibility, recovery paths, and tests that give the business confidence in the result.
Benefits and Business Impact of Automating Pipelines
The most immediate return is time. Recent industry reporting says data engineering teams spend more than 61% of their time on data integration tasks, and that 50% of organizations report that level of time allocation, which explains why automation keeps climbing the priority list. When the majority of engineering effort is consumed by moving, reshaping, and reconciling data, there's less time left for modeling, experimentation, and product-facing analysis. Peliqan's data integration stats summary captures that shift clearly.
What teams actually get back
Automation returns engineer hours to work that changes the product. Instead of babysitting recurring jobs, teams can improve event design, tighten data contracts, or build better activation and churn signals. That's especially valuable for SaaS businesses where small changes in funnel behavior or support volume can matter more than a bigger dashboard.
Reliability is the second payoff. Clean retries, dependency handling, and alerting reduce the chance that a missing file or failed join turns into a misleading executive report. When data is dependable, product managers and growth leads stop asking, “Can we trust this?” and start asking, “What should we do next?”
Faster time-to-insight is a practical benefit, not a slogan. If the pipeline lands sooner and with fewer exceptions, analysts can iterate faster on retention cohorts, pricing experiments, and expansion signals. The result is not just speed, it's decision quality.
Maintenance overhead drops too. Fragile scripts are expensive because every schema change becomes a tiny incident. A managed pipeline architecture compresses that chaos into a smaller set of monitored, recoverable failures.
For teams building around customer behavior, automation is a force multiplier only when the data is already trustworthy. That means the business benefit is not “more data,” it's better alignment between data collection and action. When the pipeline is stable, teams spend less time explaining discrepancies and more time shipping changes that matter.
KPIs and Reliability Benchmarks to Track
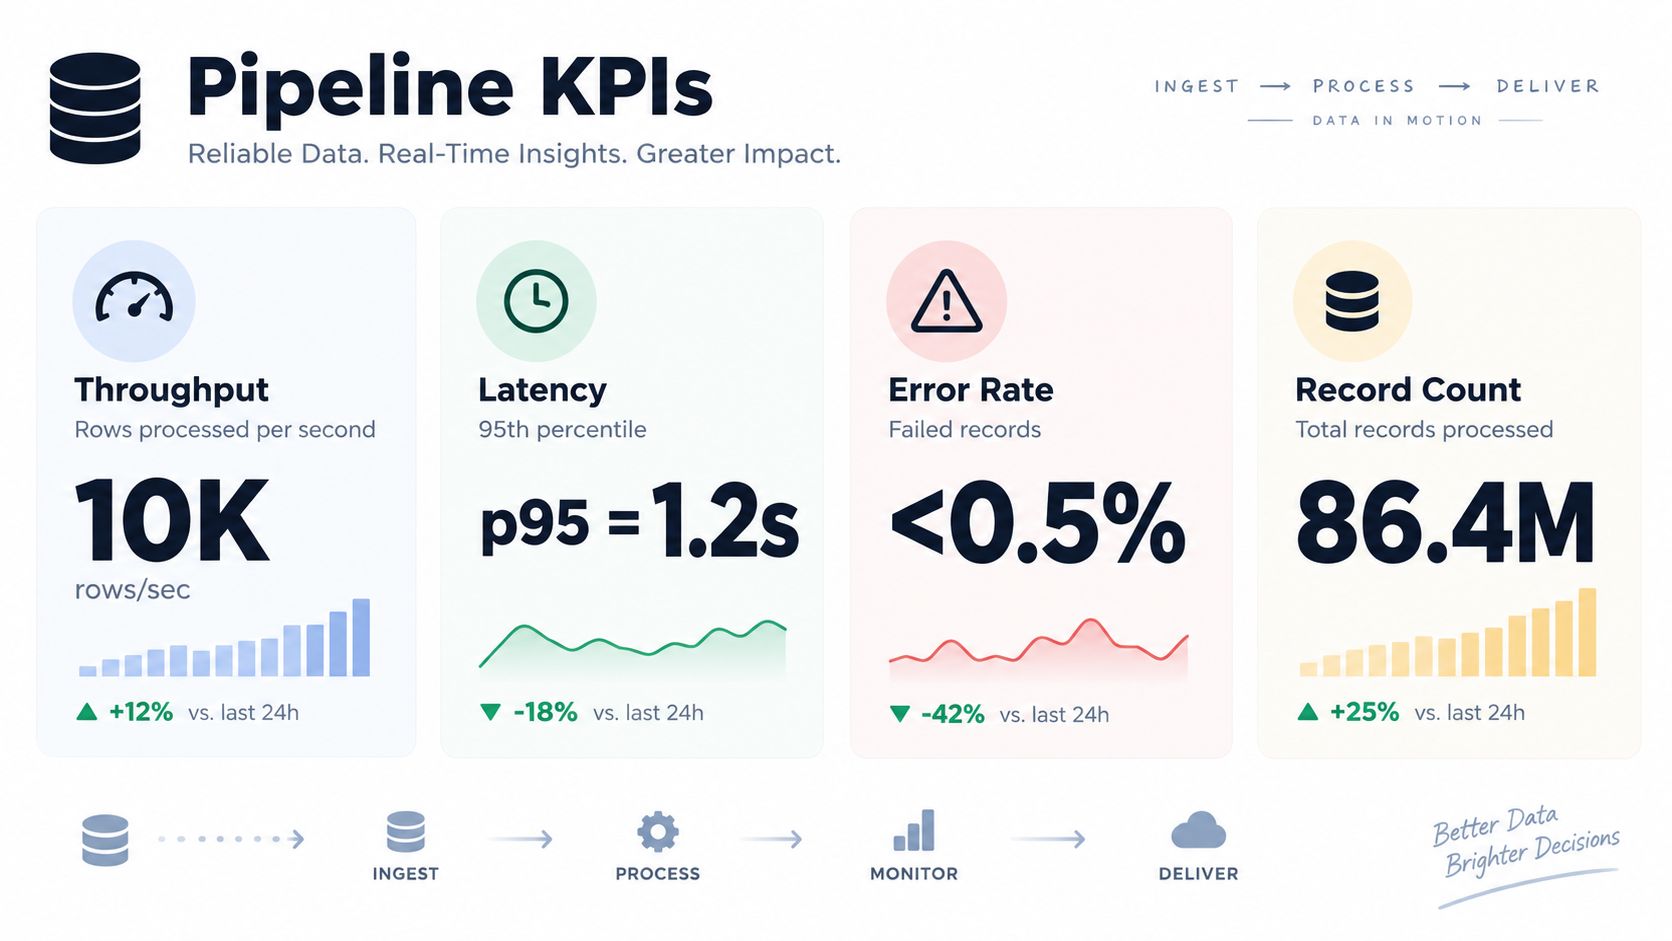
A pipeline can report successful jobs while still delivering incomplete or stale data. Track throughput, latency, error rate, and record-count reconciliation across each major stage. Together, these measures show whether the system keeps pace with demand, how quickly data arrives, how often processing fails, and whether volume changes between handoffs.
Operational guidance recommends monitoring throughput, latency, and error rates at every stage, alongside practical benchmarks such as error rate below 0.1%, availability around 99.9%, and recovery time under 30 minutes. Record reconciliation deserves equal attention. Silent loss can pass through a successful run and distort downstream reporting. DataExpert's ETL benchmarking metrics guide keeps the discussion tied to operating conditions rather than dashboard appearances.
Pipeline KPI Scorecard
| KPI | What It Measures | Target | Risk When Missed |
|---|---|---|---|
| Throughput | How much data moves through the pipeline in a given window | Stable capacity that matches workload | Backlogs, late dashboards, delayed downstream jobs |
| Latency | How long each stage takes from source to destination | Low enough for the business use case | Stale product and revenue signals |
| Error rate | How often jobs or stages fail | Below 0.1% where possible | Repeated retries, broken reports, hidden reliability debt |
| Record count reconciliation | Whether data volume matches across stages | Counts should align across critical steps | Silent data loss, incomplete models, trust erosion |
Interpreting the scorecard
Use the scorecard as an internal SLA tied to an owner and a response path. A throughput decline with stable latency can point to a new source or transformation creating a bottleneck. A low error rate alongside drifting record counts suggests a failure mode that ordinary job alerts may miss.
Practical rule: alert on both failures and mismatches. A successful job that moved the wrong number of records is still an incident.
Set tolerance by workflow. A marketing sync, billing feed, and model-training dataset serve different purposes, so they should not share identical thresholds. Record the accepted range, escalation owner, and business consequence for each flow.
For a reusable reporting structure, see SigOS's KPI report template. Teams that connect these measures across source systems, transformations, and downstream consumers get a clearer view of orchestration risk. AI can help detect unusual delays or volume shifts, but it cannot decide whether a mismatch reflects a valid business change, a broken contract, or missing data without reliable context.
Implementation Roadmap and Common Pitfalls
Most teams don't get automation right by trying to solve everything at once. They start with the highest-friction flow, usually the one that fails most often, takes the most manual effort, or blocks the most visible report. That first win matters because it shows where the pain sits, and it gives the team a concrete pattern to reuse.
A phased rollout that works in the real world
The first phase is an audit. Map every source, every handoff, every script, and every place where someone manually checks a job. That inventory usually exposes duplicate logic, undocumented dependencies, and flows that only one engineer understands. The common mistake here is treating the audit as a paperwork exercise instead of a risk map.
The second phase is focused automation. Pick one pipeline with clear business value, then add scheduling, retries, and alerting before expanding scope. Teams often skip straight to broader tooling and end up automating fragile processes that should have been redesigned first.
The third phase adds orchestration and observability across adjacent systems. Dependencies, lineage, monitoring, and cross-team handoffs get unified. Governance becomes essential, because automation spreads faster than policy if nobody defines ownership and access.
The fourth phase is end-to-end coverage. By then, the goal is not just job success, but coordinated behavior across systems, environments, and downstream consumers. That's where orchestration becomes more important than single-step automation.
The hardest layer is transformation logic, and the evidence says not to over-trust automation there. A benchmark for ELT automation, ELT-Bench, found that the top-performing agent reached 57% success in extraction and loading, but only 3.9% in transformation, across 100 pipelines, 835 source tables, and 203 data models. ELT-Bench on arXiv is a clear warning that schema reasoning and modeling still resist full automation.
Common failure modes to avoid
- Automating broken logic: If a manual process is already inconsistent, automation just makes the inconsistency faster.
- Skipping governance: Without ownership, access control, and change tracking, automated flows become harder to audit than the scripts they replaced.
- Confusing orchestration with monitoring: A scheduler can launch jobs, but it won't necessarily show how failures cascade across systems.
- Trusting AI too early: AI can draft code or suggest transformations, but that doesn't mean it can safely operate the pipeline on its own.
One useful perspective from industry reporting is that the challenge has shifted from having automation to coordinating it across fragmented systems. That's why teams that win here usually build controls and observability at the same time they expand automation, not after.
What This Means for SaaS Product and Growth Teams
SaaS teams feel pipeline weaknesses faster than most. Product usage feeds are late, churn cohorts don't reconcile, support tags drift, and growth experiments lose their measurement backbone. The business question isn't whether those flows are automated somewhere in the stack, it's whether they're orchestrated well enough to support decisions without a cleanup ritual first.
The AI gap makes this even more interesting. One 2026 analytics-engineering report summary says 72% of teams prioritize AI-assisted agentic coding, but only 24% prioritize AI-assisted data pipeline management, which suggests most attention is going to generating code rather than running reliable operations. The same brief points to metadata management and automation governance as key priorities, while enterprise research still finds 23% cite lack of automation or repeatability as a challenge. The dbt Labs analytics engineering activity summary shows the gap clearly.
Where AI helps, and where it still doesn't
AI is useful when the task is bounded, repetitive, and reviewable. It can help draft transformation code, summarize pipeline metadata, or suggest tests. It is much weaker when the problem is day-two operations, where you need controlled retries, lineage awareness, ownership, and failure recovery across several tools.
That's why investment should be in operating pipelines, not just generating them. For product managers and growth leaders, that means asking whether automation improves the reliability of churn data, expansion data, and feature-feedback signals, not just whether it reduced a developer task.
The ROI conversation should be simple. Measure engineer hours recovered, monitor error and recovery behavior against your targets, and check whether the downstream product signals arrive quickly enough to change decisions. If a pipeline is technically automated but still requires human cleanup before anyone trusts it, the automation hasn't paid off.
For teams building self-serve workflows around product and customer data, SigOS's self-serve analytics approach fits the same operational mindset. It connects collected signals to the people who need them without forcing every question through a manual data request queue.
The operating principle that matters most
More automation alone won't make a SaaS data stack AI-ready. Governance and observability decide whether automation becomes a force multiplier or a new source of fragility. If pipeline owners can see what changed, who owns it, and how it affects downstream metrics, AI can assist without becoming a blind spot.

SigOS helps SaaS teams turn customer feedback, usage data, and revenue signals into a prioritized operating view, with automated integrations into the tools teams already use. If your pipelines are the path that moves those signals, the next step is to make sure they're not just automated, but governed and useful at the point of decision. Visit SigOS to see how product and growth teams can connect pipeline reliability to customer intelligence that gets acted on.
Keep Reading
More insights from our blog



Ready to find your hidden revenue leaks?
Start analyzing your customer feedback and discover insights that drive revenue.
Start Free Trial →