The Definition of Behavioural Segmentation for Modern SaaS Teams
Discover the definition of behavioural segmentation and see how SaaS teams use it to reduce churn, boost revenue, and build products users love.

Let's be honest, traditional ways of grouping customers are starting to feel a bit outdated, especially for SaaS. Knowing a user's job title or company size is one thing, but it doesn't tell you the most important part of the story: how they actually use your product.
This is where behavioural segmentation comes in. It’s all about grouping users based on their actions and interactions, not just who they are on paper.
What Is Behavioural Segmentation

Think of your favourite local coffee shop. The barista might know your name (demographics), but what really matters is that they remember your usual order—a large oat milk latte with an extra shot (behaviour). They see you walk in, and they start making your drink without you even having to ask.
That’s behavioural segmentation in a nutshell. It’s about anticipating needs and creating a better experience based on past actions.
Instead of throwing all your users into generic buckets like "small businesses" or "enterprise clients," you create dynamic, meaningful groups based on what they actually do. This approach is so much more powerful because, as we all know, actions speak louder than labels.
Why Actions Speak Louder Than Words (or Demographics)
For a modern SaaS business, knowing a user works at a 500-person company in London doesn't tell you if they're a power user, on the verge of churning, or a perfect candidate for an upgrade. This is the gap that behavioural data fills. It gives you a direct window into the real user experience.
Suddenly, you can answer the questions that really drive growth:
- Who are my true power users? The ones who have made our product an indispensable part of their daily workflow.
- Which users are quietly slipping away? People whose login frequency is dropping or who've stopped using sticky features.
- What features are actually delivering value? Seeing what gets used most helps sharpen your product roadmap.
- Where are the hidden upsell opportunities? Spotting users who are consistently bumping up against plan limits.
Understanding these distinct user groups is the key to improving customer retention and building a product people can't live without.
Behavioural vs Traditional Segmentation Methods
To really grasp the difference, it helps to see how behavioural segmentation stacks up against older methods. Traditional approaches have their place, but they only provide a partial picture, especially in the fast-moving world of software.
| Segmentation Type | Basis of Grouping | Data Type | Key Insight for SaaS |
|---|---|---|---|
| Behavioural | User actions, feature adoption, engagement frequency, purchase history | Dynamic, real-time | Identifies churn risk, power users, and upsell opportunities. Shows how the product creates value. |
| Demographic | Age, gender, income, occupation | Static, personal | Helps shape high-level messaging and brand voice. |
| Geographic | Country, city, region, climate | Static, location-based | Useful for localizing content, pricing, and support hours. |
| Psychographic | Lifestyle, values, personality, interests | Static, attitudinal | Informs brand positioning and top-of-funnel marketing campaigns. |
As you can see, while traditional methods tell you who your users are, behavioural segmentation tells you what they need from your product. It’s this deeper level of understanding that separates good companies from great ones.
The goal is to move beyond assumptions and make data-driven decisions based on what users actually do. It’s the difference between guessing what your customers want and knowing what they need.
And this isn't just theory—the numbers back it up. Companies that actively use behavioural data have been shown to outperform competitors in sales growth by a staggering 85%.
Why? Because they can focus their efforts where it counts. They can identify and nurture the heavy users who, according to classic Pareto principle observations, often drive 80% of total revenue while only making up 20% of the customer base.
This approach transforms your customer data from a static contact list into a dynamic roadmap for smarter product development and sustainable revenue growth. For a deeper look at putting this into practice, you can explore our full guide here: https://www.sigos.io/blog/what-is-behavioural-segmentation-in-marketing.
The Four Core Types of Behavioural Segmentation

Knowing what behavioural segmentation is is one thing. Making it work for you is another. To get practical, you need to break down user actions into a few core categories. Think of these as different lenses for looking at your customers—each one shows you a different, vital piece of their story.
For SaaS product and revenue teams, these four types are the foundation. Getting a handle on them helps you stop making broad assumptions and start taking precise, targeted actions that actually move the needle.
Purchase and Spending Behaviour
Let's start with the most direct one: how people spend money with you. This segmentation groups users based on their entire transactional history. It's not just about who spends the most, but about the patterns behind how, when, and why they open their wallets.
Looking deeper than just top-line revenue helps you spot distinct financial personas that need to be handled differently:
- Big Spenders: These are your high-value customers, the ones consistently buying premium plans or tacking on add-ons without a second thought.
- Discount Hunters: These users are motivated by a good deal. They almost exclusively convert during a sale or when they have a coupon code.
- Freemium Loyalists: You've got long-term free users who, for whatever reason, haven't yet been convinced that an upgrade is worth it.
This is a cornerstone of behavioural segmentation because it ties user actions directly to your bottom line. In fact, analysing purchase behaviour—categorising customers by how recently, how often, and how much they spend—is incredibly powerful for seeing what's coming next. For B2B SaaS, this kind of segmentation has been shown to predict churn with 82% precision, a massive leap from the 55% accuracy you get with demographics alone. Rudderstack's analysis digs deeper into these behavioural predictors.
Usage Behaviour and Product Engagement
This is all about what users do inside your product. It focuses on how actively and deeply customers are interacting with your features. We’re talking about measuring login frequency, session duration, and feature adoption to figure out who your true champions are—and who’s slowly drifting away.
By looking at usage, you can separate the people who see your tool as a "nice-to-have" from those who can't get through their day without it. That distinction is everything when it comes to prioritizing your roadmap and outreach.
You'll quickly see a few common groups emerge:
- Power Users: These are your daily active users, the ones digging into advanced features and pushing your product to its limits.
- Occasional Users: They pop in weekly or maybe monthly to get a specific job done, but it’s not part of their daily routine.
- Dormant Users: Anyone who hasn't logged in for over 30 days. These accounts are a major churn risk.
Benefits Sought
Why did someone sign up in the first place? Segmentation by "benefits sought" groups users based on the specific outcome they're chasing. It’s a subtle but crucial concept: two different customers might use the exact same feature for completely different reasons.
Take a project management tool, for instance. You could easily have these benefit-focused segments all working in the same software:
- Collaboration Maximizers: They live in the features that bring people together—team chats, shared dashboards, and comment threads.
- Productivity Hackers: This group is all about personal efficiency. They’re obsessed with time-tracking, deadline reminders, and their own task lists.
- Reporting Specialists: They spend almost all their time in the analytics and reporting modules, pulling data to track project health for stakeholders.
Customer Journey Stage
Finally, you need to consider where a user is in their relationship with you. A brand-new trial user has wildly different needs and behaviours than a loyal customer who's been with you for five years.
Segmenting by journey stage helps you deliver the right message at exactly the right moment, guiding people from one phase to the next without friction. The key stages usually look something like this:
- Awareness: New visitors just learning that your solution exists.
- Acquisition: Users who just took the first step, like signing up for a trial or a freemium plan.
- Adoption: Activated users who are getting into a rhythm and engaging with core features regularly.
- Retention: Your long-term, loyal customers who see the value month after month.
- Advocacy: The evangelists. They love your product so much they tell everyone they know about it.
How to Decode Key User Behaviours
Your users are constantly telling you what they need through their actions—you just have to learn how to listen. Moving from theory to practice means zeroing in on the specific signals that predict churn, highlight deep engagement, and uncover those hidden growth opportunities.
It all starts by blending two types of data: quantitative and qualitative. One tells you what is happening inside your product, while the other explains why.
Unpacking Quantitative Signals
Quantitative signals are the hard numbers—the measurable actions you can track with product analytics. They give you a clear, objective look at user health and how deeply people are engaging with your platform. While you could track dozens of metrics, a few are especially powerful for understanding behavior.
- Feature Adoption Rate: This tells you which features are becoming indispensable to your users' daily work. A low adoption rate for a new feature might mean your onboarding is missing the mark or, worse, that users don't see its value.
- Session Duration and Frequency: Are people logging in every day for quick, focused tasks, or are they settling in for longer, deep-dive sessions once a week? This pattern tells you exactly how your product fits into their lives and workflows.
- Time to Value (TTV): How fast does a new user get to that "aha!" moment where they truly get what your product can do for them? A shorter TTV is one of the strongest predictors of long-term retention. To learn more, check out our guide on how to track app usage.
- User Action Sequences: Start looking for the common paths your best users take. Do most of your power users always use Feature A right after Feature B? This uncovers valuable workflows you can start promoting to everyone else.
A great practical example is usage rate segmentation. You can group customers into heavy, medium, or light users based on how often they interact with your product. For instance, by analyzing support chats and issue tickets, you might find that light users who drop below three sessions a week have a 35% churn risk. Setting up real-time alerts for this drop-off has been shown to cut that attrition by 20%.
Diving into Qualitative Clues
Numbers tell a crucial part of the story, but qualitative data adds the rich context you need for the complete picture. This is the human element, the feedback hidden in plain sight across all your customer-facing channels.
Qualitative signals are the difference between knowing a user is at risk of churning and understanding the exact frustration that's pushing them away. It’s where you find the actionable "why" behind the data.
When you're trying to decode user behaviors from interviews or feedback calls, transcribing the audio is a game-changer. Using a specialized audio to text transcription software makes it much easier to pull out key themes and insights from those conversations.
Keep an eye out for patterns in places like:
- Support Tickets: Are several of your enterprise accounts suddenly flagging the same bug? That’s not just a technical glitch; it's a major revenue risk.
- Sales Call Notes: Listen to your sales team. What objections or feature requests keep coming up during demos with your ideal customers? That's your market talking directly to you.
- Live Chat Transcripts: Pay close attention to the language people use. Words like "confusing," "frustrating," or "I can't find" are direct signals of friction in the user experience that need to be addressed.
By weaving these quantitative metrics and qualitative clues together, you can finally stop guessing and start truly understanding. You build a 360-degree view of user behavior that directly informs your product roadmap, helps you get ahead of churn, and opens up entirely new ways to grow.
Putting Behavioural Segmentation into Practice
Okay, so we know what behavioural segmentation is. But how do you actually do it? Moving from theory to a real-world strategy can feel like a huge leap, but it really just boils down to a clear, repeatable process.
The goal is to build a system where you can gather behavioural data, spot meaningful patterns, and then turn those insights into confident decisions. It’s about making user actions directly inform your next move, whether that's for the product roadmap or a sales conversation.
You need to shift from just collecting data to using it to answer critical business questions. What specific actions signal a user is ripe for an upgrade? What behaviours are the canaries in the coal mine for customer churn? A structured approach is the only way to find these answers reliably.
This simple, three-step process is a great way to visualize how you can start decoding user behaviour.
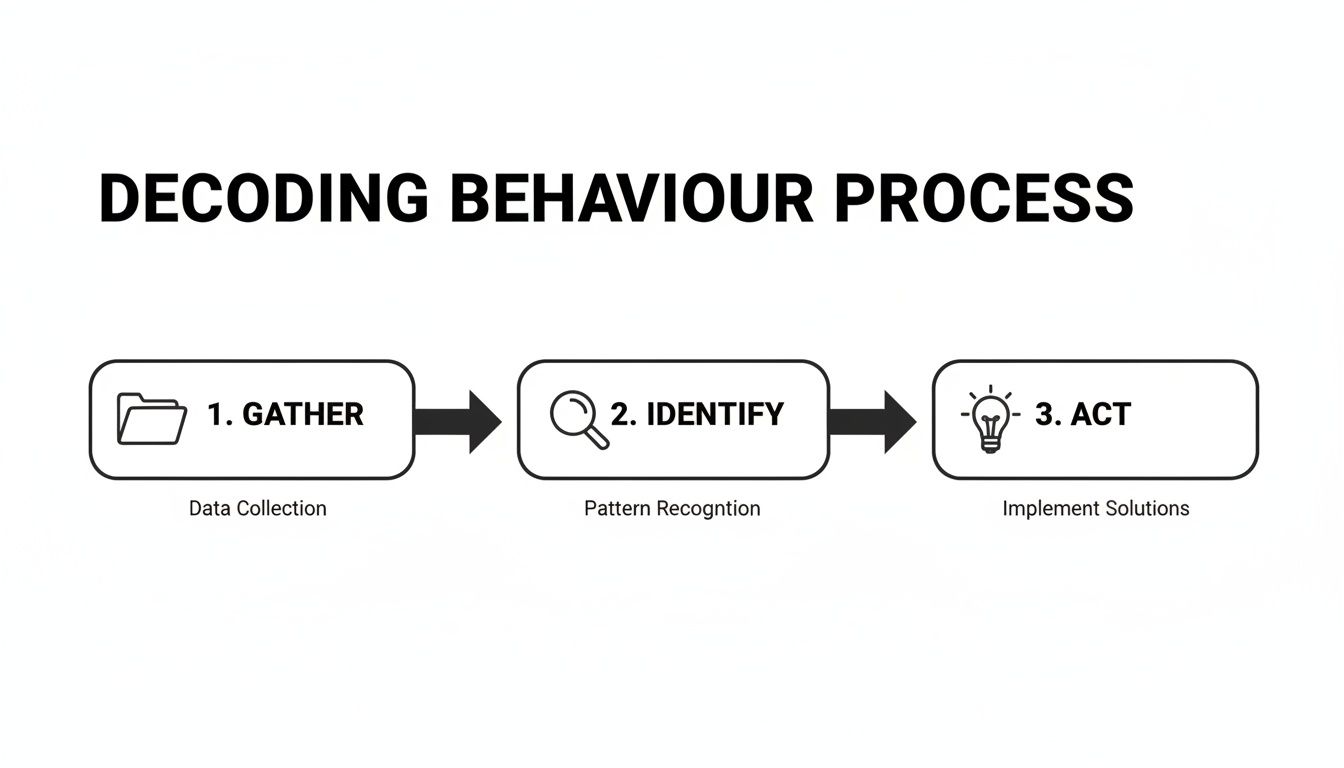
This isn’t a one-and-done project. Think of it as a continuous loop: gather, identify, and act. You’re constantly learning from your users to improve their experience and hit your goals.
Step 1: Connect Your Data Sources
First things first: you need a unified view of your customer. Right now, your user data is probably scattered everywhere—in product analytics tools, your CRM, support ticket software, and maybe even in sales reps' call notes. The first job is to pull all of it together into a single source of truth.
When you connect these systems, you start to see the whole story. You can finally link a user's high feature adoption (from your analytics) with their recent string of support tickets (from the help desk) and see that they’re a power user who’s just frustrated by a bug.
This holistic view is everything. Without it, you're just guessing and making decisions based on incomplete intel—a classic mistake that can cost you.
Step 2: Define Your First Segments
Once your data is flowing into one place, it's time to define your initial segments. Don't try to boil the ocean here. Just start with two or three high-impact groups that tie directly to your biggest priorities, like slashing churn or boosting expansion revenue.
Start by asking sharp, goal-oriented questions:
- For Retention: Which paying customers have stopped using a sticky feature in the last 30 days? This gives you an "At-Risk" segment.
- For Upsell: Who has bumped up against their plan's usage limits three times this month? That’s your "Ready to Upgrade" segment.
- For Onboarding: Which trial users haven’t completed the core setup workflow within their first three days? This creates a "Needs a Nudge" segment.
The real key is to make every segment specific, measurable, and actionable. A vague segment like "Inactive Users" is almost useless. A precise one like "Paid Users Who Haven't Logged in for 14 Days" gives your team a clear target to work with.
Each of these segments gives your teams a clear mission. Customer Success can jump on that "At-Risk" list, while Marketing can build a targeted campaign for the "Ready to Upgrade" folks.
Step 3: Activate Your Insights
This is where the magic happens. Insights are worthless if they just sit in a dashboard; you have to turn your analysis into action. Activation means using your segments to personalize the user experience at scale.
This is where automation becomes your best friend. Modern tools, like a product intelligence platform, can monitor these segments in real-time. It creates a powerful feedback loop where specific user behaviours automatically trigger the right response.
Here's how that looks in practice:
- Product: If a segment of high-value customers keeps hitting the same bug, that issue can be automatically flagged and bumped up in the development backlog.
- Marketing: When a group of users fully adopts a new feature, they can get an automated email walking them through advanced tips and tricks they might not know about.
- Success: The moment a key account enters your "At-Risk" segment, an alert can go straight to their account manager to schedule a check-in call.
This kind of automated, action-oriented approach is what turns segmentation from a data exercise into a growth engine. You're making user behaviour your most valuable asset.
How Product Intelligence Platforms Unlock Deeper Insights
Trying to build behavioural segments by hand feels like searching for a needle in a digital haystack. You've got product usage data in one system, support tickets in another, and sales call notes buried somewhere else entirely. This scattered approach almost guarantees you'll be making reactive decisions based on a partial picture.
This is exactly where a dedicated product intelligence platform changes everything. Think of it as a central nervous system for all your customer data. It transforms your approach to the definition of behavioural segmentation from a manual, time-consuming chore into a proactive strategy for growth. These platforms don't just dump data in one place; they automatically connect the dots for you.
So, instead of your team burning weeks trying to figure out why a drop in feature usage lines up with a spike in support tickets, the platform surfaces that connection for you. It takes all that messy, unstructured feedback and turns it into clear, quantifiable insights.
Unify Qualitative and Quantitative Data
The real magic of these platforms is their ability to fuse two very different kinds of data. They take the clean, hard numbers from your product analytics—things like session duration and feature adoption rates—and seamlessly merge them with the messy, human context you find in qualitative feedback.
This unified view gives you a level of clarity that neither data type could ever provide on its own.
- Quantitative Metrics: This is the "what" and "how many." For example, it can tell you that 15% of your user base suddenly stopped using a key feature last month.
- Qualitative Feedback: This uncovers the crucial "why." By analyzing support chats and call transcripts, it might reveal that those same 15% of users are all running into the exact same frustrating bug.
This combination allows you to stop just observing what users are doing and start truly understanding the motivations and frustrations behind their actions.
Surface Revenue-Impacting Patterns with AI
Modern platforms use AI to constantly scan all this unified data, actively looking for patterns that directly affect your bottom line. It’s like having a data scientist on your team working 24/7 to pinpoint your biggest risks and opportunities. This goes far beyond basic analytics and into the realm of predictive intelligence.
A product intelligence platform can automatically flag that three of your enterprise accounts, which are collectively worth $250,000 in ARR, have all submitted support tickets about the same broken integration. This insight lets your team jump on a fix before those high-value customers even begin to consider churning.
This is the core value proposition: putting a real dollar amount on user problems and feature requests. Instead of relying on gut feelings to build your roadmap, you can make decisions based on hard data that shows which bug fixes will prevent the most churn and which new features will help close the biggest deals. You can learn more about these systems in our guide to customer insights platforms.
When you supercharge your segmentation strategy with product intelligence, you finally get ahead of problems instead of just reacting to them. You can make confident, data-backed decisions that actively protect and grow your revenue.
Turning Insights Into Action: Practical Next Steps
All this data is great, but insights without action are just trivia. If you want your behavioural segmentation strategy to actually move the needle on revenue and retention, you need a plan.
It’s tempting to jump in and create a dozen different segments right away. Resist that urge. Start small with just two or three groups that are directly tied to a core business goal, like reducing churn or increasing adoption of a key feature. This keeps things manageable and lets you learn and iterate much faster.
Set a Clear Goal for Every Segment
Each segment needs a job to do. Attaching a specific, measurable goal to every group you create is what turns analysis into a concrete action plan for your product and revenue teams.
Here’s what that looks like in practice:
- For an "At-Risk Churn" segment: The goal isn't just to "engage" them. It’s to reduce their churn rate by 15% this quarter through targeted in-app guides and proactive success outreach.
- For a "Power User" segment: The objective could be to drive a 10% upsell conversion rate by offering them an exclusive beta of a new premium feature.
See the difference? Specificity is key.
Your Segments Are Alive—Treat Them That Way
Customer behaviour is always in flux, so your segments can't be a "set it and forget it" exercise. They are living, breathing definitions that need to be revisited and refined over time. What defines a power user today might change in six months as your product evolves. Check in regularly to make sure your segments are still relevant and aligned with what’s happening in your business.
True success here hinges on getting everyone on the same page. When the product, marketing, and customer success teams are all working from the same behavioural playbook, you create a seamless experience for the user. That shared understanding is what drives both retention and real, sustainable growth.
Frequently Asked Questions
Once you get the hang of what behavioural segmentation is, the next step is figuring out how to actually put it to work. Here are some of the most common questions we hear from SaaS teams as they get started.
How Is This Different from Market Segmentation?
Think of it like this: market segmentation is the wide-angle shot, while behavioural segmentation is the close-up.
Market segmentation is great for painting a broad picture. It groups potential customers by static, demographic-style traits—their industry, company size, or geographic location. It helps you answer the question, “Who could we sell to?”
On the other hand, behavioural segmentation is all about action. It’s dynamic and tells you what people are actually doing inside your product right now. Instead of who they are, it answers, “What are they doing?” This is how you spot your power users, identify customers who are about to churn, or find those who are practically begging for an upgrade. It’s a much sharper, more immediate picture of reality.
What Tools Do I Need to Get Started?
You don't have to boil the ocean on day one. A good product analytics tool is the perfect starting point, as it lets you begin tracking what users are doing. As you get more sophisticated, you’ll want to pull in data from your CRM and customer support systems to build a more complete profile.
But if you want to find the real, revenue-driving insights without spending all your time crunching data, you'll need a proper product intelligence platform. These tools are built to connect all those scattered data sources, then use AI to automatically find the critical behavioural patterns you would otherwise miss.
How Often Should We Update Our Segments?
The one thing you can count on is that customer behaviour will change. So your segments can't be a "set it and forget it" project.
A quarterly review is a solid starting point for most SaaS companies. It’s frequent enough to catch important shifts in how people use your product without causing you to chase every tiny, short-term blip.
That said, some segments need constant attention. For crucial things like identifying churn risks or spotting expansion opportunities, you need real-time monitoring. This is where automation is a game-changer—it can flag an account the moment its behaviour changes, so your team can step in immediately.
By turning raw behavioural data into a clear roadmap, SigOS helps you identify the exact bugs costing you money and the feature requests that will drive your next big win. See how our product intelligence platform can sharpen your strategy.
Keep Reading
More insights from our blog


Ready to find your hidden revenue leaks?
Start analyzing your customer feedback and discover insights that drive revenue.
Start Free Trial →