From Qualitative to Quantitative: A Product Team Guide
Learn how to turn qualitative to quantitative data with our step-by-step guide. Build taxonomies, validate scores, and integrate workflows for insights.

You can feel the gap before anyone names it. Support is sending over tickets, sales is forwarding feature requests from late-stage accounts, and interview notes are full of frustration, workarounds, and edge cases. The problem isn't that your team lacks feedback, it's that the feedback still lives as stories when leadership needs numbers.
That's why qualitative to quantitative conversion is usually the bottleneck. Teams don't stall because they need another dashboard or another tagging tool. They stall because they haven't defined a defensible way to turn messy language into metrics that people can trust, compare, and act on. The history of measurement makes this point clearly, from Graunt's 1662 Bills of Mortality analysis that turned recurring death records into population patterns, to modern product teams trying to do the same thing with customer narratives (ABS on quantitative and qualitative data). If events can be counted consistently, they can be turned into rates, proportions, and forecasts.
That sounds straightforward, but the hard part isn't counting. It's deciding what counts, how it gets labeled, and when the numbers are honest enough to use. The teams that get this right don't just tag feedback faster. They build a measurement system that maps customer language to revenue impact, validates agreement between coders, and checks whether the final scores predict churn, expansion, or revenue movement.
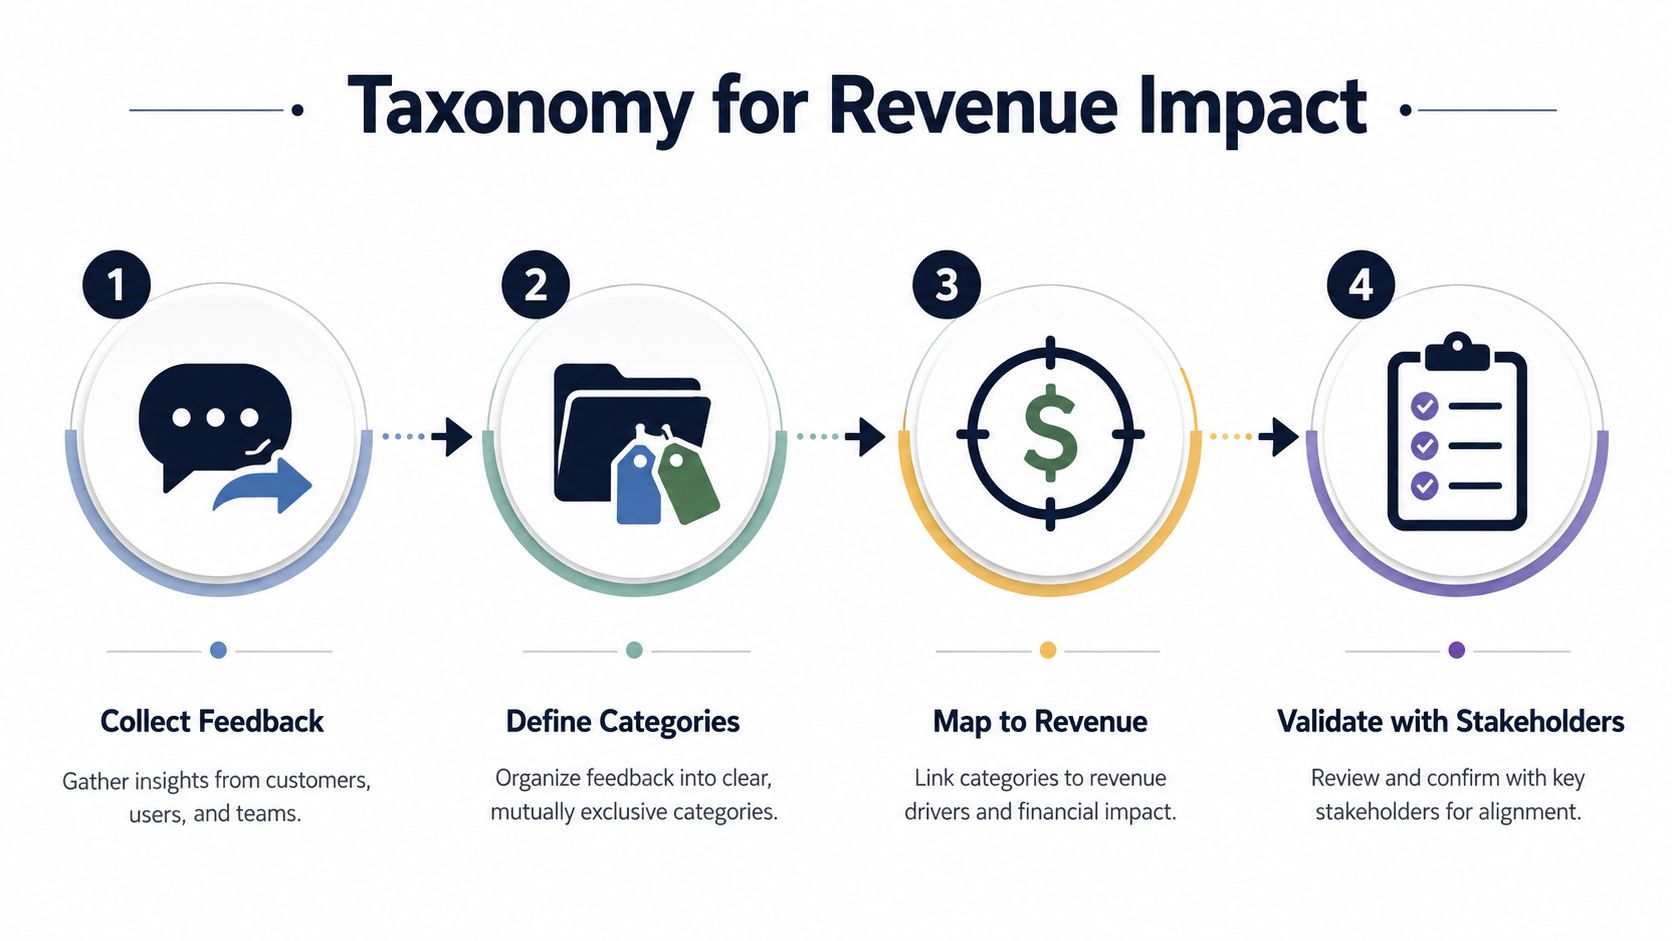
Designing a Taxonomy That Maps to Revenue Impact
A taxonomy is just a structured set of categories and subcategories, but in practice it decides whether your whole system is useful or decorative. If your labels don't connect to an outcome the business already cares about, the numbers you produce will feel tidy and still be meaningless. The cleanest way to start is backwards, from the decision you want to make.
Start from the outcome, not the inbox
List the business outcomes first. Churn reduction, expansion revenue, activation, support cost, and workflow adoption are the usual suspects. Then ask what kinds of feedback reliably point toward each outcome. A broken checkout flow isn't just “a bug,” it's revenue at risk. A request for CSV export isn't just “a feature idea,” it may be retention pressure from teams trying to operationalize your product.
That reverse mapping matters because it forces specificity. A category like billing friction is better than a vague bucket like payment issue if your finance or revops team tracks failed renewals and plan changes. A category like onboarding confusion is useful only if your organization can tie it to activation or time-to-value. If you can't name the downstream metric, the category is probably too fluffy to support prioritization.
Practical rule: if a label can't plausibly move a roadmap or a revenue conversation, it doesn't deserve top-level status.
Keep the structure lean. A three-level taxonomy often works better than a sprawling one. Use a small number of top-level categories, then add subcategories that reflect the ways customers describe the problem. If your support team and product team can't agree on the category boundaries after a short review, the taxonomy is probably trying to be too clever.
Treat category design like a measurement decision
The technical literature is blunt about the risk that teams ignore first, unitization. In the qualitative-to-quantitative workflow, you move from data sourcing and transcription to unitization, category construction, coding, and aggregation. If the unit of analysis is defined inconsistently, later frequency or correlation results can get distorted (Srnka and Koeszegi's workflow discussion). That means your taxonomy is only as good as the slice of language you decide to count.
A product example makes the trade-off obvious. If you split one customer complaint into three units because it contains three sentences, you may inflate noise. If you treat a ten-minute sales call as one unit, you may flatten meaningful variation. The right answer depends on the decision you're trying to support, but the rule doesn't change, define the unit before you start counting.
For teams working from interviews or long-form notes, transcription workflow matters too. A clean transcript doesn't solve the methodology problem, but it does reduce ambiguity before coding starts. If you need a practical refresher on that part of the pipeline, the modern interview transcription workflow guide is a useful reference point for turning spoken conversations into text that's easier to segment and tag.
The best taxonomy is the one your team can defend in a review meeting. That's why stakeholder validation should happen early, not after you've already coded hundreds of tickets. Product, support, and success usually notice different failure modes. If the taxonomy survives that cross-functional review, you've got a real foundation instead of a label library.
Tagging and Coding Feedback With Context Intact
Tagging is where many teams accidentally throw away the value they were trying to capture. A support ticket, a chat transcript, and a sales call all contain signals, but those signals don't behave like neat survey answers. They're layered, contextual, and often messy. The goal is to structure them without stripping out the clues that explain why they matter.

Automation handles volume, humans handle nuance
Automated tagging is useful when the inbox is large and the patterns are repetitive. It can surface recurring phrases, obvious categories, and high-volume themes quickly. Human coding is slower, but it catches sarcasm, mixed intent, and the customer who says they want a feature when the problem is documentation or onboarding.
The most reliable workflow is hybrid. Let automation do the first pass, then have humans review a representative sample and any edge cases that matter to the business. That's especially important when the feedback source itself is noisy, like long interviews or mixed-topic sales calls. If you're still working through how to make those conversations easier to analyze, a qualitative data analysis overview can help anchor the difference between raw text and analyzable themes.
Coding is also where consistency beats speed. A fast team that disagrees on labels creates a slick-looking dataset with weak foundations. A slower team that codes the same material the same way creates something you can trust.
Two coders don't need to be perfect. They need to be predictable enough that disagreements can be fixed before they become metrics.
Use an intensity scale that keeps context visible
A simple 1-to-5 scale usually works better than a binary yes-or-no tag. One might mean a minor suggestion. Five should mean a blocking issue with clear business impact. That doesn't mean every category needs the same interpretation, but the scale itself needs to feel stable across coders.
Calibration sessions matter. Have two people code the same sample, compare the differences, and talk through the disagreements. The point isn't to eliminate judgment. The point is to make judgment explicit and repeatable. If the same ticket gets scored differently every week, the system is drifting even if the dashboard looks clean.
If you're transcribing interviews or long calls before tagging them, the handoff into coding should be deliberate. The transcript needs enough context to preserve the customer's intent, but not so much noise that coders start improvising. Tools can help with that workflow, but the process design is what keeps the data honest.
For teams that want a structured starting point, product intelligence platforms like SigOS ingest support tickets, chat transcripts, sales calls, and usage metrics, then connect those inputs to patterns that product teams can score and route. That kind of setup only works, though, if the underlying coding rules are clear enough for humans to trust them.
The takeaway is simple. Tagging is not just a labeling task. It's a measurement step, and every shortcut you take here shows up later as weak prioritization.
The method literature backs up the caution here. A published mixed-methods conversion design used two independent coders and a standardized intensity scale, then checked the resulting variables with descriptive statistics and Cronbach's alpha before interpreting them (conversion design and reliability checking). That's the right instinct. Reliability comes before confidence, not after.
Scoring, Weighting, and Statistical Validation
Once feedback is coded, frequency alone stops being enough. Teams often make the mistake of treating every mention as equally important, which is tidy and wrong. A complaint from a high-value account can matter more than the same complaint from a low-fit segment, and a rare issue tied to churn risk can matter more than a popular but low-impact request.
Build weights from business reality
Start with base scores tied to outcome relevance. If a category has historically been associated with churn pressure, revenue loss, or expansion friction, it should not sit at the same level as a cosmetic annoyance. Then layer in account-level modifiers. Contract value, usage intensity, customer tier, and lifecycle stage all change how much a signal should matter.
A 1-to-5 scoring model works well when teams need something people can understand quickly. A score of 1 might be a minor annoyance with no obvious business consequence. A 5 should mean a blocking issue with obvious revenue or retention implications. The important part is not the numeric elegance, it's whether the score reflects how your business makes money.
Practical rule: if your scorecard can't explain why one issue outranks another without a committee debate, the weighting is too shallow.
The point of weighting is to move from “we saw this a lot” to “this is what deserves attention first.” Frequency-based metrics are useful for spotting volume, but impact-weighted metrics are what keep teams from overreacting to loud, low-value noise.
Validate before you trust the score
The mixed-methods literature is clear that reliability checking is essential before interpretation. One practical benchmark is to use two independent coders and a standardized intensity scale, then review internal consistency with descriptive statistics and Cronbach's alpha (annotation agreement explained). The conversion study in the earlier section used a 1–5 scoring scheme, which is a reasonable pattern when you need a stable scale rather than a vague label.
Descriptive statistics matter too. Look for strange spikes, categories with near-zero variance, and clusters that don't make business sense. Those are often signs that your taxonomy is collapsing distinctions or that coders are overusing a safe label. If the data looks clean but the patterns feel too neat, that's usually a warning sign, not a victory lap.
Retrospective validation is the ultimate test. Correlate your aggregated scores with known outcomes over a prior period. If a churn-risk score doesn't line up with actual churn, the problem may be the taxonomy, the weighting model, or the assumption that the signal matters at all. No amount of dashboard polish can rescue a broken measurement model.
For teams that want a tighter statistical discipline, the most useful mindset is to treat the score as a hypothesis. The score is not the truth. It's a structured guess about where attention should go, and it should earn trust by matching what happened later. If you want a broader refresher on testing those hypotheses cleanly, the internal guide on how to do hypothesis testing fits naturally into this part of the workflow.
The unglamorous truth is that validation is where most qualitative to quantitative efforts become credible or collapse. If the agreement is weak, revise the rules. If the predictive link is weak, revise the taxonomy. If both are weak, stop pretending the score means more than it does.
Integrating Quantified Feedback Into Product Workflows
A quantified feedback system only changes decisions when it sits inside the tools your teams already use. A spreadsheet that nobody opens is just expensive archaeology. Integration means the score shows up where product managers, support leads, and engineers already work, then triggers the next step automatically.
Route signals into the tools people already trust
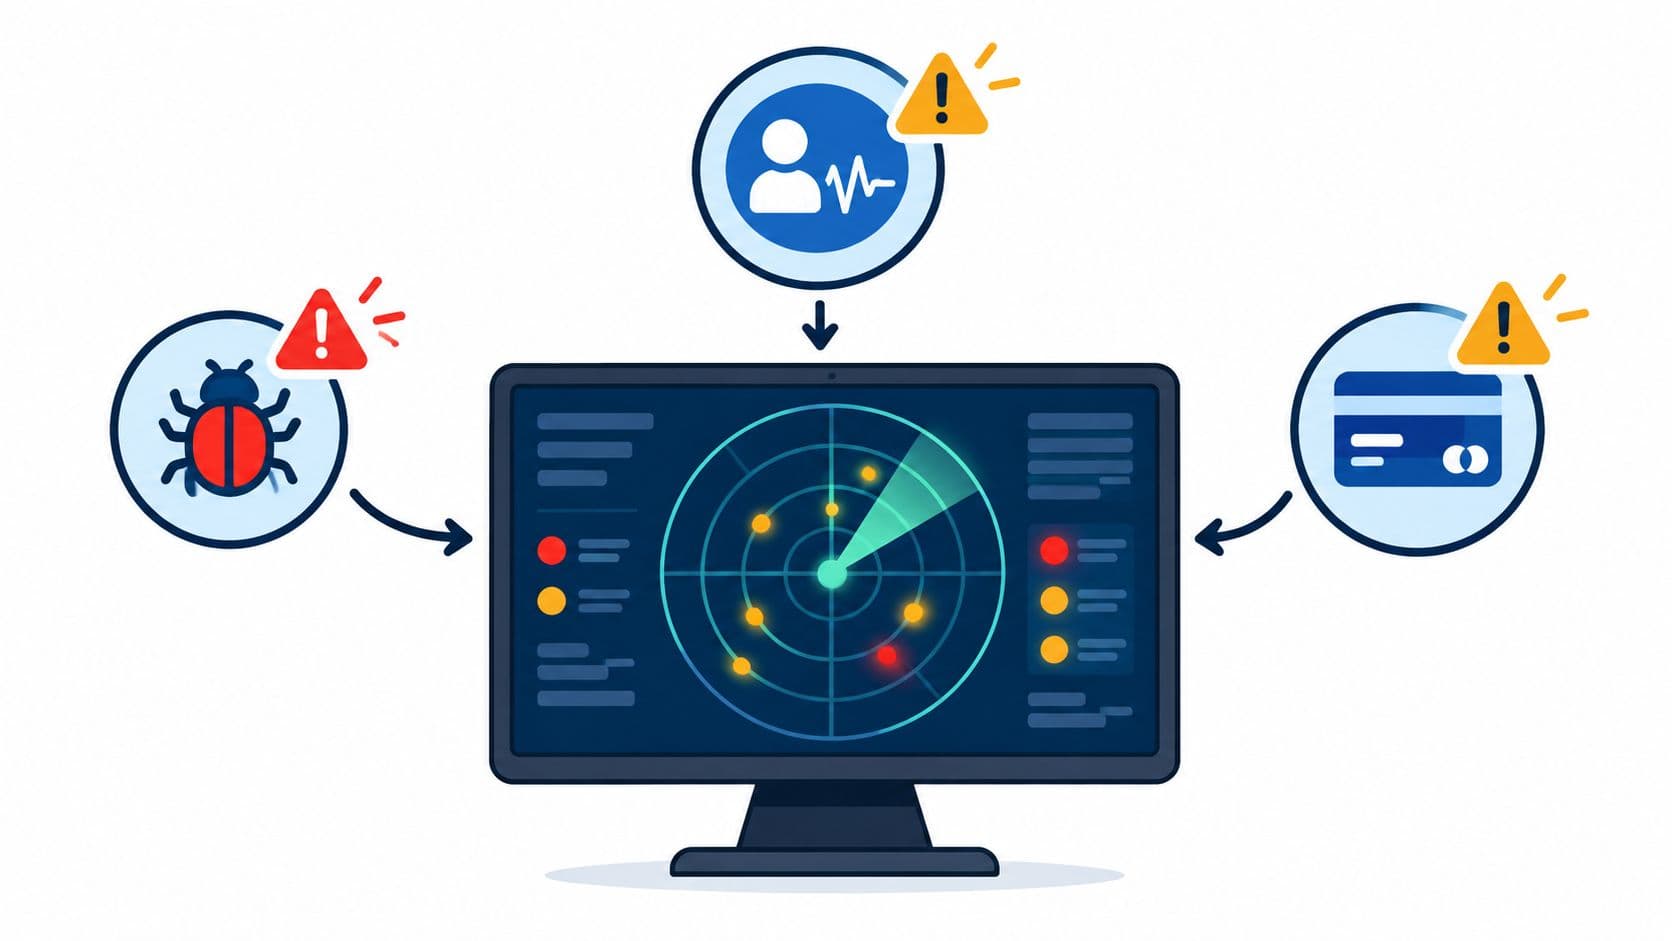
Start with a central dashboard that highlights the highest-impact issues first. The view should show revenue-risk bugs, feature requests that appear across multiple valuable accounts, and emerging churn patterns without requiring a manual query. That's the point where raw feedback becomes a daily operating signal instead of a quarterly cleanup project.
Then connect that dashboard to workflow systems. A blocking bug with enterprise revenue at risk should create the right issue in Jira or Linear, and it should notify the person who owns the queue. A repeated feature request from several strategic accounts should surface in roadmap review before someone has to ask for it. Automation should handle the routing, but humans still need to own judgment calls when the signal is ambiguous.
You don't want every tag to become an alert. Set thresholds for automatic escalation, and keep lower-confidence items in a review queue. Otherwise, the team ends up with alert fatigue and starts ignoring the very signals you worked so hard to quantify.
Keep the loop closed
The best workflows don't stop at creation. They track whether the issue got resolved, whether the customer changed behavior, and whether the business outcome moved. That feedback loop is what turns a scoring model into an operating system.
A quantified signal is only useful if someone can trace it from customer complaint to decision to outcome.
That's where practical discovery habits help. Product teams that already do regular discovery interviews, support review, and roadmap validation have an easier time adopting quantified feedback because the habit of listening already exists. A good companion read is practical discovery techniques, especially if your team wants to tighten the connection between research, prioritization, and follow-through.
The core trade-off is simple. Automation gives you speed, but governance gives you trust. The teams that get this right don't try to eliminate human judgment. They make judgment easier by surfacing the right signals in the right place, at the right time.
KPIs and Templates for Product Teams
A good qualitative to quantitative system needs its own scorecard. Without explicit KPIs, teams fall back into anecdotes and one-off priority debates. The goal is to measure whether the conversion process itself is working, not just whether the output looks organized.
Track the right operational signals
The most useful KPI is signal density per channel. Support, interviews, sales calls, and in-app feedback don't produce the same kind of insight, and you need to know which sources are worth your team's attention. If one channel consistently produces stronger themes, that tells you where to invest listening effort.
Another useful measure is weighted issue impact score, which combines frequency, severity, and account value into one priority number. That gives product and support a common language when they're comparing competing requests. It also cuts down on the committee behavior that happens when every stakeholder argues from their own anecdote.
A third KPI is validation rate, meaning how often the top-scoring items later correlate with outcome movement. If your highest priorities don't map to churn, expansion, or another relevant business change, the system needs recalibration. The point is not to prove every issue matters. The point is to prove your scoring model sorts the meaningful ones from the rest.
Time-to-insight is the last one I'd treat as essential. If feedback takes too long to move from raw text to scored priority, the signal goes stale. Product teams make better decisions on fresh evidence than on month-old complaints that have already shaped customer behavior in ways you can't unwind.
Use a review template that keeps the conversation grounded
A simple weekly product review can carry these metrics without feeling bureaucratic. Put the highest weighted issues at the top. Show the channel source, the category, the score, and the downstream outcome you expect. Then ask one question every time, does this signal look strong enough to move a roadmap or escalation decision?
For teams still building their reporting rhythm, an internal KPI report template can help standardize the view so the numbers don't get reinterpreted every week. That kind of consistency matters because the value of the system comes from repeatable decisions, not prettier charts.
If your team is still deciding how to sharpen discovery inputs before scoring them, keep the methodology tight. The methods literature says the qualitative-quantitative divide persists when translation rules are under-specified, not because one side is weaker (bridging the divide between qualitative and quantitative methods). That's exactly why KPI discipline matters. It exposes whether your translation rules are stable enough to trust.
A final practical point. These KPIs are useful only if they're reviewed on a schedule that matches the speed of customer change. Monthly for intake balance, weekly for backlog prioritization, and quarterly for validation is a healthy rhythm for most product teams. The cadence matters because unreviewed metrics turn into decorative reporting very quickly.
Conclusion
Turning qualitative feedback into quantitative metrics isn't a reporting trick. It's a discipline built on design choices, coding discipline, weighting logic, and ongoing validation. The teams that succeed don't rush to the dashboard. They start with a taxonomy tied to business outcomes, define units carefully, and make sure two people can score the same feedback in a similar way.
The biggest mistake is false precision. A clean number can still hide a weak model if the categories are vague or the scoring rules drift. That's why the best product teams keep the qualitative context nearby even after they've quantified it. The score helps them prioritize. The original language helps them understand what to do next.
That balance matters because numbers are powerful, but they're still abstractions. They make patterns visible and decisions defensible, yet they don't capture the full texture of a customer's frustration or the details of the workflow that's breaking. Quantification should sharpen judgment, not replace it.
Use the metrics to rank the noise. Use the conversations to confirm the pattern. When those two stay connected, product teams stop arguing from anecdotes and start deciding from evidence.
If you're building this kind of feedback-to-metrics workflow, SigOS can help by ingesting support tickets, chat transcripts, sales calls, and product usage data, then surfacing the issues most likely to affect churn, expansion, and revenue. Visit SigOS if you want a system that quantifies customer feedback and routes the highest-impact signals into the tools your team already uses.

Ready to find your hidden revenue leaks?
Start analyzing your customer feedback and discover insights that drive revenue.
Start Free Trial →