Impact Assessment Methodology: A Revenue-First Guide
Learn a practical impact assessment methodology to quantify the revenue and customer impact of bugs and features. Prioritize work that grows your business.

Your week probably looks like this.
Support exports a CSV from Zendesk. Sales drops Gong snippets into Slack. Customer success adds renewal risk notes in Salesforce. Product gets a pile of Linear tickets, each tagged “urgent” by someone with a good reason. Then leadership asks the question that exposes the whole system: which of these items matters most to revenue?
Answering that question still relies on taste, politics, and volume. The loudest account wins. The newest enterprise prospect wins. The issue with the most thumbs-up wins. None of those are useless signals, but none of them is an impact assessment methodology.
The problem isn't that you have too much feedback. It's that your company hasn't built a durable bridge between what customers say and what the business earns, retains, or loses because of it. Until that bridge exists, prioritization turns into a debate club disguised as strategy.
Escaping the Feedback Whirlpool
The feedback whirlpool starts innocently. A support lead says a bug is hurting satisfaction. A sales rep says a missing integration is blocking deals. A product manager sees low adoption on a feature that took months to ship. Everyone is right from where they sit.
But right in isolation isn't enough.
What breaks teams isn't the number of requests. It's the absence of a common unit of value. If one issue arrives as an angry ticket, another as a stalled deal, and a third as a usage drop in Mixpanel, you need a way to compare them without flattening them into “high, medium, low.” That shorthand is fast, but it strips out the only thing leadership needs to know: what's the business consequence if we act, delay, or ignore?
Why generic prioritization falls short
Frameworks like RICE and ICE can be useful for rough ordering. They help when you're comparing ideas inside a product team that already agrees on the objective. They break down when feedback comes from different systems, different functions, and different kinds of customer behavior.
A support ticket and a six-figure procurement blocker don't belong in the same queue unless you've translated both into a comparable impact model. That's the operational version of impact assessment methodology. You're not evaluating abstract “importance.” You're evaluating economic consequence.
Practical rule: If a request can't be tied to a customer outcome or a revenue outcome, it doesn't belong at the top of the roadmap yet.
Classic impact assessment thinking holds surprising relevance. In formal assessment work, the method chosen depends on the decision being informed, the available budget and data, and the ethical constraints of the context, as described in SoPact's overview of impact evaluation methods. Product teams should apply the same discipline. The method has to match the claim.
If you're deciding whether to fix a billing bug this sprint, you don't need a grand theory. You need enough evidence to estimate downside risk. If you're deciding whether to invest two quarters in a major platform capability, you need a stronger chain between feedback, usage behavior, and commercial outcome.
What actually changes the conversation
The shift happens when teams stop asking, “How many people asked for this?” and start asking:
- Who is affected? A free user, a strategic account, or a renewal cohort.
- What kind of impact is this? Churn risk, expansion potential, implementation friction, support cost, or deal blockage.
- How often does it occur? Isolated edge case or repeated pattern.
- How severe is the business consequence? Mild annoyance or account-level risk.
That sounds simple. It isn't easy. But once you build it, roadmap conversations get cleaner. Support stops arguing from anecdotes. Sales stops escalating every custom ask. Product stops guessing which pain is merely noisy and which pain is quietly expensive.
Defining Objectives and Core Impact KPIs
Most impact models fail before scoring begins. The failure happens at the objective level. Teams say they want to “improve the product” or “listen to customers more closely,” then wonder why the resulting backlog is chaotic.
A working impact assessment methodology starts with a narrower question: what kind of business result are you trying to influence right now?
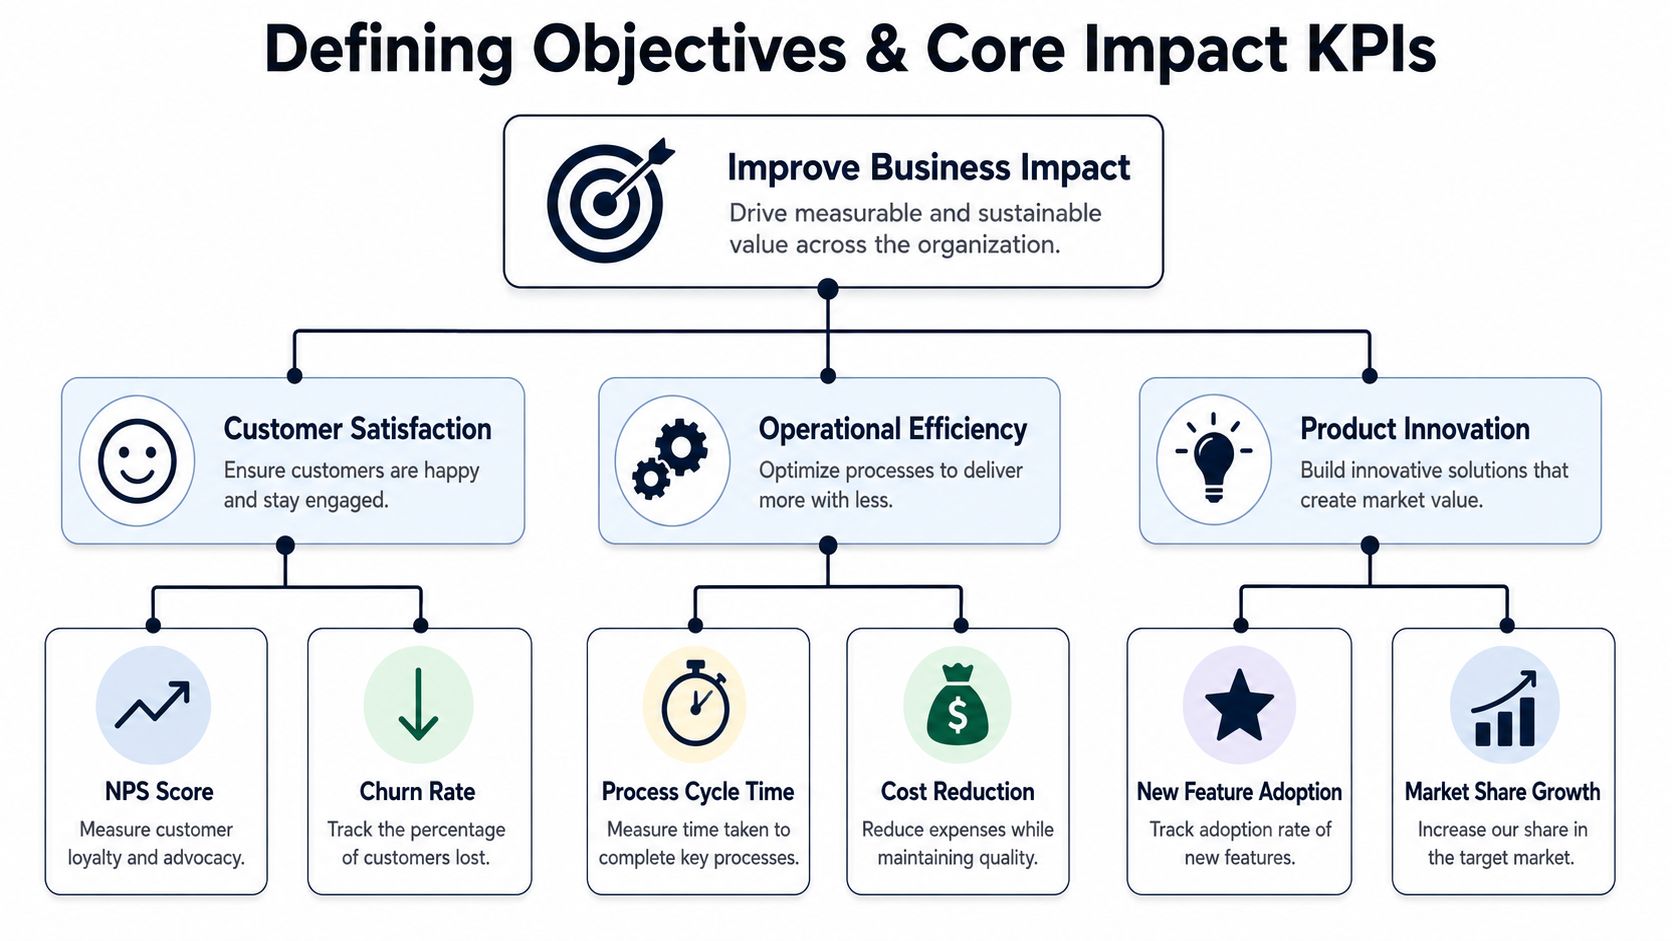
Start from the business decision
You need one primary objective per planning cycle. Not ten. One.
For a SaaS team, that objective is usually one of these:
- Protect retention when churn risk is rising in a segment
- Achieve expansion when existing customers want broader adoption
- Increase new business conversion when deals stall for repeat reasons
- Reduce delivery drag when support load and engineering interruptions are slowing output
That objective becomes your filter. It decides which KPIs matter and which are just interesting.
The diagram above is useful as a general KPI hierarchy, but product and growth teams need a more commercial interpretation. “Customer satisfaction” only matters if you can connect it to retention, expansion, or sales velocity. “Product innovation” only matters if the shipped capability creates measurable adoption or commercial advantage.
For teams tightening execution, this is also where engineering metrics belong. If you're working on improving development workflows with metrics, include delivery signals in the same operating model so product impact and engineering throughput don't live in separate worlds.
Separate customer impact from revenue impact
These are related. They are not identical.
Customer impact KPIs tell you how much pain, friction, or demand exists. Revenue impact KPIs tell you what that pain or demand is worth to the business.
A practical starting set looks like this:
- Affected users measures reach. How many distinct accounts, seats, or users show the same issue?
- Customer segment value tells you whether the affected group sits in SMB, mid-market, enterprise, or a strategic vertical.
- Sentiment velocity tracks whether the topic is accelerating. A stable complaint is different from a rapidly spreading one.
- ARR at risk estimates renewal exposure tied to the issue.
- Expansion opportunity value captures upside if the issue is resolved.
- Deal-blocker frequency tracks how often a request appears in active sales cycles.
Here's the trap to avoid. Don't let every KPI become first-class. A crowded scorecard makes teams feel analytical while removing clarity.
The best KPI set is small enough that product, sales, support, and finance can all explain it the same way.
A simple reporting template helps. If your team needs a starting point for KPI governance, this key performance indicator report template is the kind of artifact that keeps definitions from drifting across departments.
A short explainer can also help anchor the team before you formalize the model:
Pick KPIs that survive scrutiny
A good KPI can withstand three questions.
- Can someone collect it consistently? If every account executive logs blockers differently, the KPI isn't ready.
- Does it influence a real decision? If leadership won't change prioritization based on it, remove it.
- Can finance or revenue ops challenge it without breaking it? If not, tighten the definition.
This is the part commonly skipped because it feels slower than building a dashboard. It isn't slower. It's what prevents six months of bad scoring from hardening into process.
Mapping Data Sources for Signal Detection
A revenue-first impact model is only as good as the raw inputs behind it. Most SaaS companies already have the data they need. The issue is that the signals are buried across tools that were never designed to work together.
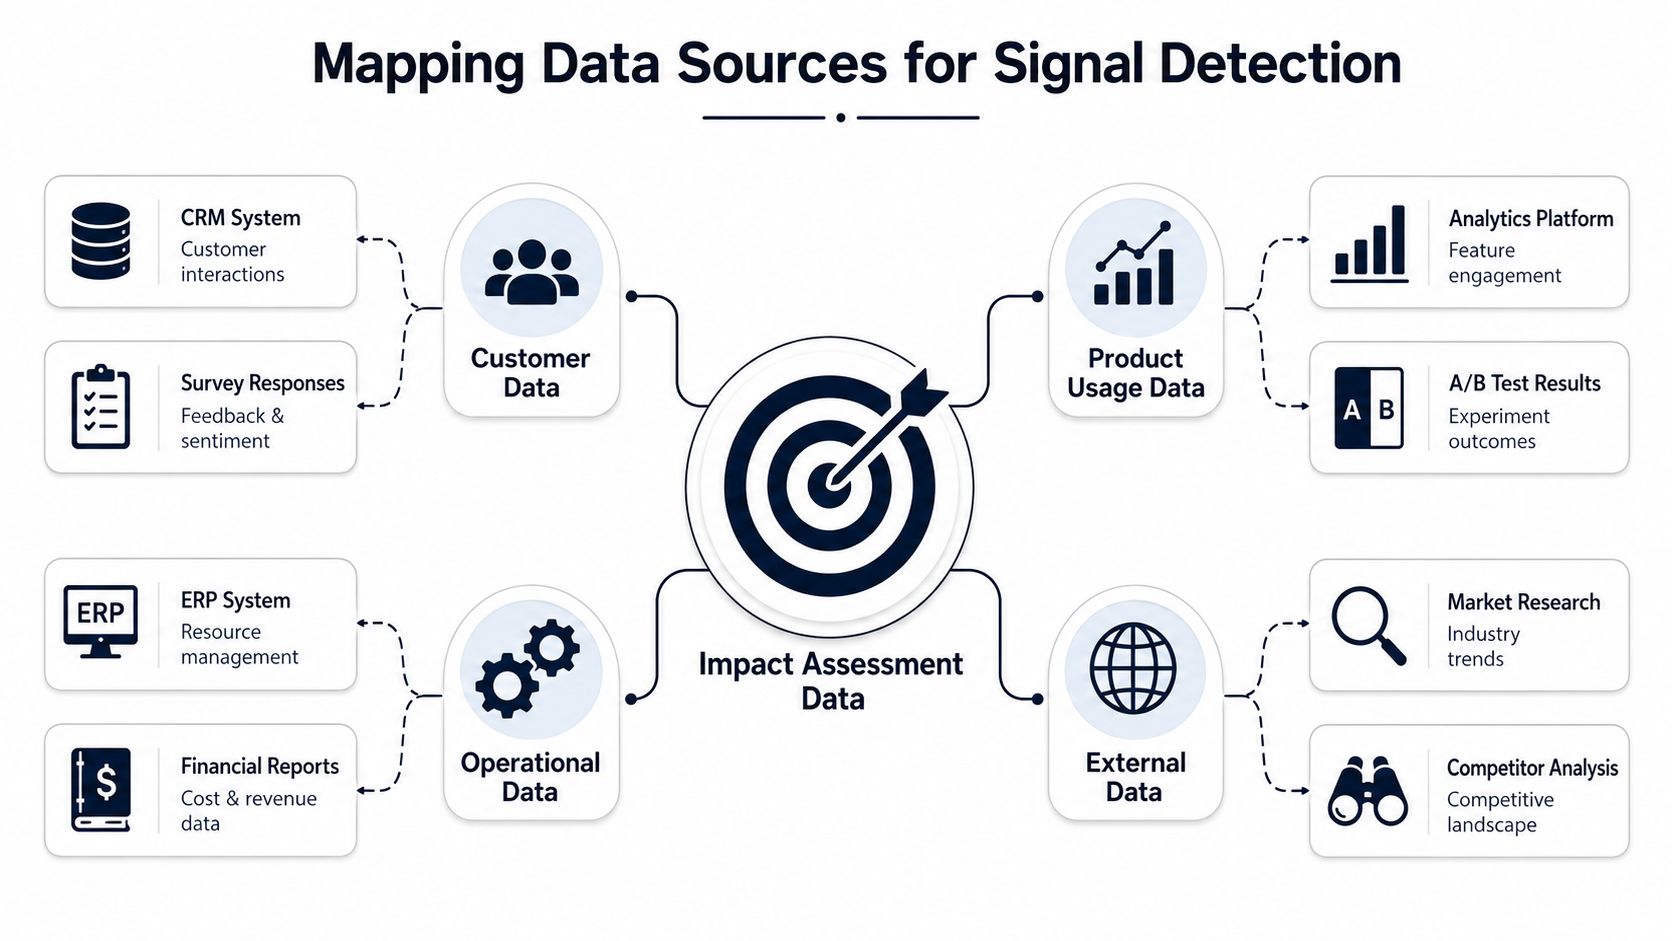
Run a real data audit
Don't start with AI. Start with inventory.
List every system where customer pain, buyer friction, product behavior, or commercial context appears. For most SaaS teams, the list includes:
- Support channels like Zendesk, Intercom, Freshdesk, and help center search logs
- Conversation tools like Gong, Chorus, Slack, email threads, and implementation notes
- Product analytics like Mixpanel, Amplitude, Heap, and feature flag logs
- Revenue systems like Salesforce, HubSpot, Stripe, Chargebee, and renewal trackers
- Operational records like Jira, Linear, GitHub, and incident postmortems
- External sources like G2 reviews, app marketplace reviews, and competitor teardown docs
The point isn't to centralize everything on day one. The point is to identify where repeat evidence already exists.
Look for patterns, not isolated comments
Signal detection starts when you stop reading one item at a time.
If ten support tickets use different language to describe the same onboarding failure, that's one signal. If three enterprise calls mention a security feature gap and all three deals are late-stage, that's one signal with serious commercial weight. If product analytics show users abandoning the same workflow those tickets reference, you've moved from opinion to corroboration.
Use a basic tagging system first. You don't need a platform to do this well enough to learn.
A manual spreadsheet can include:
| Field | What to capture |
|---|---|
| Theme | The underlying issue or request |
| Source | Zendesk, Gong, Salesforce, Mixpanel, Slack, etc. |
| Account | Customer or prospect name |
| Segment | SMB, mid-market, enterprise, strategic |
| Revenue context | Existing account, expansion, new logo, at-risk renewal |
| Evidence note | Short sentence with the exact problem |
| Recurrence | Whether the issue repeats across sources |
Handle messy inputs without overengineering
A lot of useful evidence lives in ugly formats. PDFs from implementation reviews. Exported call summaries. Attached procurement docs. If part of your audit involves turning static documents into analyzable text, tools for techniques for PDF data extraction can make that less painful.
The bigger lesson is architectural. Your data sources are not separate reporting lanes. They're a listening network. A customer comment becomes meaningful when you can join it to usage behavior, account value, and commercial stage.
If your team needs a cleaner way to think about those joins, a visual reference for data architecture diagram patterns helps frame what needs to connect and what can remain loosely coupled.
A single angry message is noise. The same complaint across support, sales, and product analytics is a business signal.
What to avoid
Three habits ruin early signal detection work:
- Tagging too specifically. If you create fifty near-duplicate labels, patterns disappear instead of emerging.
- Ignoring account context. “Reporting bug” means very different things for a trial account and a strategic renewal.
- Confusing volume with importance. Some issues create lots of tickets because they're easy to report. Others create little noise and still cost deals.
Good impact assessment methodology doesn't just gather evidence. It reduces ambiguity about which evidence deserves action.
A Practical Model for Scoring Impact
Once your objectives and data sources are in place, the model can stay simple. It should stay simple, at least at first.
The most practical formula I've seen teams adopt is:
Impact Score = Affected Revenue × Severity × Frequency
That formula works because it forces three useful conversations. What money is attached to the issue? How bad is the consequence? How often is it happening?
Define the variables tightly
Affected Revenue is the commercial value connected to the accounts or deals touched by the issue. For an existing customer problem, that might be renewal exposure or expansion potential. For a sales request, it might be weighted pipeline tied to a clearly documented blocker.
Severity measures business consequence, not emotional intensity. An issue that annoys many users may still be less severe than one problem that blocks procurement, breaks billing, or prevents activation in a high-value segment.
Frequency captures recurrence. One painful anecdote doesn't deserve the same score as a pattern repeated across tickets, calls, and analytics.
A simple rubric keeps the model usable:
| Variable | Score: 1 (Low) | Score: 2 (Medium) | Score: 3 (High) |
|---|---|---|---|
| Affected Revenue | Limited commercial exposure | Meaningful exposure in active accounts or deals | High-value retention or major deal exposure |
| Severity | Workaround exists and impact is contained | Friction is material and slows outcomes | Blocks core workflow, renewal, purchase, or expansion |
| Frequency | Rare or isolated | Repeats across several sources | Persistent pattern across teams or accounts |
Compare two very different requests
Suppose support logs a bug affecting five smaller customers. Each account can still use the product, but a reporting workflow is unreliable and support is spending time on workarounds. The issue repeats often enough to show up in tickets and customer success notes.
A reasonable score might look like this:
- Affected Revenue = medium
- Severity = medium
- Frequency = high
That gives you a strong score, because even moderate pain becomes expensive when it repeats.
Now compare that with a feature request from one large enterprise prospect. Only one account is involved, but procurement won't move forward without the capability. Usage data won't help you here because the feature doesn't exist yet. Your evidence comes from sales notes, stakeholder calls, and the account plan.
That score might be:
- Affected Revenue = high
- Severity = high
- Frequency = low
The result is still highly competitive, even though the issue appears less often.
This is why a scoring model is better than a voting contest. It lets you compare apples to oranges without pretending they're the same fruit.
If your model always favors the loudest source, it isn't measuring impact. It's measuring internal pressure.
Bring in outside evidence carefully
As your model matures, you'll want to improve the connection between upstream signals and downstream outcomes. Adjacent disciplines are beneficial for this purpose. Marketing teams have wrestled with similar attribution problems for years, and guides on how to connect marketing dots to sales results are useful because they force the same discipline: define the event, connect it to the outcome, and avoid magical causality.
Inside product, you'll also want to align this scoring model with how roadmap trade-offs are already discussed. A feature prioritization matrix can sit on top of the scoring system as a portfolio view, but the commercial score should remain the backbone.
Don't pretend precision where none exists
Here, teams overcomplicate things.
You do not need false mathematical certainty. You need consistent economic ranking. If finance can provide exact account values, use them. If not, use bands. If sales confidence is weak, discount the estimate. If support evidence is thin, lower the frequency score until a pattern emerges.
The model should create discipline, not theater.
Validating and Operationalizing Priorities
A scoring model isn't credible because it looks structured. It's credible because it survives contact with reality.
The validation step matters for the same reason formal impact assessment methodology uses structured criteria to distinguish meaningful effects from baseline noise. In environmental assessment, significance is determined by combining impact magnitude with receptor sensitivity in a formal matrix, and “not significant” effects are treated as baseline variation rather than mitigation priorities, as described in this impact significance methodology reference. Product teams need the same discipline. Not every complaint deserves intervention.
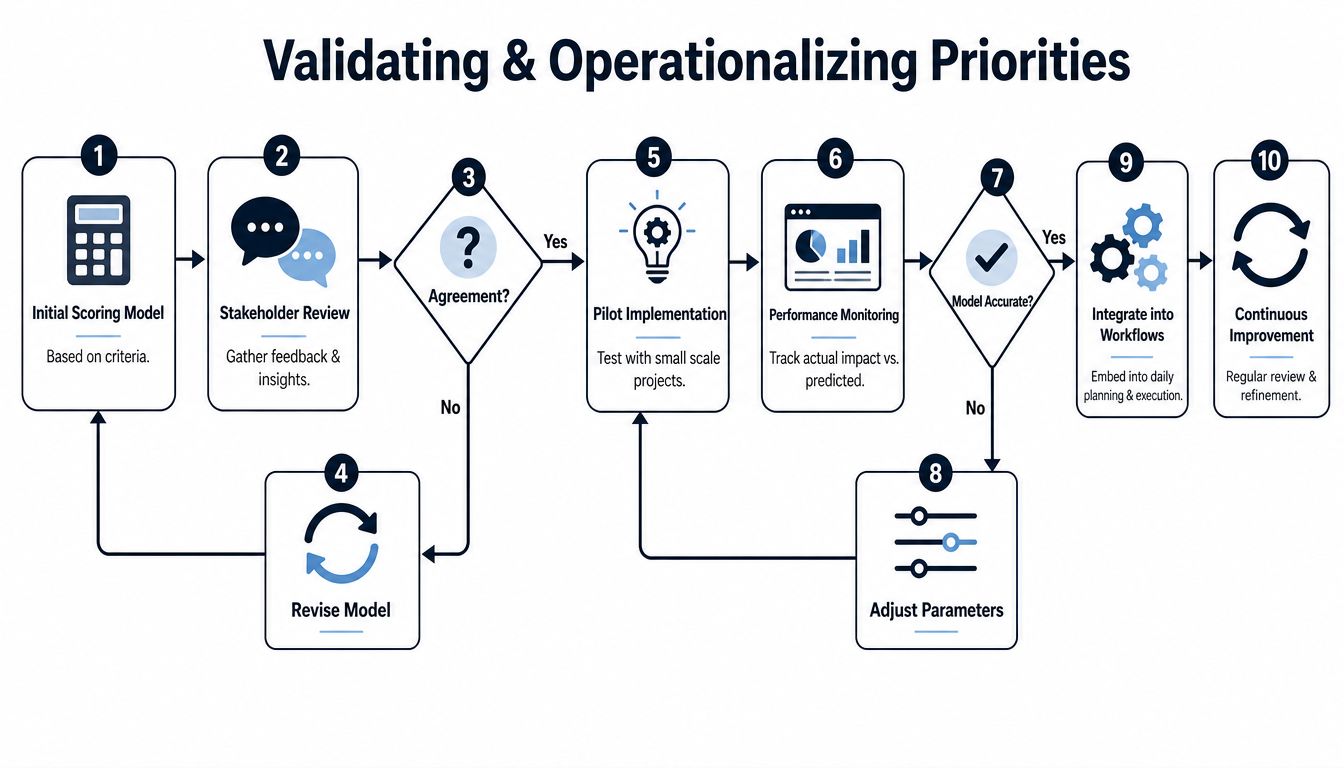
Backtest before you trust
Take the last quarter or two of churned accounts, slipped deals, expansion wins, and major support escalations. Then ask a blunt question: if your current model had existed then, would it have surfaced the same underlying issues early enough to matter?
If the answer is no, don't launch the process widely yet.
A useful backtest looks at:
- Top churn drivers and whether they appeared as repeated signals before cancellation
- Top deal blockers and whether sales had documented them consistently
- Top support drains and whether frequency scoring would have highlighted them sooner
- Shipped fixes or features and whether the impact score would have justified the effort
This isn't academic validation. You're calibrating the model against the outcomes your company already cares about.
Build an impact brief into execution
Once a score is trustworthy enough, attach the logic to the work itself. Every meaningful Jira or Linear ticket should carry a short Revenue Impact Brief.
A good brief includes:
- Problem statement with plain-language evidence
- Affected accounts or segments with revenue context
- Observed frequency across support, sales, and product sources
- Severity rationale describing what business process breaks
- Expected outcome if resolved such as retention protection, expansion progress, or reduced implementation drag
- Confidence level so everyone knows whether the signal is strong or emerging
That brief changes engineering conversations fast. Developers stop seeing a ticket as “report export bug” and start seeing it as “renewal risk in a strategic segment with repeat support burden.”
Product teams get better execution when engineers understand the commercial reason a ticket exists.
Make the workflow automatic where possible
Manual scoring is fine at low volume. Manual handoff is where things usually break.
The cleanest operating pattern is:
- Feedback enters from support, sales, customer success, or product analytics.
- The issue is tagged to a normalized theme.
- Revenue context is appended from CRM or billing data.
- The score is calculated or reviewed.
- A ticket is created with the impact brief attached.
- The right owners are notified, including product, engineering, and account-facing teams.
- The outcome is tracked after release.
This sounds procedural because it is. That's a strength, not a flaw.
In formal assessment programs, a structured seven-step process is commonly used, including screening, scoping, baseline collection, impact prediction, mitigation, public consultation, and monitoring. One summary of that framework reports a 92% correlation between thorough scoping and effective project outcomes in large-scale infrastructure projects in Droppe's impact assessment overview. The exact domains differ, but the product lesson is the same: disciplined scoping upfront usually beats reactive cleanup later.
Scaling Your Methodology Beyond Spreadsheets
Spreadsheets are a good place to start. They're also where a lot of solid systems go to die.
At low volume, a product manager can tag themes, merge support exports, check Salesforce, and maintain a scoring sheet manually. Once ticket volume climbs, deal complexity grows, and more teams rely on the output, the cracks show up fast. Tags drift. Account mappings break. The weekly scoring review turns into a data cleanup meeting.
Know the tipping point
You'll feel the tipping point before you can define it perfectly.
It usually looks like this:
- Support is categorizing issues differently from product.
- Sales keeps side-tracking roadmap meetings with one-off escalations.
- Customer success can't tell which complaints are widespread and which are isolated.
- Analysts spend more time stitching exports together than interpreting the result.
- Engineering gets work requests without enough context to trust the priority.
At that stage, the constraint is no longer strategy. It's system design.
What mature teams automate
The natural next step is a dedicated product intelligence layer that can ingest unstructured feedback, connect it to behavioral and revenue data, score issues continuously, and push ranked outputs into the workflows teams already use.
That matters because the methodology itself doesn't change as you scale. You still need objectives, signal detection, scoring, and validation. What changes is the speed and reliability of the loop.

The core upgrade isn't convenience. It's organizational trust. When support, product, growth, and engineering all work from the same commercially grounded view of customer pain, prioritization stops being a recurring fight.
A serious impact assessment methodology gives SaaS teams something better than a neat dashboard. It gives them a repeatable way to quantify the dollar value of feedback, defend roadmap choices, and move resources toward the problems that change retention, expansion, and pipeline outcomes.
If your team is ready to move past manual tagging and spreadsheet scoring, SigOS is built for exactly this problem. It helps product and growth teams ingest feedback from support, sales, and usage data, identify key signals, and prioritize work based on revenue impact instead of noise.


Ready to find your hidden revenue leaks?
Start analyzing your customer feedback and discover insights that drive revenue.
Start Free Trial →