Lifetime Value Calculator: Build One That Actually Works
Build a lifetime value calculator that goes beyond ARPU times lifespan. Learn SaaS-ready formulas, segment inputs, and calculator examples.

The growth meeting is nearly over. Paid acquisition wants more budget for a channel with a strong blended lifetime value to customer acquisition cost ratio. Finance asks whether those customers are still profitable after implementation and support costs. Nobody has the answer, because the dashboard reports one LTV figure across customer types, contract sizes, and acquisition sources.
The channel gets approved anyway. Later, the team finds that expansion-heavy accounts lifted the average while a less profitable segment consumed the spend. The failure wasn't that the team tracked LTV. It was that its lifetime value calculator turned very different customer outcomes into one confident-looking number.
A useful calculator is a probability-weighted forecast by cohort, not a one-line multiplication. It should make its assumptions visible, show a range when the inputs are uncertain, and help teams see which customer behaviors change expected value. That means defining CLV carefully, choosing inputs that reflect actual costs and retention, deciding between a spreadsheet and an interactive model, then connecting behavioral signals to the forecast.
The LTV Number That Just Cost You a Channel
The decision sounds familiar: marketing presents a channel with an attractive average LTV, sales points to larger accounts in the pipeline, and finance signs off on the budget. The number seems decisive because it compresses a complicated customer relationship into one cell.
But the average can conceal the economics that matter. A channel may attract customers who generate substantial revenue while also requiring intensive onboarding and support. Another may bring in smaller accounts with thinner margins or a different retention pattern. If the model treats them as interchangeable, it can recommend spending more on a channel whose customers don't recover acquisition costs on the company's actual timeline.
The problem is not solved by swapping one standard formula for another. A formula based on average revenue and average churn can still produce a misleading answer if revenue, margins, expansion, and retention vary by cohort. A precise-looking output is not the same as a reliable forecast.
Make the calculator answer a decision
A finance or growth lead should be able to ask the model a practical question: What value do we expect from customers acquired through this channel, after variable costs and discounting, and how uncertain is that estimate? The answer should distinguish the customer groups that drive the result rather than letting a strong cohort mask a weak one.
That shifts LTV from a retrospective performance label to a decision tool. A forecast can inform acquisition budgets, retention investment, and product priorities, but only if the team can trace the output back to customer-level economics and test how it changes when assumptions move.
The next steps are straightforward: define CLV as discounted contribution margin, choose inputs that reflect each cohort's economics, pick a build the team can maintain, and connect behavior to survival estimates. The result should be a calculator that reveals why value differs, not just one that supplies a number.
What Customer Lifetime Value Means
Customer lifetime value (CLV) measures the expected discounted contribution margin from a customer relationship. Revenue becomes customer value only after subtracting variable service and retention costs and accounting for when the cash arrives. A lifespan estimate alone misses both the cost of keeping that relationship and the uncertainty that it continues.
Under constant-period assumptions, the steady-state formula is:
[ CLV = m \times \frac{r}{1+d-r} ]
Here, m is contribution margin per period after variable service and retention costs. r is the probability a customer remains active into the next period. d is the discount rate applied to future cash flows. Retention and discounting must use the same period as margin.
This formulation values future periods before acquisition cost, with stable margin and retention assumptions. Retention appears in both the numerator and denominator, which explains why changes in renewal probability can materially change estimated value, as discussed in UCLA Anderson's research on customer value.
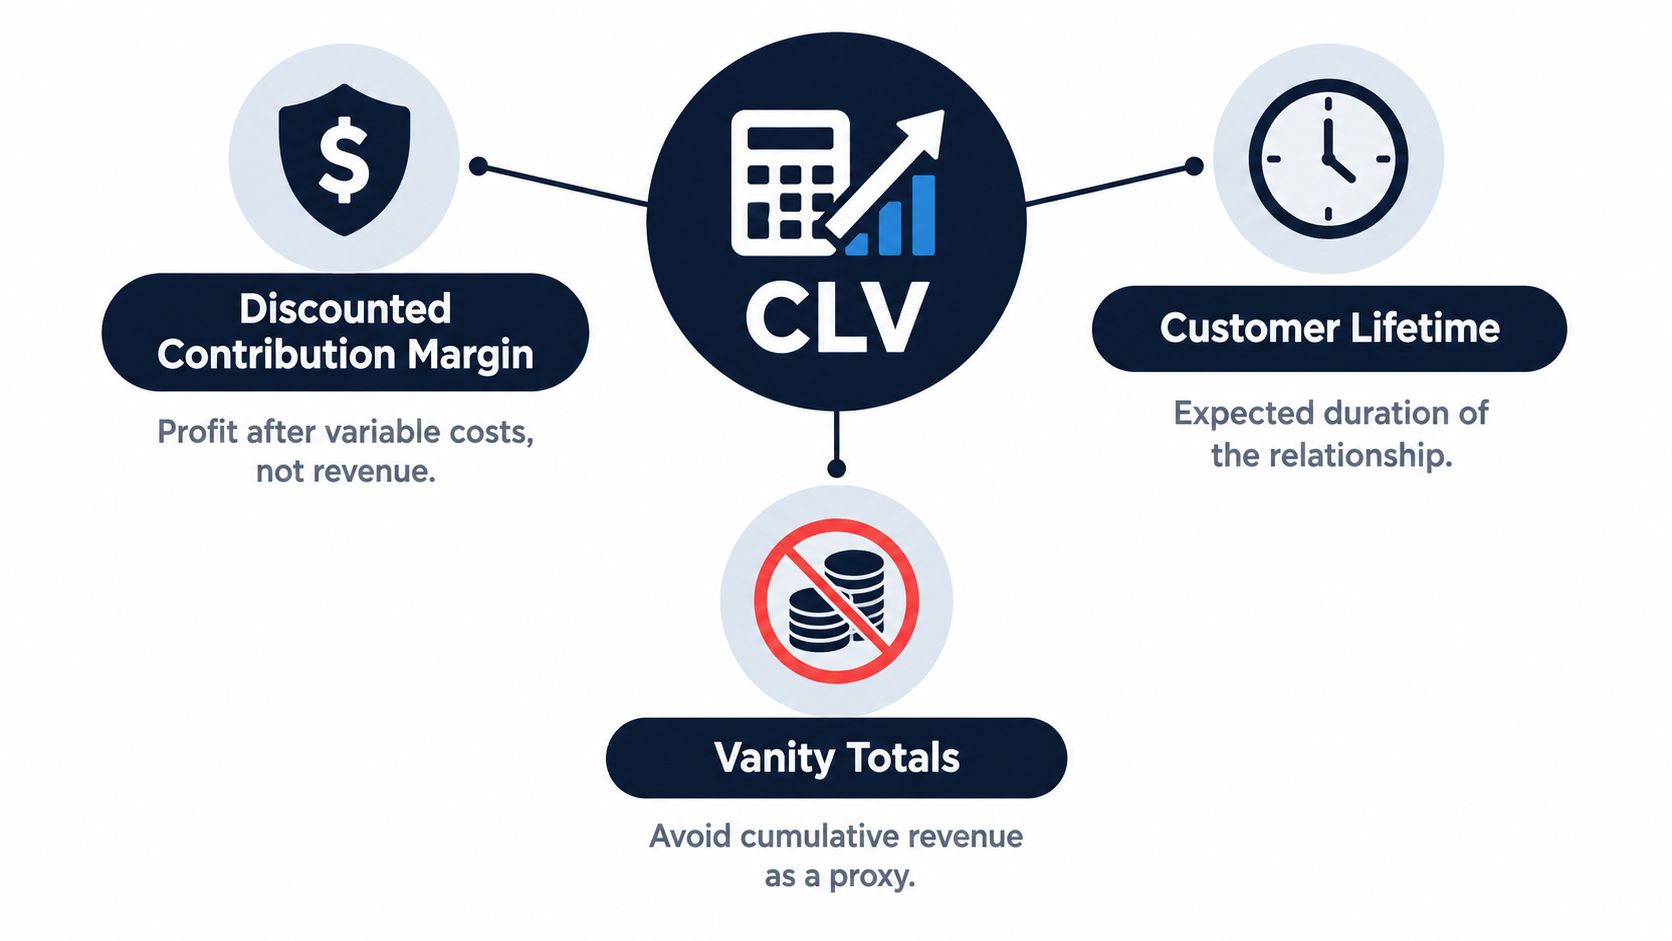
Retention determines how many future margins remain collectible.
Higher revenue can still produce modest value when serving costs absorb it or customers leave before later cash flows arrive. The practical retention question is whether keeping a customer longer produces enough additional contribution margin to justify the expense.
When the steady-state formula is not enough
The shortcut holds up when period economics remain stable. It loses usefulness when retention varies by tenure, expansion develops over time, or service costs fall heavily at the start.
A probability-weighted forecast handles those differences by estimating each cohort's contribution margin in each period, weighting it by the probability the relationship continues, then discounting it. Renewal behavior and expansion patterns can change those probabilities and margins. Show a range when those assumptions are uncertain.
For a comparison of approaches, see customer lifetime value formulas that work. Choose the simpler formula when its assumptions fit; accept the maintenance cost of a cohort forecast when timing and customer behavior materially change the answer.
The Inputs That Move the Answer
A defensible lifetime value calculator starts with the operating data the company already has. The difficult work isn't finding a formula. It's deciding which inputs reflect customer economics, where those inputs live, and how to keep them consistent across cohorts.
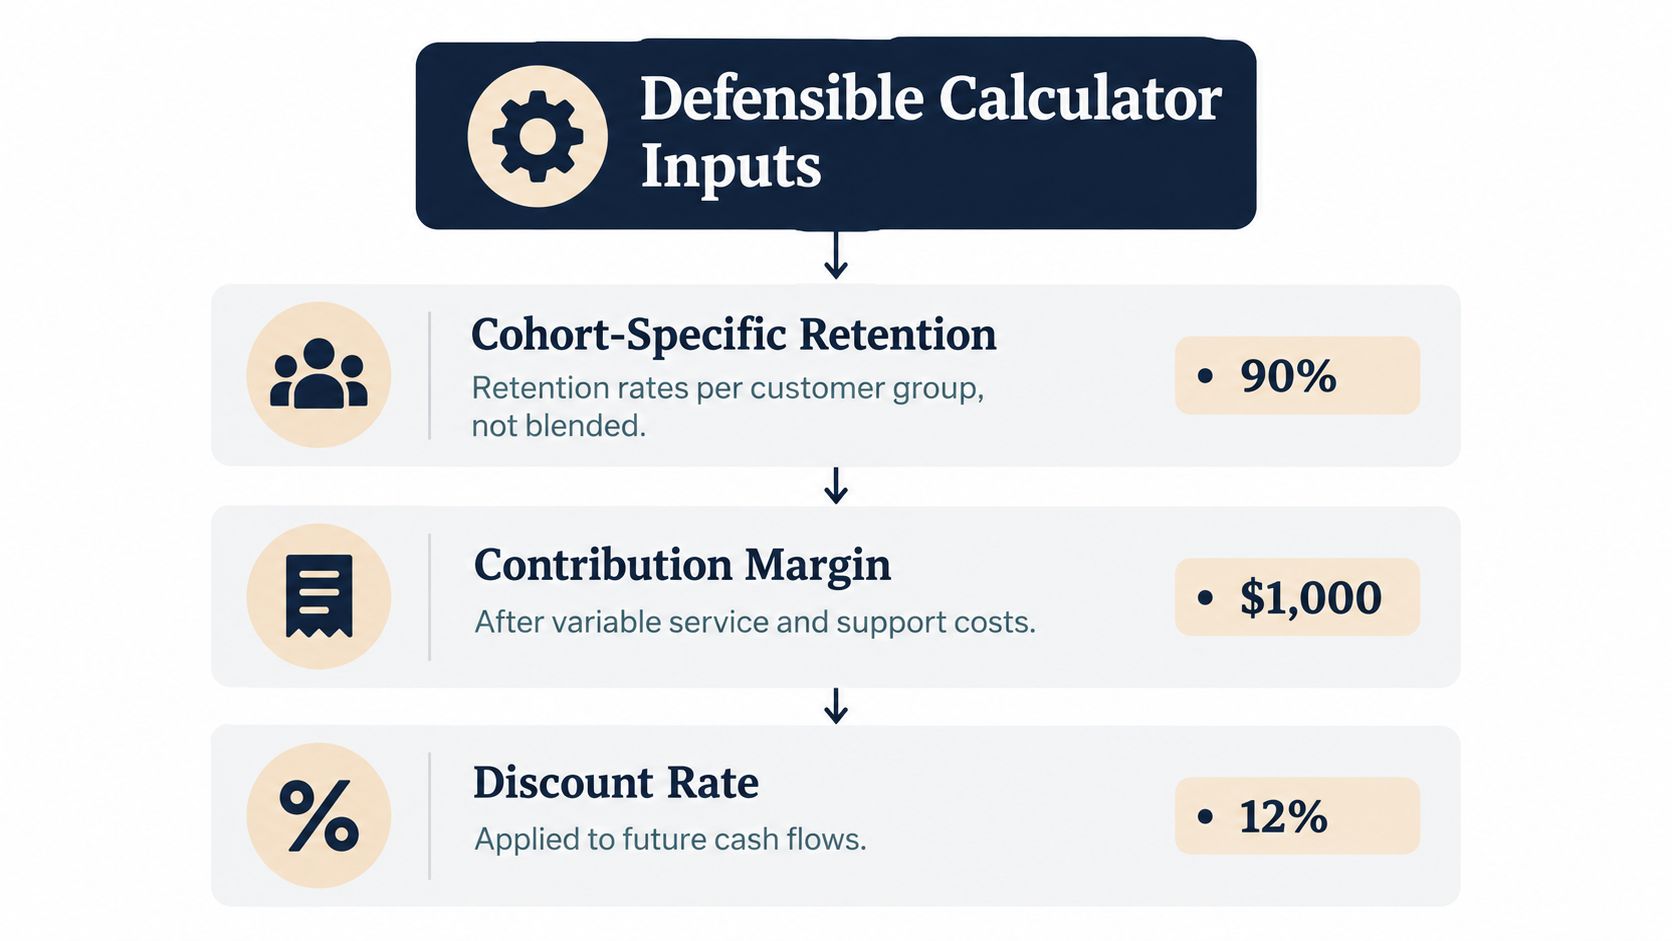
Start with retention, then calculate actual margin
Cohort-specific retention belongs at the top of the input list. Use renewal and cancellation records from the billing system, grouped by customer type, acquisition channel, or another segment relevant to the decision. If the product sees different retention patterns by tenure, estimate survival by cohort rather than applying one company-wide churn figure indefinitely.
Contribution margin comes next. Start with revenue, then subtract variable costs required to serve and retain the customer. Support labor, infrastructure, payment processing, and retention incentives may belong in the calculation, depending on how the company assigns costs. Finance's close process can provide the cost framework, while support and infrastructure tools help identify costs that a broad gross-margin figure may miss.
A probability-weighted net-present-value model represents CLV as expected net cash flow while a customer remains active, weighted by survival probability and discounted over time. In notation, (E(CLV)=\int_0^\infty E[V(t)]S(t)d(t),dt), where (E[V(t)]) is expected net cash flow conditional on being active, (S(t)) is survival probability, and (d(t)) is the discount factor. This structure helps avoid using gross revenue instead of margin or assuming churn stays constant across tenure and segments (Harvard Business School research on customer lifetime value).
Separate future growth from the cost of starting the relationship
Choose a discount rate and state it alongside the output. Finance should own the assumption, and the model should make it easy to test how the value changes when the rate changes.
Model expansion and contraction separately from retention. A retained customer may upgrade, downgrade, or keep spending steady; combining those effects into a single revenue average obscures what's driving the forecast. Finally, include onboarding or implementation costs as an early-period drag rather than spreading them invisibly across the whole relationship.
For additional context on practical LTV measures, Jumpstart Partners on LTV metrics offers another useful reference. Teams building cohort inputs can also compare their definition of churn with SaaS churn rate benchmarks. The two errors to avoid are consistent: counting revenue as if it were margin, and treating average churn as a permanent customer-level truth.
Spreadsheet Versus Interactive Calculators
A spreadsheet and an interactive calculator can use the same underlying assumptions while serving different teams. The choice is less about sophistication than about who needs to inspect the model, how often the business changes its assumptions, and whether the output needs to support live decisions.
A spreadsheet works well when a finance partner can review the formulas, inputs change infrequently, and one person owns the model. Google Sheets or Excel makes assumptions visible and allows a reviewer to trace a value cell by cell. The trade-off is that versions drift, assumptions get overwritten, and a model built for one analyst can be difficult for product or growth teams to use safely.
An interactive tool is more useful when teams need to compare segments or test assumptions during planning. A growth lead can change retention or support-cost assumptions and see how the forecast responds without editing formulas. That convenience has a cost: someone must maintain the logic, data connections, and permissions so the live output doesn't become an opaque black box.
| Dimension | Spreadsheet calculator | Interactive calculator |
|---|---|---|
| Best fit | Small team, quarterly input changes, one finance reviewer | Multiple segments, frequent experiments, several decision-makers |
| Auditability | Formulas and assumptions are visible in the grid | Requires clear explanations, definitions, and model documentation |
| Scenario testing | Possible, but depends on spreadsheet structure | Built for changing assumptions and comparing outputs |
| Ownership | Usually sits with finance or an analyst | Shared across finance, product, and growth, with a clear model owner |
| Typical risk | Stale copies or broken formulas | Users trust outputs without understanding the assumptions |
A practical decision rule
Choose a spreadsheet if the company has a small set of customer groups, updates inputs periodically, and needs an auditable model that one reviewer can maintain. Choose an interactive calculator if teams run regular experiments, need a segment-level range, and expect non-technical stakeholders to examine the assumptions.
Whichever build you use, keep a clear source of truth for each input. Retention should come from billing and cohort records, costs from finance and operating systems, and behavioral indicators from product and support tools. A polished interface won't fix an unclear definition of margin or an unowned retention assumption.
A Worked SaaS Example With Real Numbers
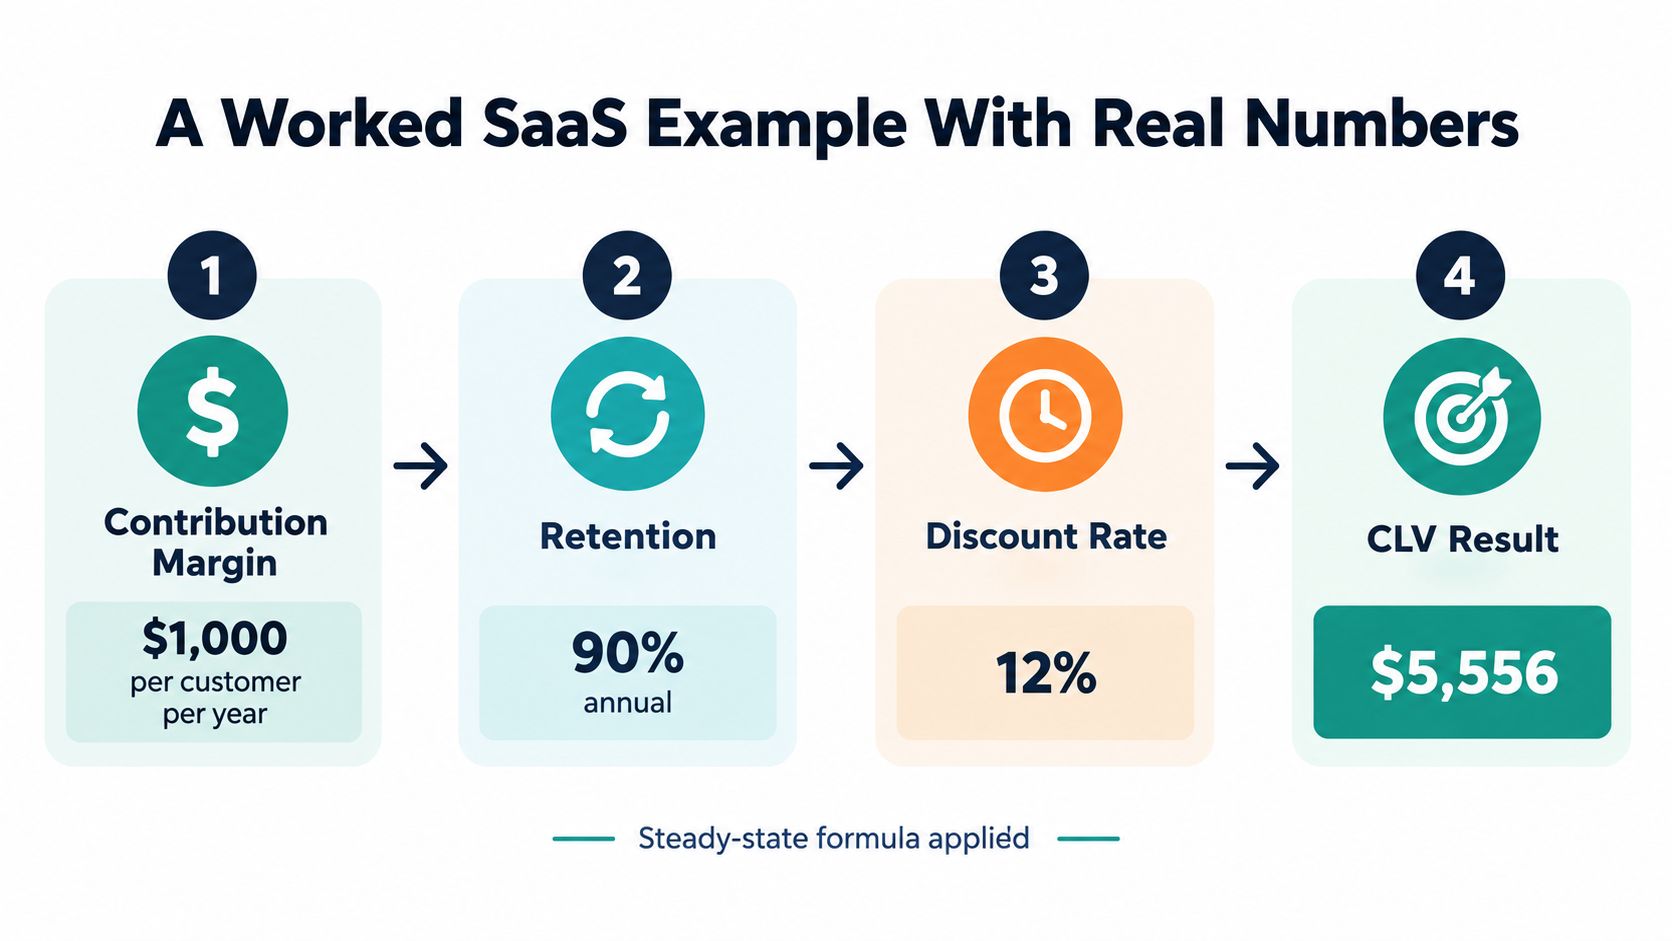
A budget review lands on a customer worth $4,600 before acquisition cost. Before approving spend, finance checks whether the calculator's output reconciles with its inputs. Treat the following as an illustrative worksheet to audit, using the steady-state formula discussed in UCLA Anderson's customer-value analysis.
Contribution margin per year (m) = $1,000
Retention (r) = 90%
Discount rate (d) = 12%

CLV = m × r / (1 + d − r)
CLV ≈ $1,000 × 4.6
CLV ≈ $4,600 before acquisition cost
The worksheet fails that check. $1,000 in annual contribution margin, 90% retention, and a 12% discount rate do not produce the displayed multiple of 4.6 under the formula shown. Recalculate before using the result in a spending decision.
Test the assumptions, not just the formula
Run 92% retention as an upside scenario while holding margin and discount rate constant. Higher retention raises expected value, but the increase must reconcile with the same formula. Keep that scenario separate from the base forecast.
For each cohort, weight future contribution margin by the probability that customers remain active, then discount it. Show a range around the forecast. Product usage, renewal conversations, and support demands can inform scenario assumptions, but they need evidence before changing retention or margin.
A lower discount rate raises future margin's present value; a higher rate reduces it. Record expansion as expected additional margin when it may occur. Charge implementation costs when incurred. These timing choices affect the forecast even when headline revenue stays unchanged.
Use management accounts for SaaS founders to connect margin assumptions with financial reporting. Compare the resulting forecast with acquisition cost, keeping early cash outflows visible rather than treating lifetime value as immediately available cash.
Why One Blended LTV Is Misleading
A company-wide LTV can be mathematically correct and still be a poor basis for a decision. If one customer group retains differently from another, or one segment expands while another contracts, the average can describe neither group well enough to guide spending.
Reported 2025 median net revenue retention (NRR) was 98% for customers with annual contract value under 5,000, compared with 105% for accounts in the ****25,000–$50,000 range; overall NRR was 102% (Founderpath's SaaS KPI benchmarks). The segment figures point in different directions. A blended result can make weaker economics among smaller accounts less visible while larger accounts contribute expansion.
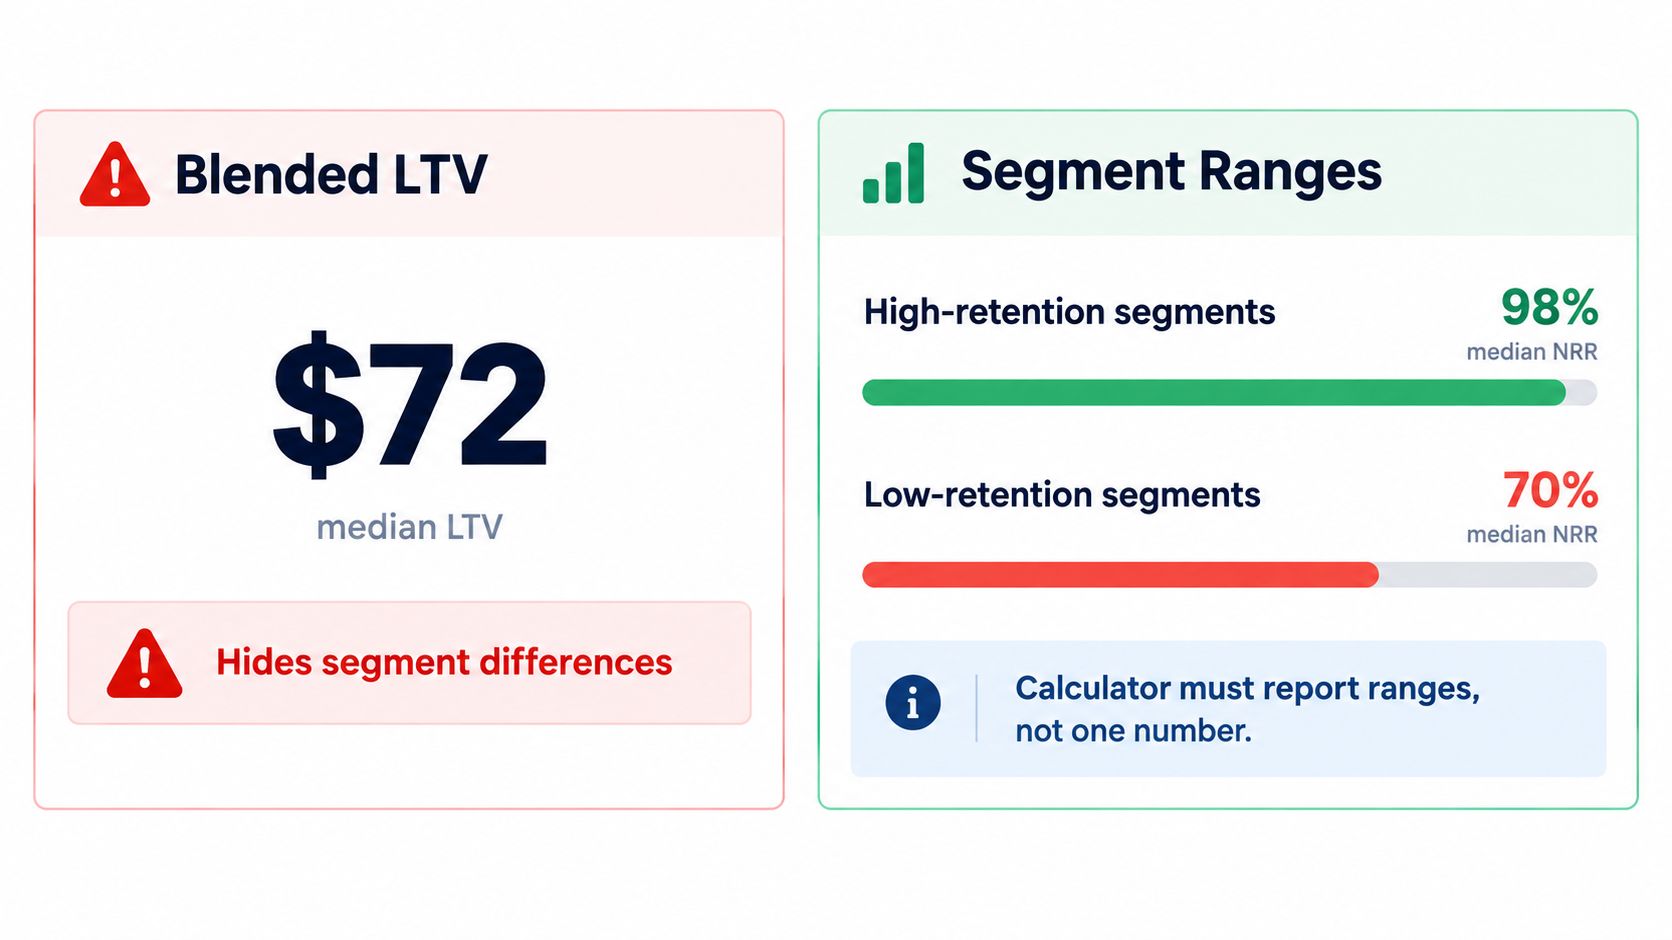
Report the spread and its drivers
The practical question isn't only whether to segment by contract size, acquisition channel, or cohort. It's whether each group behaves differently enough to change the decision. If a channel's customers have distinct retention patterns or support needs, its expected value should not be inferred from the company-wide average.
More model precision isn't always the most valuable improvement. Showing uncertainty and explaining its drivers can be more useful than presenting a point estimate with extra decimal places. If the model's range widens because early usage drops or a recurring support issue appears, the team has something it can investigate and potentially change.
Use a cohort view to test whether outcomes vary across acquisition periods, then compare the customer groups that matter to the decision. Cohort analysis for retention can help structure that comparison.
The operating instruction is simple: report LTV by segment and by cohort, and have the calculator return a range when the assumptions are uncertain. A single company-wide number can remain in an executive summary, but it shouldn't replace the views that explain it.
Pairing LTV With Payback and Cash Recovery
A customer can have attractive theoretical lifetime value and still be a poor near-term investment. Acquisition spending leaves the business before the full stream of customer margin arrives, while implementation and support costs can make early cash recovery slower than a headline LTV suggests.
Reported median CAC payback stretched to roughly 16–18 months in 2025, with enterprise contracts taking substantially longer than smaller contracts. A 2025 analysis also identifies failure to discount future revenue and costs as a reason simple CLV calculations can overstate value (SaaS benchmark analysis from Orb). Those points make timing a core part of the decision, not a finance footnote.
Put cash recovery beside the lifetime forecast
A payback-aware calculator should show discounted contribution margin over time alongside estimated CLV and acquisition cost. That lets a team distinguish a customer who produces value eventually from one whose early economics justify the cash outlay. It also makes the cost of a long implementation or intensive onboarding visible at the point where it affects recovery.
A practical decision rule is to approve a channel or segment only when discounted contribution margin recovered by month 18 exceeds CAC, and the downside LTV under higher churn still clears the bar. The month-18 threshold is an operating rule tied to the cited payback range, not a universal benchmark. A company can set a different horizon to match its liquidity needs and sales cycle.
Don't approve a channel on theoretical LTV alone. Check when the cash comes back, what costs arrive first, and whether the downside case still supports the investment.
This turns LTV into one part of a liquidity-and-retention scorecard rather than a standalone growth metric. Teams reviewing the relationship between acquisition cost and value can use a CAC-to-LTV framework alongside the month-by-month cash profile. If a customer's forecast never converts into recovered cash within the business's chosen horizon, the model should flag that risk instead of hiding it behind a large lifetime total.
Pre-Flight Checklist Before You Trust Any LTV Number
Before quoting a calculator output, check that:
- Retention is loaded by cohort, not inferred from blended churn.
- Margin subtracts variable service and support costs.
- Discounting is set and disclosed.
- Expansion and contraction are modeled separately.
- Segmentation appears alongside the company-wide result.
- Downside cases show the effect of higher churn.
- Payback is checked by segment against the company's chosen horizon.
Next, wire behavioral signals into the survival curves so the forecast responds to what customers do, not only what billing records show.
SigOS helps product and growth teams connect support tickets, sales conversations, and product usage patterns with churn, expansion, and revenue impact. If you're building a cohort-based lifetime value calculator and want to prioritize the customer issues that may change its assumptions, explore SigOS.
Keep Reading
More insights from our blog



Ready to find your hidden revenue leaks?
Start analyzing your customer feedback and discover insights that drive revenue.
Start Free Trial →