Lifetime Value Modeling for SaaS: A Practical Guide
Master lifetime value modeling for SaaS. Learn key metrics, model types, data sources, and how to use LTV to drive product decisions and reduce churn.

A single average churn rate can make SaaS lifetime value materially misleading. The defensible alternative is cohort-based, segment-specific modeling that separates retention from expansion, contraction, and involuntary churn.
That sounds like a technical refinement, but it changes commercial decisions. A model that treats every account as an average customer can tell finance to acquire more of the wrong segment, tell customer success to overinvest in accounts with weak economics, and tell product teams to prioritize loud requests instead of revenue-critical problems.
Benchmark data makes the problem harder to ignore. Median SaaS net revenue retention is 101%, while median gross revenue retention is 91%, and gross retention must reach at least 90% merely to achieve performance parity with peers, according to Forth and Scale's SaaS growth benchmarks. Those figures describe very different economic realities. Gross retention shows what remains before expansion. Net retention includes the expansion that can offset contraction and churn.
The practical question isn't whether your company has an LTV formula. Most do. The question is whether that formula reflects how your customers actually stay, shrink, grow, renew, and disappear.
Why Most SaaS Companies Get Lifetime Value Wrong
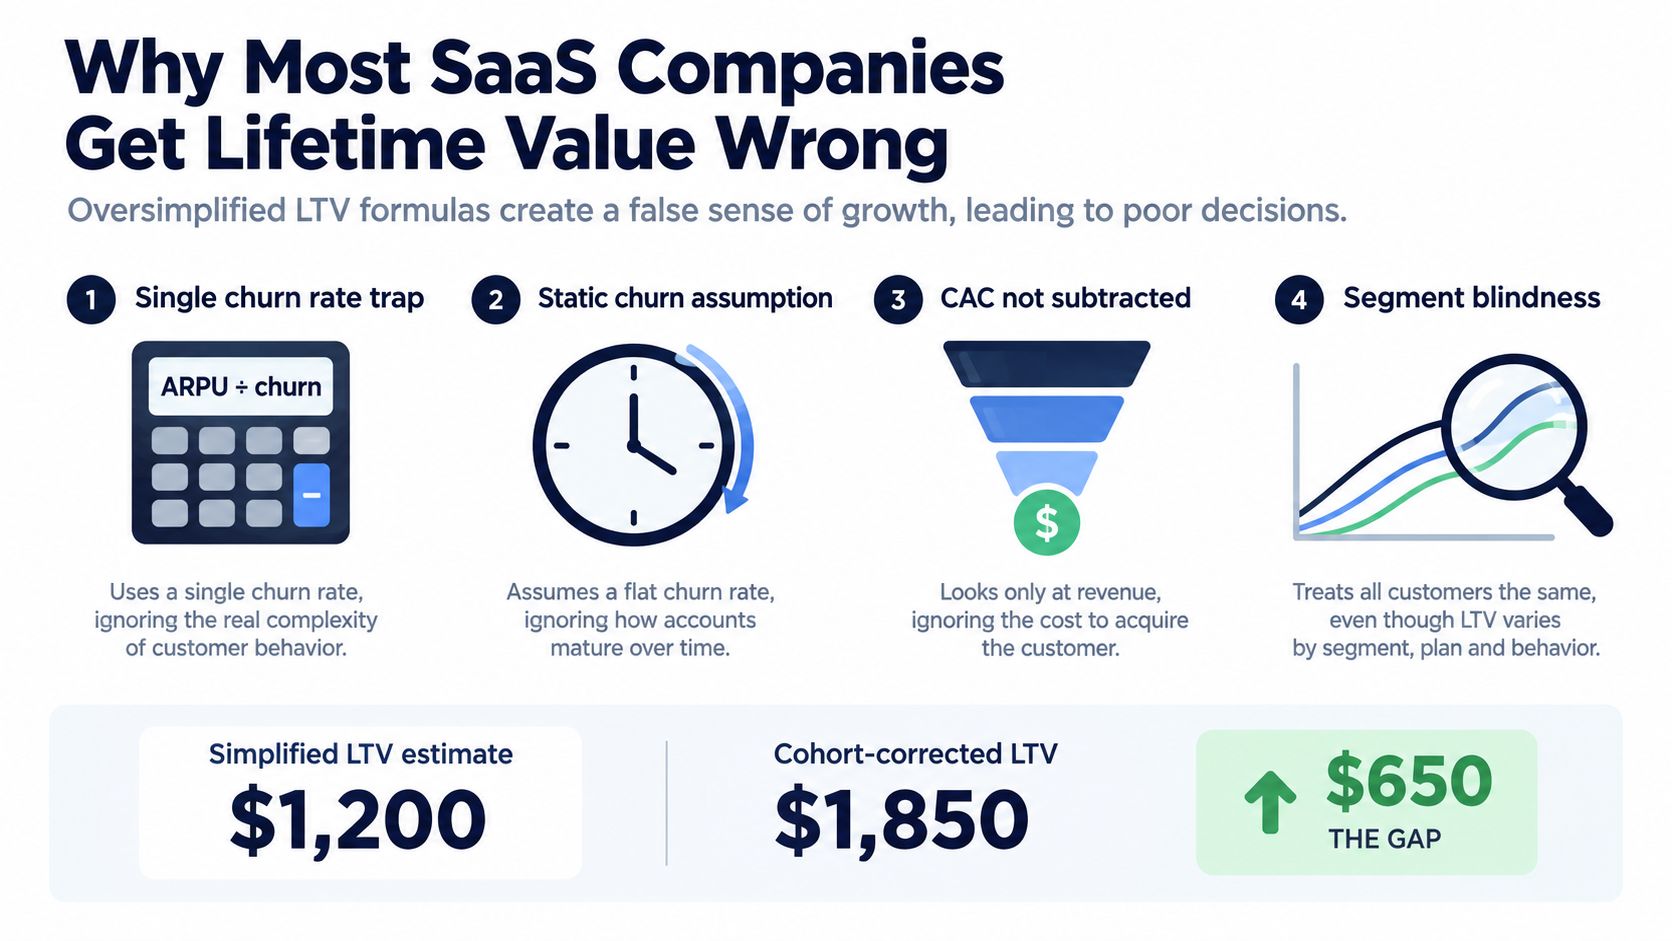
The most common SaaS LTV calculation is also the easiest to misuse:
LTV = average revenue per account ÷ average churn rate
It can be useful as a rough directional measure when a business has stable customers, consistent contracts, and little variation between segments. In a real SaaS business, those conditions rarely hold. SMB customers may have short, volatile relationships, while enterprise accounts may renew under multi-year contracts and expand into additional teams or products.
A single churn average compresses those differences into one number. If a low-retention segment represents a large share of accounts, it can distort the average revenue relationship. If a high-retention segment expands steadily, the same formula can hide the economics that make those accounts valuable.
Practical rule: If one LTV number is used for every acquisition channel, plan, contract type, and customer segment, treat it as a starting assumption, not a valuation.
Retention and expansion tell different stories
Gross revenue retention and net revenue retention answer different questions. GRR asks how much starting revenue remains after churn and contraction. NRR also includes expansion. A company can therefore show strong net retention while losing meaningful revenue from its original customer base and replacing it with upgrades from a smaller group.
That distinction matters for product and customer success. A team trying to protect the installed revenue base should focus on gross retention, involuntary churn, and contraction. A team evaluating expansion plays needs to understand which accounts add seats, adopt new modules, or move into larger contracts.
The benchmark figures above illustrate why this separation matters. Median NRR of 101% and median GRR of 91% do not describe a flat customer base. They describe a business environment where expansion influences the headline result, while gross retention remains a critical test of account durability. GRR below 90% would put a company below performance parity with peers, as the same benchmark source notes.
The average account is rarely a real account
Suppose a blended model combines SMB, mid-market, and enterprise customers. It may produce a neat LTV figure, but the number won't tell a sales leader which segment deserves more acquisition budget. It won't tell product which workflows protect renewals. It won't tell customer success whether an account is valuable because it retains or because it expands after a fragile initial period.
The model should instead track customers by cohort and segment, then separate:
- Gross retention: Revenue preserved before expansion.
- Contraction: Lost revenue from downgrades, reduced seats, or lower usage.
- Voluntary churn: A customer's deliberate decision to leave.
- Involuntary churn: Revenue lost through payment failure or other non-product causes.
- Expansion: Additional revenue from upgrades, cross-sells, seats, or broader adoption.
- Contract structure: Monthly, annual, prepaid, and multi-year agreements.
Data quality determines whether those categories can be trusted. Teams building a model should also review SigOS's guidance on data quality concerns before treating blended billing and product data as decision-ready.
A useful cohort model doesn't promise certainty. It estimates survival probabilities over time, projects revenue and gross margin separately, discounts future cash flows, and reports a range of plausible outcomes. Behavioral signals can improve prioritization before renewal, but their value should be measured against incremental retained or expanded gross margin, not just against an increase in predicted LTV.
Referral economics deserve the same discipline. Teams evaluating whether acquisition quality differs by channel can use resources such as Refport's guide to analyzed referral program mechanics, then compare resulting cohorts by retention and expansion instead of judging referrals only by initial signups.
What Lifetime Value Modeling Actually Means for SaaS
Lifetime value modeling is the process of estimating the revenue or gross margin a customer relationship is likely to generate across its full commercial life. A useful model accounts for what the customer pays, how long the relationship survives, how revenue changes during that period, what it costs to serve the account, and how the timing of future cash flows affects present value.
That definition excludes a common shortcut. Current contract value is not lifetime value, and historical revenue is not automatically future value. LTV is a forward-looking estimate built from observed customer behavior and explicit assumptions.

Choose the right unit of analysis
There are four useful levels for SaaS lifetime value modeling:
- Account level: Best for customer success actions, renewal planning, and account-specific risk.
- Cohort level: Best for comparing customers acquired during the same period, channel, pricing regime, or onboarding experience.
- Segment level: Best for comparing SMB, mid-market, enterprise, plans, industries, or use cases.
- Revenue-contract level: Best when one account contains separate products, entities, billing terms, or renewal dates.
The right level depends on the decision. A CFO may need cohort gross-margin forecasts. A product leader may need account-level risk linked to usage behavior. A revenue operations team may need contract-level expansion and contraction to avoid counting a growing product line as proof that every account is healthy.
Behavioral data adds another layer. Product activity, feature adoption, support interactions, and changes in engagement can help explain why two accounts with the same current revenue have different future value. A useful foundation is the distinction between raw events and interpreted behavioral data. The model should connect those signals to outcomes such as renewal, contraction, expansion, or churn.
Model survival, not just an average lifespan
A static lifespan assumes customers behave alike until they suddenly leave. A survival approach estimates the probability that an account remains active at each point in its relationship. That makes it possible to represent early onboarding risk, maturing accounts, renewal windows, and changes in risk after expansion.
Expansion must sit beside survival rather than being mixed into it. First estimate the probability that the original revenue survives. Then model expected contraction and expansion among the accounts that remain. Finally, translate revenue into gross margin and discount future cash flows according to the company's financial policy.
The result is less convenient than one number, but more useful. It tells teams what has to happen for the forecast to hold.
Three Essential Model Types and When to Use Them
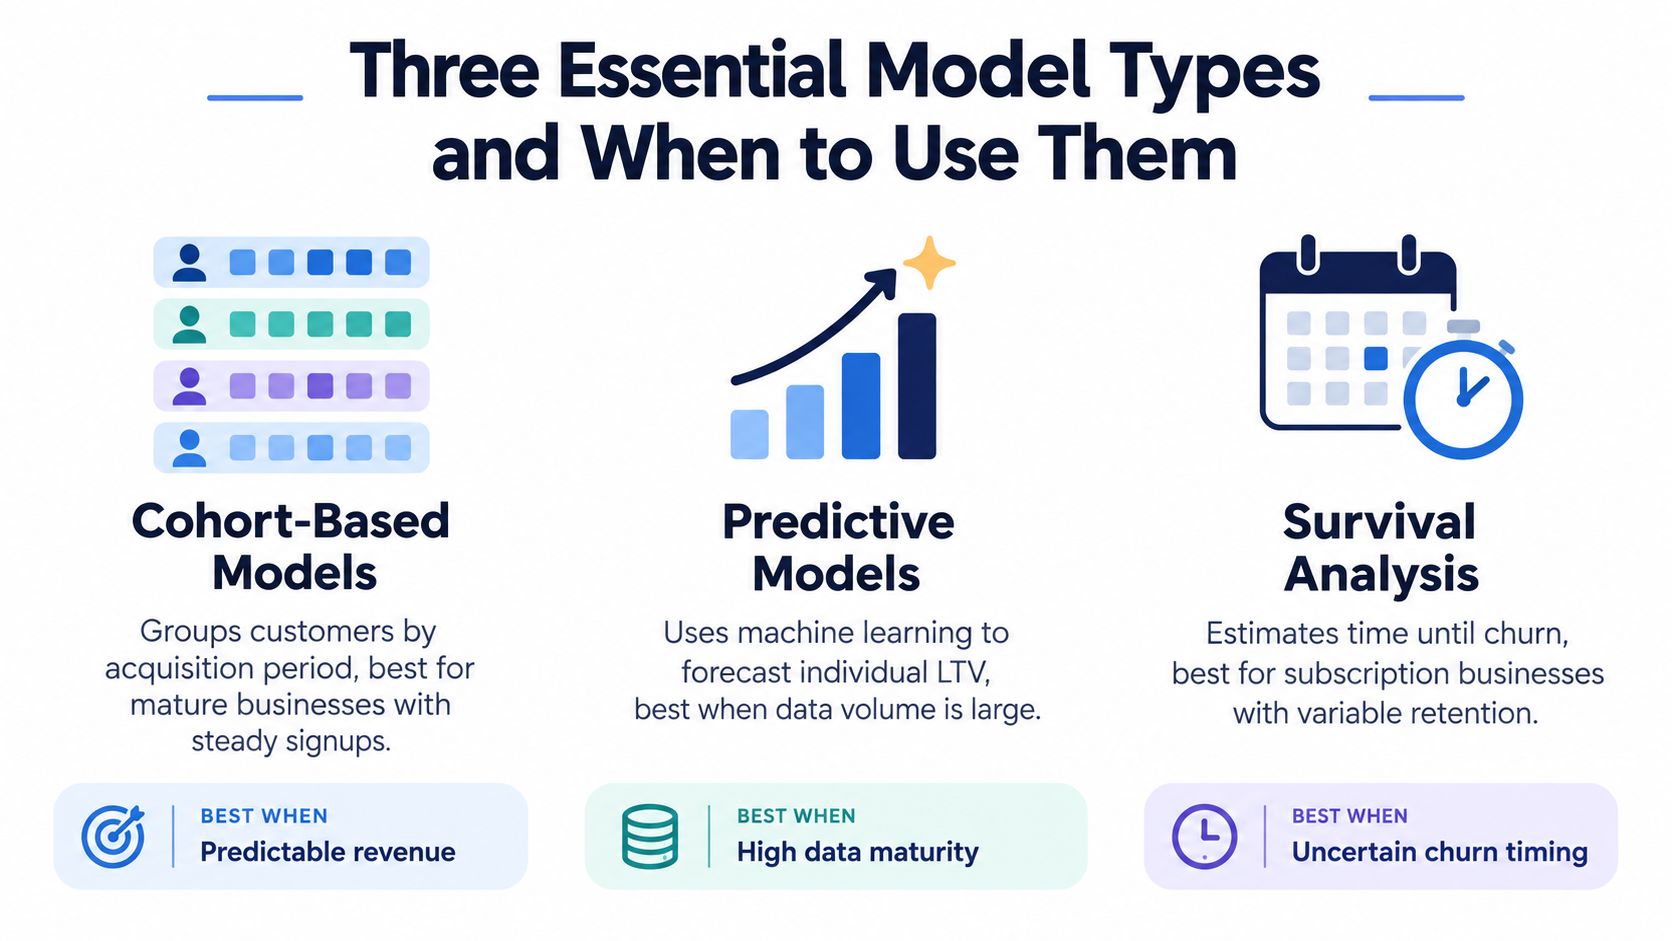
No single modeling method wins in every SaaS environment. The best choice depends on the question, the maturity of the data, and whether the team needs historical explanation, forward-looking prediction, or a clearer view of time-to-churn.
Cohort-based models
Cohort models group customers by a shared starting condition, such as acquisition period, channel, pricing plan, industry, or onboarding path. They show how revenue and retention develop over time without allowing mature customers to conceal weak performance from newer ones.
This is usually the right first serious model for SaaS. It exposes changes in acquisition quality, onboarding, packaging, and market mix. A cohort dashboard should track active accounts, gross revenue retention, contraction, expansion, gross margin, and cumulative value.
The trade-off is that cohort models explain groups better than individuals. They can show that one acquisition channel produces stronger retained revenue, but they won't necessarily identify which account needs intervention today.
Predictive models
Predictive models estimate future customer outcomes from account attributes and observed behavior. Inputs might include contract information, usage changes, feature adoption, support activity, product configuration, and commercial history.
They become useful when the business needs account-level prioritization. Customer success can rank renewal risk. Sales can identify expansion potential. Product can locate behavior patterns associated with lost revenue.
The limitation is dependence on clean labels and stable inputs. If churn reasons are incomplete or customer identities don't join across billing and product systems, a complex algorithm will produce confident-looking answers from unreliable data. Teams should compare predictions with later outcomes and monitor drift rather than treating model scores as facts.
Survival analysis models
Survival analysis treats churn as a time-to-event problem. It accounts for customers who haven't churned yet, estimates how risk changes over tenure, and can distinguish between an account that is active but fragile and one that has survived a risky stage.
This approach is especially useful when renewal timing varies, contracts have different lengths, or the company needs to understand when churn risk peaks. It can also support cohort and segment analysis without forcing every account into the same average lifespan.
The trade-off is interpretability and implementation effort. Product and finance stakeholders may find a survival curve less intuitive than a single LTV figure, so the output needs clear explanations and decision thresholds.
| Model type | Strongest use | Main limitation |
|---|---|---|
| Cohort-based | Historical retention and revenue planning | Limited individual-level prioritization |
| Predictive | Account-level risk and expansion ranking | Requires reliable behavioral and outcome data |
| Survival analysis | Time-sensitive churn and renewal forecasting | More difficult to explain and maintain |
Many teams should combine them. Use cohorts to establish the economic baseline, survival analysis to understand timing, and predictive scoring to decide where a human should act. A revenue prediction framework such as this guide to revenue prediction models can help connect forecasts to operational decisions without confusing a forecast with a guarantee.
Data Sources and Requirements for Building Models
A lifetime value model is only as credible as the customer and revenue records underneath it. Start with a clear customer identifier that connects billing, CRM, product usage, support, and sales activity. If one account appears under several IDs, the model may treat expansion as a new customer or attribute churn to the wrong segment.
Build the revenue ledger first
The revenue ledger should capture every material movement in account value:
- Starting revenue: The recurring or contracted amount at the beginning of the observation period.
- Billing events: Invoices, payments, credits, refunds, and failed transactions.
- Expansion: Upgrades, added seats, new products, and broader usage.
- Contraction: Downgrades, removed seats, reduced plans, and negotiated reductions.
- Churn classification: Voluntary cancellation separated from involuntary payment loss.
- Contract context: Annual prepayment, renewal date, contract duration, and multi-year terms.
Don't start with a machine learning model if the ledger can't distinguish those events. A cohort-based margin model built from trustworthy revenue movements is more valuable than a predictive model trained on blended totals.
Add the signals that explain movement
Usage data can reveal adoption, inactivity, feature dependency, and changes in customer behavior. Support tickets and chat transcripts can expose unresolved friction. Sales calls can surface expansion intent, competitive threats, and objections that never appear in structured CRM fields.
The strongest implementation joins these sources to outcomes. A support theme matters for LTV when it correlates with contraction, churn, or delayed expansion. A feature event matters when it helps explain retained margin or a successful upgrade. The model should preserve the distinction between correlation and causation, then test whether interventions change the outcome.
For acquisition analysis, a practical customer acquisition measurement guide can help teams define the connection between source, customer quality, and downstream value.
Handle missing data explicitly
Missing churn reasons shouldn't be automatically assigned to voluntary churn. Missing usage events shouldn't be interpreted as inactivity until instrumentation has been checked. Create a data-quality field for each important variable, document exclusions, and show stakeholders how much of the customer base supports each conclusion.
A first release can use fewer variables and clear caveats. It should answer one commercial question reliably, such as which onboarding cohort has the weakest gross retention or which segment generates the most retained gross margin. Expand the model only after the underlying joins and definitions hold up.
Turning LTV Insights Into Product Prioritization
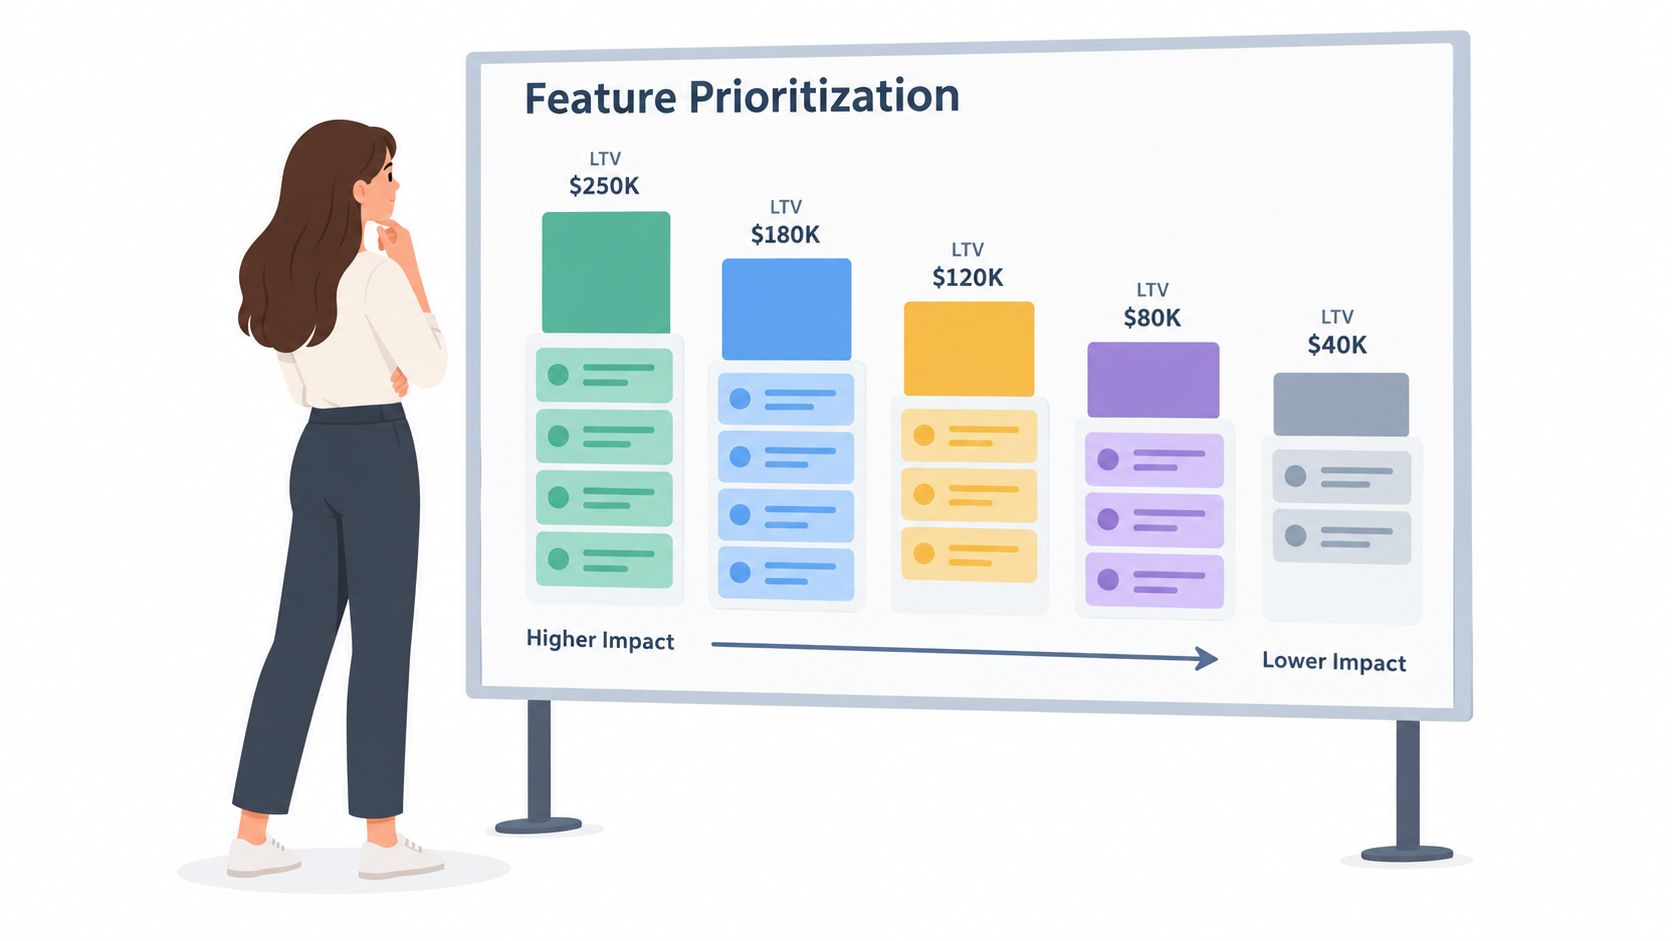
LTV becomes operational when product teams stop asking which request is most popular and start asking which customer problem threatens the most retained or expanded margin.
That doesn't mean ignoring smaller customers or allowing large accounts to buy the roadmap. It means adding economic context to product judgment. A bug affecting a high-value workflow, a recurring integration failure during onboarding, and a cosmetic request from a highly engaged account don't carry the same revenue consequences.
Convert signals into product decisions
A practical prioritization record should connect four elements:
- Customer pattern: What are accounts doing, reporting, or avoiding?
- Economic exposure: Which retained or expansion revenue is associated with the pattern?
- Confidence: How consistently does the pattern appear across accounts and cohorts?
- Intervention: What product, service, or workflow change could alter the outcome?
Suppose customers who stop using a core workflow also create unresolved support conversations before renewal. The product question isn't whether that workflow needs improvement. The commercial question is how much retained gross margin is exposed, which segment is affected, and whether the issue appears early enough for an intervention to work.
Behavioral intelligence helps product teams move from anecdotes to prioritization. A drop in usage can trigger investigation before a renewal event. Repeated requests for a missing capability can signal expansion potential, but only if the affected accounts have a credible path to broader adoption. LTV modeling supplies the financial lens, while behavioral analysis supplies the timing and context.
Measure the outcome, not the activity
A roadmap item shouldn't be considered successful because it shipped, received positive feedback, or increased feature usage in isolation. Define the expected commercial outcome before development begins.
For a retention initiative, track whether the exposed cohort shows improved survival, lower contraction, or fewer preventable payment failures. For an expansion feature, track adoption alongside upgrades or broader contract value. For a quality fix, compare the affected behavior and revenue trajectory with a suitable cohort that didn't receive the intervention.
A high predicted LTV doesn't justify unlimited service effort. It tells you where an intervention may have more economic leverage, provided the intervention can change the outcome.
This framework also protects product teams from overreacting to large accounts. A request may come from a valuable customer but still have low transferability, weak evidence, or limited expansion potential. Conversely, a small account may reveal a problem shared by a much larger cohort. Segment-level evidence keeps prioritization grounded in repeatable economics.
Common Pitfalls and How to Avoid Them
The most dangerous LTV errors don't come from advanced mathematics. They come from definitions that look reasonable but answer the wrong question.
Mistaking retention metrics for substitutes
GRR and NRR shouldn't be collapsed into one health score. GRR shows whether the existing revenue base survives. NRR shows what remains after expansion is included. If a team monitors only NRR, expansion can conceal contraction that product and customer success still need to address.
Contract type creates another trap. Monthly accounts, annual prepay customers, and multi-year contracts don't produce comparable billing patterns. Annual prepayment may improve cash collection without proving that the account will renew. The model needs separate timing and renewal assumptions rather than treating cash received as durable value.
Publishing false precision
A point estimate invites executives to treat uncertainty as fact. LTV should be reported with confidence ranges or scenario bands, especially for newer cohorts, smaller segments, and accounts with limited observed tenure.
Use conservative assumptions when evidence is thin. Compare predicted outcomes with later cohort performance. Record every assumption, including margin, discounting, expansion eligibility, and the definition of churn. When the model misses, change the assumption or the data pipeline instead of hiding the error in a revised average.
Building a model nobody uses
A technically elegant forecast fails if it doesn't appear in the decisions that affect revenue. Customer success needs account and renewal views. Product needs issue and feature prioritization. Finance needs cohort gross-margin forecasts. Marketing needs acquisition quality by channel.
Create a feedback loop:
- Review predictions: Compare risk and value scores with actual outcomes.
- Inspect exceptions: Find accounts the model ranked incorrectly and identify missing signals.
- Update actions: Change playbooks when an intervention doesn't influence behavior.
- Retire weak inputs: Remove variables that add noise or create unfair prioritization.
- Keep ownership clear: Assign responsibility for definitions, data quality, and model review.
The first useful model is rarely the most complex one. A transparent cohort model with explicit retention and expansion logic can support better decisions while the organization improves its data foundation.
Building a Revenue-Driven LTV Strategy
Effective lifetime value modeling starts with a narrow commercial decision, not a demand for perfect analytics. Decide whether you need to improve acquisition quality, prioritize renewal risk, find expansion opportunities, or allocate product resources. Then choose the smallest model that can answer that question credibly.
Build the revenue ledger, segment customers by meaningful economic differences, and separate gross retention from expansion. Add behavioral signals only when they connect to observable outcomes. Report ranges, validate predictions against later results, and place the output inside the workflows where teams already decide what to build, sell, support, and fund.
The strategic shift is simple: LTV isn't a quarterly spreadsheet metric. It's a shared operating lens for deciding which customers need attention, which problems deserve product investment, and which growth opportunities can produce durable margin.
SigOS connects support tickets, chat transcripts, sales calls, and product usage signals so teams can associate customer behavior with churn, expansion, and revenue impact. Visit SigOS to see how its product intelligence workflows can help turn LTV analysis into clearer product and growth priorities.
Keep Reading
More insights from our blog


Ready to find your hidden revenue leaks?
Start analyzing your customer feedback and discover insights that drive revenue.
Start Free Trial →