Your Guide to a Modern Product Analytics Platform in 2026
Discover how a product analytics platform turns user data into revenue. This guide covers core features, AI's role, and how to choose the right tool for growth.

At its core, a product analytics platform is a specialized tool that shows you what people are actually doing inside your app or website. Think of it as a detailed map of your user’s journey, turning every single click, tap, and scroll into a clear picture you can use to make better decisions.
Why Product Analytics Is No Longer Optional
Imagine trying to improve your product based on gut feelings or boardroom debates. You might get lucky, but more often than not, you're just guessing. Running a digital product without proper analytics is a lot like that—you’re essentially flying blind, hoping you’re building something people want.
This is where product analytics comes in. It replaces that guesswork with hard evidence. It’s the tool that shows you precisely where users get excited, where they get stuck, and which features they keep coming back to. This shifts the entire conversation from "I think we should..." to "The data shows us that..."
From Guesswork To Growth
In today's competitive market, you can't afford to guess what users want. A product analytics platform gives your team a systematic way to understand user behavior and tie it directly to business goals like revenue and retention.
That’s why the market is exploding. Projections show the product analytics space growing from 13-18 billion in 2026 to a massive ****58 billion by 2031. Cloud-based tools are leading the charge, making up nearly 88% of the market because they're far more scalable and accessible than old on-premise systems. You can dig deeper into these numbers in this full product analytics market report.
Ultimately, these platforms help you answer the most critical questions about your product:
- Which features actually drive engagement? Stop maintaining features nobody uses and double down on what works.
- Where do people drop off during onboarding? Find and fix the exact friction points that are costing you new customers.
- Did our new feature release actually increase revenue? Connect product changes directly to financial impact.
A great product analytics tool helps you build experiences that people genuinely love. It’s no longer a nice-to-have; it's the foundation for building a successful product in a data-driven world.
Wait, Isn't That What Google Analytics Does?
It's a common question, but the answer is a firm no. While both are valuable, they're designed for completely different jobs. Traditional web analytics focuses on how people get to your site, while product analytics focuses on what they do once they're inside your product.
Think of it this way: web analytics is the sign on the highway telling you how many cars drove past your store. Product analytics is the in-store camera system showing you which aisles they walked down, what they picked up, and what they ultimately bought.
This table breaks down the key differences:
Key Differences Between Web Analytics And Product Analytics
| Focus Area | Web Analytics (e.g., Google Analytics) | Product Analytics (e.g., Amplitude, SigOS) |
|---|---|---|
| Primary Goal | Understand website traffic acquisition and marketing performance. | Understand user behavior, engagement, and retention within the product. |
| Core Questions | "How did users find us?""Which marketing channel is most effective?" | "Why do users convert?""Which features drive long-term value?" |
| Data Focus | Anonymous, session-based data (pageviews, bounce rate, traffic sources). | User-centric, event-based data (clicks, feature usage, user actions). |
| Key Metrics | Sessions, Users, Pageviews, Bounce Rate, Time on Page. | Daily Active Users (DAU), Stickiness, Funnel Conversion, Retention Rate. |
| User Identity | Primarily anonymous or aggregated traffic. | Tracks individual users across sessions and devices to build a complete journey. |
Both tools are essential for a complete picture. You need web analytics to optimize your marketing funnels and product analytics to build a product that keeps users coming back.
Core Capabilities That Turn Data Into Decisions
A product analytics platform does more than just give you fancy dashboards. It’s built to help your team move past simply looking at numbers and start understanding the stories behind them. You stop guessing and start building a strategy based on what your users are actually doing.
This is all about moving from a world of assumptions and uncertainty to one where your decisions are directly tied to revenue growth.
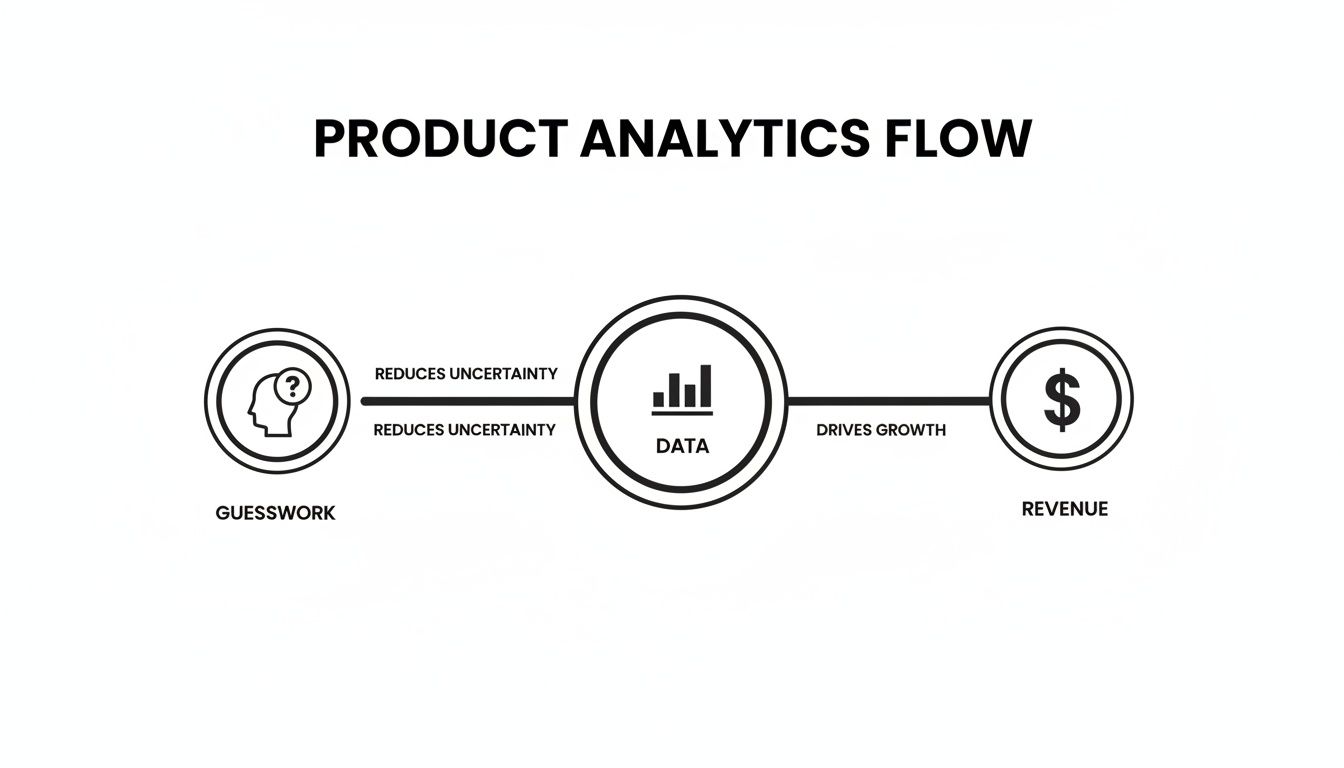
Think of it this way: the platform is the engine that turns messy, raw data into a clear map, and that map leads you straight to growing the business.
Track Every User Interaction with Event Tracking
The foundation of any good product analytics tool is event tracking. An event is any action a user takes inside your product. It’s like a digital breadcrumb they drop, showing you the path they took.
When you set it up right, you get so much more than vague metrics like "pageviews." You can map out every meaningful interaction, such as:
- Clicking the
Upgrade Nowbutton - Successfully completing the onboarding tutorial
- Using a new feature for the very first time
- Running into a payment error
These individual breadcrumbs come together to build a complete, chronological map of the user journey. You see exactly what they did, and just as importantly, in what order.
Group Users with Behavioral Cohorts
Once you’re collecting all those events, you can start grouping users based on what they do, not just who they are. This powerful technique is called behavioral cohort analysis. A cohort is just a group of people who share a common action or trait over a specific period.
Suddenly, you can stop analyzing "all users" and create incredibly useful segments like:
- Power Users: People who used three or more key features in their first week.
- Users at Risk of Churn: Anyone who hasn't logged in for 14 days or whose feature usage has suddenly dropped off.
- Potential Upgrades: Free users who keep hitting the paywall on a premium feature.
By looking at behavior, you can tailor your messaging, pinpoint friction for specific groups, and finally understand what makes your best customers tick.
Pinpoint Drop-Offs with Funnel Analysis
Ever wonder why hundreds of users sign up but only a handful finish your onboarding flow? Funnel analysis is the tool that finds the answer. It’s like a plumber feeding a tiny camera down a pipe to find the exact spot where there’s a leak.
You map out the essential steps a user needs to take to reach a goal, like buying a subscription. The funnel then shows you precisely how many people drop off at each step.
This turns a vague problem like "low conversion" into a specific, fixable issue. For example, you might discover that a staggering 70% of users abandon your onboarding right after the "connect your calendar" step. That’s not just a data point; it’s a bright red flag telling your product team exactly where to focus their attention. Following data visualization best practices helps make these drop-offs impossible to miss.
Quantify Impact with Revenue Scoring
Ultimately, every product decision has to answer one question: "How does this affect the bottom line?" Modern tools, especially AI-driven ones like SigOS, are now able to connect product friction directly to a dollar amount. This is called revenue impact scoring.
Instead of just knowing a bug exists, you can see that it impacts 15% of your enterprise accounts and is putting an estimated $25,000 per month at risk. It answers the "so what?" behind every piece of data. This is a core idea behind how self-serve analytics empowers product teams, as it gives them the context needed to act independently.
When you can tie user behavior to revenue, you can prioritize your roadmap with absolute confidence, knowing you're working on the fixes and features that will deliver the biggest financial return.
The Evolution to AI-Driven Product Intelligence
Think of traditional product analytics as an X-ray. It's incredibly useful for showing you the "bones" of your product—what users clicked, how they moved through a funnel, and which groups they belong to. You absolutely need this structured data. But it only ever tells you what happened, not why.
The real game-changer is the shift toward AI-driven product intelligence. This is like adding an MRI to your diagnostic toolkit. It doesn't just show the bones; it reveals the soft tissue, giving you a rich, detailed picture by making sense of the mountains of unstructured, qualitative data you already have.

This is what that looks like in practice: a team turning complex user feedback into a clear-headed strategy. A good product intelligence platform cuts through the noise and points you toward actions tied directly to business results.
From Unstructured Data to Actionable Insights
Every single day, your company collects a treasure trove of qualitative feedback. It's hidden in plain sight across support tickets, sales call transcripts, and live chat conversations. This is where your customers tell you, in their own words, what they love, what drives them crazy, and what would convince them to stick around.
The catch? This data is messy. It's conversational, unstructured, and simply too much for any human team to read and categorize on their own. This is where AI steps in.
An AI-driven product intelligence platform like SigOS connects to the tools you’re already using and pulls in all this unstructured feedback. It integrates seamlessly with:
- Support systems: Zendesk, Intercom
- Sales CRMs: Salesforce, HubSpot
- Project management tools: Jira, Linear
Using natural language processing (NLP), the platform reads and understands the sentiment, context, and intent behind every customer interaction. All of a sudden, thousands of support tickets aren't just a cost center—they're a real-time, quantified feed of your product's biggest opportunities and risks.
AI doesn't just analyze data; it connects the dots between what users say in a sales call and what they do inside your product. This synthesis is where true product intelligence is born.
This ability to automatically turn messy feedback into clear signals is a huge reason for the market's rapid growth. The infusion of AI is a primary driver behind the projected 22.9% CAGR in the product analytics industry, particularly for its strength in behavioral prediction. You can find more detail in The Business Research Company's global market report.
Identifying Hidden Patterns with High Accuracy
The true magic of AI is its knack for spotting patterns that are completely invisible to the human eye. Sophisticated machine learning models can find correlations between subtle shifts in user behavior and specific themes popping up in all that qualitative feedback.
For example, an AI might discover that users who mention the "confusing export process" in support chats are 40% more likely to churn within 30 days. This isn’t a wild guess. Platforms like SigOS can achieve up to 87% correlation accuracy between the feedback customers give and how they ultimately behave.
This opens up a whole new way for teams to work:
- Predictive Churn Alerts: Instead of finding out a user cancelled, the platform can flag high-value accounts showing early churn signals. This gives your team a window to step in and help. If you want to get ahead of churn, check out our guide on predicting customer churn with AI.
- High-Value Feature Discovery: The AI can pinpoint which feature requests from prospects are most often linked to closed-won deals. This helps you prioritize the work that will actually drive new revenue.
- Quantified Bug Prioritization: Not all bugs are created equal. The system can quantify the revenue impact of each issue, so your engineers can focus on fixing the problems that are actively costing you money.
Prioritizing Security and Responsible AI
Bringing AI into your data stack understandably raises questions about privacy and data security. Any product intelligence platform worth its salt must be built on a security-first foundation. Critically, this means your customer data is never used to train global models, ensuring your proprietary insights stay yours and yours alone.
Look for these essential security practices:
- Robust Encryption: All data must be encrypted, both when it's stored (at rest) and when it's being moved (in transit).
- Data Anonymization: Personally identifiable information (PII) should be automatically masked or stripped out before analysis to protect user privacy.
- Responsible AI Guardrails: The models should be explainable, not a "black box," and designed to prevent bias. This ensures the insights you get are both reliable and ethical.
By combining the quantitative muscle of a traditional analytics platform with the qualitative depth of AI, you get the complete story. You can finally turn that chaotic stream of feedback into a prioritized, revenue-quantified action plan, giving your team the confidence to build what truly matters.
How Product Analytics Drives Real Business Value
Having powerful features is one thing, but the real magic happens when you apply them to solve actual business problems. Product analytics platforms aren't just for spitting out charts and reports. They are growth engines, plain and simple—tools built to help you reduce churn, find expansion opportunities, and finally bring some objective clarity to your product roadmap.
Let's dig into a few real-world examples. You’ll see how companies use this data to move from just reacting to problems to building a forward-looking strategy. At the end of the day, the goal is to master data-driven decision making and turn those user clicks into real business value.
Use Case 1: Reducing Customer Churn
Picture a B2B SaaS company that’s started to see a worrying uptick in cancellations. In the old days, they'd be stuck guessing. Was it a recent price hike? A new feature from a competitor? This kind of guesswork is slow, expensive, and usually wrong.
With product analytics, they can take a much smarter approach. They start by creating a behavioral cohort of all the users who churned in the last 60 days. Then, they compare that group's in-app behavior against a cohort of their most active, loyal customers.
A clear pattern emerges from the data. The users who left had a major drop-off in their usage of a specific core reporting feature about 30-45 days before they actually cancelled. They were still logging in, but their engagement with the tool’s most important workflows had nosedived. This wasn't a sudden decision; it was a slow fade.
Armed with this critical piece of information, the customer success team can finally get proactive.
- Early Warning System: They set up an automated alert that trips whenever a high-value account's usage of that key reporting feature drops by more than 50% over two weeks.
- Proactive Outreach: Instead of waiting for the dreaded cancellation email, the team now reaches out to these at-risk accounts with targeted help. They might offer a quick training session on advanced reporting or share a new guide to help them get more value.
This simple, data-driven workflow transforms the team from firefighters into fire marshals. They are no longer just reacting to churn; they are actively preventing it by spotting the earliest warning signs in user behavior.
Use Case 2: Driving Expansion Revenue
For most subscription businesses, expansion revenue—getting your current customers to spend more—is the most efficient way to grow. A product analytics platform is the perfect instrument for finding these hidden opportunities.
Let’s say a company offers a tiered plan where the free version has a limit on the number of projects you can create. The product team’s big question is: which free users are actually ready to upgrade?
Using event tracking, they monitor every single time a user hits the "project limit" paywall. It doesn't take long to spot a segment of free users who are running into this limit multiple times a week. These aren't casual visitors; they're power users who are clearly getting a ton of value and are actively trying to do more than their plan allows.
This segment is pure gold for the marketing team. They can now launch a hyper-targeted campaign offering only these specific users a special discount on an annual plan. Because the offer is both relevant and timely, the conversion rates are dramatically higher than they would be for a generic "Upgrade Now!" email blasted to everyone. This is a perfect example of turning a point of user friction into a revenue opportunity.
Use Case 3: Prioritizing the Product Roadmap
One of the toughest jobs for any product manager is deciding what to build next. Should the engineering team spend the next sprint fixing a dozen small bugs, building that one massive feature an enterprise client wants, or redesigning a clunky part of the UI? Too often, the decision is made based on who shouts the loudest.
An AI-driven product intelligence platform like SigOS completely changes that conversation. It connects what users are doing in the product with what they’re saying in support tickets and sales calls, and then it quantifies the revenue impact of every potential item on the roadmap.
For instance, the platform might find that a particular bug has been mentioned in support tickets from 30 different accounts. It then automatically cross-references that finding with CRM data and usage metrics, revealing that those 30 accounts represent $500,000 in annual recurring revenue.
Suddenly, the decision is simple. The product team can confidently prioritize fixing that bug over a shiny new feature requested by a single, smaller client. They've shifted from an opinion-based roadmap to one driven by clear ROI, ensuring their most valuable resources are always working on what matters most to the business.
Choosing and Implementing Your Analytics Platform
Picking and launching a new product analytics platform can feel like a massive undertaking. The truth is, success isn't about finding the tool with the flashiest features—it's about choosing the right one for your team and getting the implementation right from day one.

Think of it this way: the best platform is the one that your product managers and marketers will actually log into to find answers. If it’s too complicated or disconnected from your other tools, it’s destined to become expensive shelfware.
H3: Key Selection Criteria Beyond Features
It's easy to get lost comparing feature checklists. But from my experience, the platforms that deliver real value do three things exceptionally well, and they have nothing to do with flashy dashboards.
Focus on these practical, make-or-break criteria:
- Integration Capabilities: How well does this platform play with others? You need it to connect cleanly with your core tools, like your Salesforce CRM, Zendesk support desk, and engineering tools like Jira or Linear. A fragmented view of the customer journey is a recipe for bad decisions.
- Scalability: The platform must grow with you. Ask vendors tough questions about their pricing models. How do costs change when your event volume doubles? A tool that's affordable for a startup can become painfully expensive as you scale, forcing a costly migration down the line.
- Ease of Use: This is the big one. Can a non-technical person get a confident answer to a business question without filing a ticket with engineering? If your PMs can't build their own funnels and cohorts, the tool has already failed.
The real test for any platform is how quickly someone on the business side can move from a question to an insight. When that process is self-serve, you've struck gold.
To help structure your evaluation, a checklist is a great way to stay organized and compare platforms apples-to-apples.
Platform Selection Checklist
| Evaluation Criteria | Questions To Ask | Importance (High/Medium/Low) |
|---|---|---|
| Ease of Use | Can our product managers build reports without SQL or developer help? Is the UI intuitive? | High |
| Integration | Does it offer native integrations with our CRM, support, and data warehouse? | High |
| Scalability | What are the event volume limits? How does the price change as we add more users or data? | High |
| Data Governance | Does it have tools to manage event naming conventions and prevent messy data? | Medium |
| Support | What level of onboarding support is provided? Is customer support responsive and helpful? | Medium |
| Pricing Model | Is the pricing transparent and predictable? Does it align with our budget and growth plans? | High |
This checklist ensures you’re not just buying features, but a solution that fits your team's workflow and your company’s future.
H3: A Practical Four-Step Implementation Guide
A common mistake is rushing the implementation to "get the data flowing." This almost always leads to messy, untrustworthy data that nobody uses. A methodical, phased approach is your best bet for building a foundation of trust.
Here are the four essential steps:
- Define Your Business Questions Don't start by tracking everything you can. Start with the why. What questions do you absolutely need to answer right now? Is it "Why are users dropping off during onboarding?" or "Which features drive upgrades?"
- Create a Tracking Plan
This is your blueprint. Based on your questions, map out the key user actions (events) you need to track. For an onboarding flow, this might be a few simple events:
**User Signed Up**,**Profile Created**, and**First Action Completed**. Keep it simple and focused. - Implement the Code and Start Small Resist the urge to track every click. Begin with just one or two critical journeys. By focusing on a small, high-impact area first, you can ensure the implementation is flawless and start seeing value almost immediately.
- Validate Your Data This step is non-negotiable. Once the tracking is live, go through the user flow yourself and watch the events appear in the platform in real time. Does the data match your actions? If you can't trust the numbers, nothing else matters.
H3: Best Practices for Long-Term Success
Getting the platform live is just the starting line. Keeping it valuable requires a bit of discipline and teamwork.
First, establish strict data governance from day one. Create and enforce a consistent naming convention for all your events and properties (e.g., Object - Action like Button - Clicked). For more on this, it's worth reading up on how top companies manage their customer insights platforms.
Finally, don’t let the platform live in a silo. Create a small, cross-functional team—with folks from product, engineering, and maybe customer success—to "own" it. This group can champion its use across the company, train other teams, and ensure data becomes part of everyone's decision-making process.
Common Questions About Product Analytics
When teams first start looking into product analytics, the same few questions always seem to pop up. It's a big shift in thinking, so a little hesitation is completely normal. Let's walk through those common hurdles and clear them up so you can see the path forward.
We'll get practical about the real differences between toolsets, what it actually takes to get started, and how this all connects back to the bottom line.
How Is a Product Analytics Platform Different from BI Tools?
This is probably the most common—and important—question of all. While both platforms work with data and create reports, they are built for fundamentally different jobs and are meant for different people.
Think of a Business Intelligence (BI) tool like Tableau or Power BI as the company's wide-angle lens. It’s designed to pull in data from everywhere—finance, sales, marketing, operations—to give executives a high-level view of the entire business. Answering specific questions usually means getting in line for a data analyst to write custom queries.
A product analytics platform is a specialized microscope, built specifically for product managers, designers, and marketers. It zooms in on one thing: what users are doing inside your product. It comes with ready-made reports like funnel analysis, retention curves, and behavioral cohorts that don't require a single line of code.
What this means in practice is that a product manager can find out "Where are users dropping off during onboarding?" in just a few minutes, on their own. No need to file a ticket and wait for the data team.
How Much Technical Skill Is Needed to Use One?
This is another point that often trips people up. The real answer comes in two parts: the initial setup versus the day-to-day use.
Getting started does require a bit of a developer's time. They'll need to install a small code snippet and collaborate with the product team to map out the key user events you want to track. This could be a few hours of work or a few days, really depending on how complex your application is.
But once that one-time setup is done, modern platforms are built for non-technical people. Building a funnel, creating a user segment, and putting together a dashboard are all done through a visual, point-and-click interface. The whole point is to democratize data and stop making engineering the gatekeeper to insights. You definitely don't need a data science degree to figure out what your users are up to.
Can It Help Me Quantify the ROI of New Features?
Yes, absolutely. This is one of the core jobs of a product analytics platform and a primary reason teams bring one on board. It helps you move on from guessing about the value of a new feature to knowing its impact as a hard number.
Here’s a quick look at how that works:
- Adoption Tracking: You can instantly see how many people are actually using a new feature and how often they come back to it.
- Retention Impact: By creating two groups—one that used the feature and one that didn't—you can compare their retention rates side-by-side. Do the people who use this feature stick around longer? The data will tell you.
- Conversion and Upsell: You can finally measure if engaging with a certain feature makes a user more likely to pull out their credit card and upgrade to a paid plan.
More advanced, AI-driven platforms like SigOS can even take this a step further. By analyzing inputs like sales calls and support tickets, they can help quantify the revenue potential of a requested feature before you even build it. This gives your team a crystal-clear connection between their work and its financial return.
At SigOS, we connect user behavior to revenue impact, transforming messy feedback into a prioritized action plan. Discover how our AI-driven product intelligence can help you build what truly matters.
Keep Reading
More insights from our blog


Ready to find your hidden revenue leaks?
Start analyzing your customer feedback and discover insights that drive revenue.
Start Free Trial →