Product Development Insights: Drive Growth in 2026
Unlock actionable product development insights. Transform customer data & feedback into revenue-driving priorities with our 2026 guide.

Most advice on product work starts with the same instruction: listen to customers. That sounds sensible, but it's incomplete. If you treat every request, complaint, and interview quote as equally important, you don't get clarity. You get a crowded backlog.
In SaaS, the problem usually isn't lack of feedback. Support has tickets. Sales has call notes. Success has renewal risk signals. Product has analytics. The failure happens when teams confuse collection with insight. They pile up comments, tag themes, maybe run a quarterly survey, then still decide by gut feel in roadmap meetings.
Useful product development insights are different. They don't stop at "customers asked for X." They answer harder questions: Which pattern predicts churn? Which request appears inside expansion conversations? Which bug blocks activation for accounts that matter commercially? Until a team can connect feedback to behavior and business outcomes, it isn't prioritizing. It's reacting.
That shift also changes how you analyze feedback. Instead of reading everything manually, build a system that filters what matters. If you're refining your process for analyzing customer feedback, the goal isn't better note taking. It's turning scattered customer language into ranked evidence for action.
Beyond Listening to Customers
Why raw feedback misleads teams
The most common mistake product teams make is believing the loudest feedback is the most important feedback. It often isn't. High-volume complaints can come from low-value edge cases. Quiet friction inside onboarding can hurt retention far more, even if few users phrase it clearly.
Support teams see pain. Sales teams hear objections. PMs run interviews and gather feature requests. Each source matters, but none should drive roadmap decisions on its own. A single enterprise prospect can sound urgent. A long customer quote can feel persuasive. Neither proves commercial impact.
Practical rule: Feedback is a clue, not a conclusion.
What counts as a product development insight is narrower and more useful. It is a pattern that appears across inputs, matches observed behavior, and ties to an outcome the business cares about, such as retention, expansion, or adoption. That standard cuts through a lot of internal noise.
What actually deserves action
Teams usually improve when they stop asking, "What are customers saying?" and start asking:
- Which complaints repeat across segments? Not just repeated words, but repeated friction in the same journey stage.
- What do affected users do next? Do they abandon setup, reduce usage, open more support chats, or stall in procurement?
- Which accounts matter commercially? A request from a strategic account deserves a different lens than a request from a trial user with no product fit.
- Can we observe the same issue in product data? If a complaint doesn't show up anywhere in usage, the team should investigate before committing engineering time.
That last point is where many prioritization systems break. Teams talk about being customer-centric, then ship based on sentiment volume. Sentiment is useful for context, but sentiment alone won't tell you whether a fix protects renewal revenue or whether a feature request is tied to expansion.
The better operating model is simple. Treat feedback as raw material. Then score it against behavior, account value, and downstream business outcomes. Once you do that consistently, roadmap debates get shorter and much less political.
Finding Signal in Qualitative and Quantitative Data
A detective doesn't solve a case using only witness statements. Witnesses explain what they remember, what confused them, and what felt wrong. But the detective also needs camera footage, timestamps, and location data. Product teams need the same combination.
Qualitative data tells you why users are frustrated, confused, or excited. Quantitative data tells you what they did, at scale. The strongest product development insights come from joining the two, not choosing one over the other. That pairing is also recommended in this overview of data-driven product development, which argues that usage data and voice-of-customer inputs answer different questions and should map to explicit decision variables.

What each data type contributes
Qualitative sources usually include support tickets, chat transcripts, sales calls, interview notes, reviews, and open-text survey responses. They surface language, emotion, objections, and edge cases. They help you hear the user's version of the problem.
Quantitative sources include feature adoption data, funnel drop-off, error rates, seat expansion patterns, account activity, and operational metrics. They show frequency, sequence, and scale. They expose whether the problem is isolated or systemic.
A simple comparison helps:
| Data type | Best for | Weak on its own |
|---|---|---|
| Qualitative | Understanding intent, friction, and context | Measuring prevalence and business impact |
| Quantitative | Measuring behavior patterns and outcomes | Explaining motivation and nuance |
The trap is overcorrecting in either direction. Teams that lean only on interviews become anecdotal. Teams that lean only on dashboards become blind to motive.
Why filtering matters so much
A widely cited benchmark in product development is that only 1 in 7 product ideas becomes a successful product, and McKinsey-based summaries also report that only 1.5 of every 7 ideas launch while 1 succeeds. That makes early filtering a core product skill, not a nice-to-have, as summarized in this product development benchmark write-up.
If most ideas won't work, then every unfiltered request is a cost. It competes for design time, engineering capacity, and leadership attention. The point of combining qualitative and quantitative evidence is to reject weak ideas faster and support strong ones with confidence.
Good PMs don't just gather evidence. They ask whether the evidence changes the probability that acting will improve the business.
When teams need to analyze behavioral patterns over time, especially around activation, churn signals, or recurring support spikes, a resource like PlotStudio AI's time series guide can help frame how recurring events and trend changes should be interpreted. That's particularly useful when a complaint appears seasonal, release-driven, or concentrated after a workflow change.
Frameworks for Continuous Insight Discovery
Quarterly research projects create snapshots. Product teams need surveillance.
The most effective systems don't wait for someone to remember to export Zendesk tickets, review Gong calls, or pull Mixpanel charts before planning. They ingest signals continuously and look for patterns all the time. That matters because the best opportunities are often not the loudest complaints, but recurring behavior patterns that correlate with retention risk or high-value expansion, as discussed in this underserved-needs perspective.
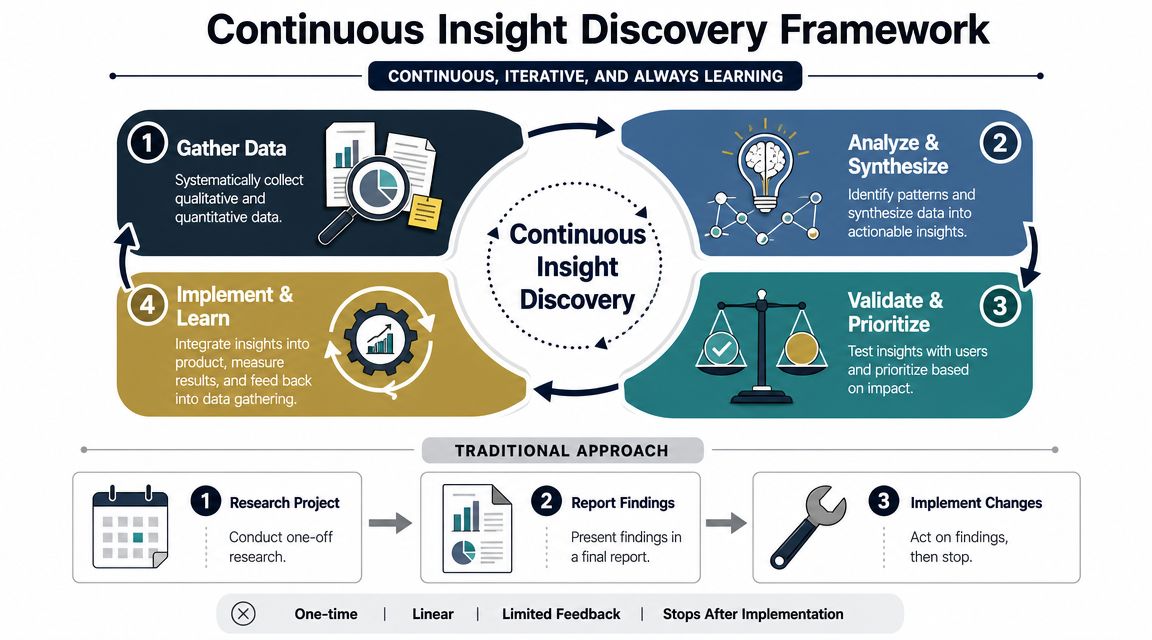
A practical operating model
A useful framework has four moving parts. Not a heavy process. A repeatable system.
- Ingest signals from operating toolsPull support conversations from Zendesk or Intercom, opportunity notes from Salesforce, call transcripts from sales tools, and product events from your analytics stack. The point isn't centralization for its own sake. It's making sure the same customer can be seen across channels.
- Normalize the inputsDifferent teams describe the same problem differently. Support may say "sync issue." Sales may say "integration blocker." Users may say "data didn't update." Normalization groups these into one trackable pattern.
- Correlate patterns with outcomes Insight discovery shifts from passive listening. The system should ask whether a repeated issue aligns with churn signals, stalled activation, low feature adoption, or expansion conversations.
- Surface ranked opportunitiesPMs shouldn't need to dig through five systems every morning. They need a shortlist: risks rising, opportunities emerging, and why each one matters.
What real-time detection changes
Traditional feedback programs tend to be slow and project-based. A PM schedules interviews. Research synthesizes findings. A deck gets shared. Then the organization moves on. Useful, but limited.
A continuous model behaves more like monitoring. It notices when a support issue starts appearing among new accounts. It notices when enterprise prospects repeatedly ask for the same capability in late-stage deals. It notices when a usage drop follows a workflow change.
That speed matters because churn and expansion signals don't arrive neatly packaged. They leak through behavior first.
Working principle: If a pattern can only be found through manual review, the team will discover it too late.
Teams that want a simple visual planning method can also learn from Rite NRG experts on opportunity solution trees. That approach is helpful when you've identified a recurring problem pattern and need to connect it to possible solution paths without jumping straight into delivery.
For teams building this capability with AI support, AI for product development is a useful lens because it shifts the conversation from one-off analysis to always-on pattern detection across customer and product data.
Key Metrics That Connect Insights to Revenue
Teams are still over-measuring the wrong things. They count request volume, tag frequency, or survey sentiment, then wonder why roadmap decisions still feel fuzzy. Those metrics describe noise levels. They don't explain financial consequence.
The harder question is the one leadership cares about: which issue is worth fixing first based on revenue impact? That's exactly the gap highlighted in this analysis of product insights and strategy, which notes that many teams gather feedback well but lack a rigorous method for dollar-weighted prioritization.
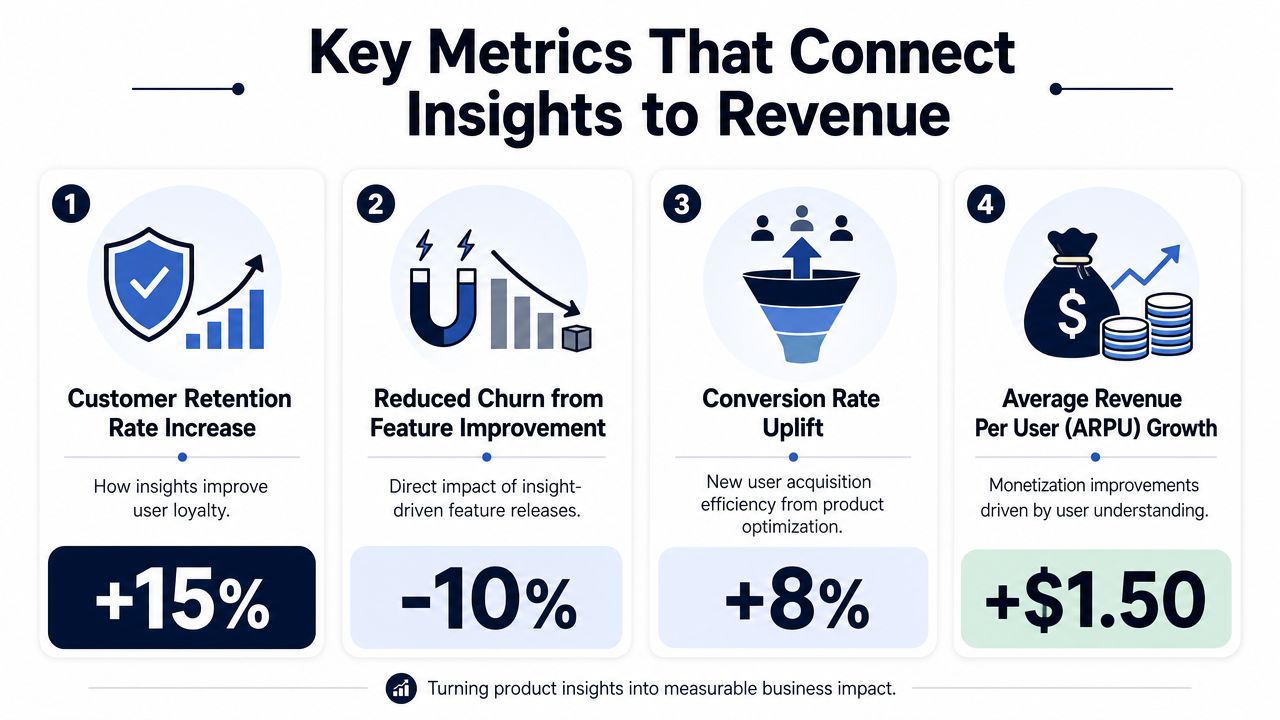
Four metrics that make prioritization defensible
These aren't accounting metrics. They're decision metrics. Each helps a product team translate a pattern into commercial language.
Revenue at risk
This estimates the value tied to accounts affected by a specific issue. If a bug shows up repeatedly among customers already showing low usage, open support cases, or renewal concern, the issue should be framed as retained revenue exposure, not just quality debt.
What works is narrowing this to a clearly defined cohort. New customers in onboarding. Multi-seat accounts using one workflow. Accounts with recent downgrade signals. What doesn't work is assigning broad financial narratives to vague product pain.
Expansion opportunity value
Some requests are not retention stories. They're growth stories. A capability may appear consistently in enterprise sales calls, procurement reviews, or customer success conversations tied to account growth. That request should be scored by the commercial value of the accounts asking for it and the stage of those opportunities.
This is one place where PMs often underweight sales data because it feels less "pure" than product analytics. That's a mistake. Sales objections can be noisy, but repeated objections from the right accounts often signal monetizable demand.
Churn correlation score
This measures whether a user behavior or issue pattern appears alongside cancellation, downgrade, or renewal risk often enough to deserve action. The key word is correlation. Not every annoying bug causes churn. Not every missing feature blocks growth. The discipline is testing whether a pattern shows up disproportionately in at-risk accounts.
A good score forces better conversations. Instead of saying, "Customers hate this workflow," the team can say, "Accounts that encounter this workflow problem also show weaker retention signals."
Adoption lift potential
Some fixes don't protect current revenue or generate new deals directly. They improve adoption of a feature that sits upstream of both. If a workflow is hard to discover, confusing to configure, or poorly connected to adjacent actions, improving it may increase downstream value realization.
This metric is useful for features that are strategically important but commercially indirect. It keeps teams from ignoring work that matters because the revenue connection isn't immediate.
A simple scorecard for roadmap reviews
A lightweight model often works better than a perfect one. In planning meetings, use a short scorecard like this:
| Metric | Core question |
|---|---|
| Revenue at risk | Which existing accounts are commercially exposed if we don't act? |
| Expansion opportunity value | Which growth conversations become easier if we solve this? |
| Churn correlation score | Does this pattern consistently appear in at-risk accounts? |
| Adoption lift potential | Will this increase use of a strategically important workflow? |
The fastest way to improve prioritization is to stop asking which item is loudest and start asking which item changes revenue, retention, or expansion.
If your delivery organization still leans heavily on output metrics, it's worth moving beyond velocity in agile. Throughput has a place, but it doesn't tell you whether the team is shipping the right work.
Practical Workflows for Prioritization and Alignment
Insight only matters when it changes execution. The handoff between analysis and delivery is where many teams lose momentum. A pattern gets noticed, someone posts a screenshot in Slack, a PM says they'll look into it, and the signal dies before it reaches Jira, Linear, or the roadmap.
The fix isn't another dashboard. It's an operational workflow with clear inputs, scoring rules, and ownership.
Start with data readiness
Strong data products require clear data requirements, KPI frameworks, and integration-ready pipelines before feature work begins, as outlined in this guide to building great data products. In practice, that means product teams need to define schema, freshness, and lineage for feedback and behavior inputs early.
If support tickets arrive with inconsistent account IDs, you can't tie complaints to revenue. If sales notes don't include opportunity stage, you can't separate casual asks from near-term expansion signals. If product events are poorly named, adoption analysis becomes guesswork.
Three requirements matter most:
- Schema discipline: Customer, account, event, and conversation records need a common structure.
- Freshness expectations: Teams should know whether data is near real time or delayed.
- Lineage clarity: Everyone should know where a score came from and which source systems informed it.
Without that foundation, automation creates false confidence.
The workflow that actually gets used
A practical operating flow looks like this:
- Detect a patternAn issue cluster appears across support, sales, or product usage. It is grouped into a clear problem statement rather than a pile of individual comments.
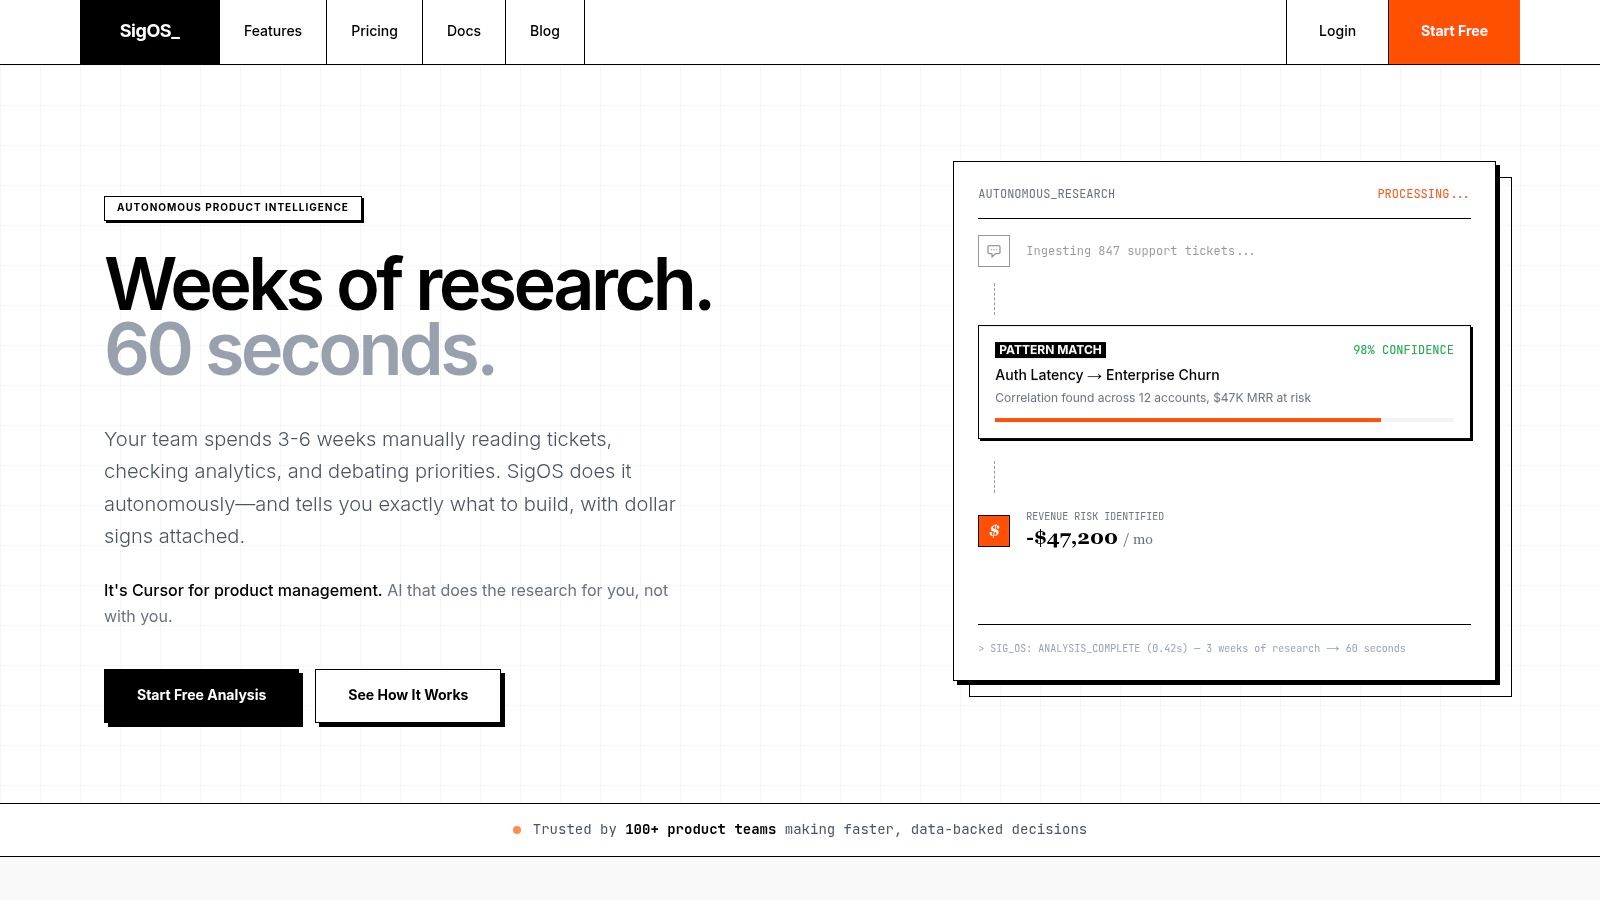
- Score the pattern Attach decision variables such as retention risk, adoption friction, or expansion relevance. One option, such as SigOS, can ingest support, sales, and usage data and attach a revenue impact score to emerging issues before a PM starts manual review.
- Create an execution artifactThe insight becomes a ticket in Jira or Linear with the context already attached: affected segment, supporting quotes, behavioral evidence, and commercial rationale.
- Review cross-functionallyProduct validates whether the problem is real. Engineering assesses complexity. Sales or success confirms whether the commercial framing matches live account conversations.
- Feed the outcome back into the systemAfter release, measure whether the issue stopped appearing and whether the target business outcome improved.
What a high-quality ticket includes
A weak ticket says, "Customers want better reporting."
A strong ticket includes:
- Problem statement: What exact friction occurred
- Who is affected: Segment, account type, or workflow cohort
- Behavioral evidence: What users did before and after the issue
- Commercial context: Risk to retention or relevance to expansion
- Source excerpts: Short quotes from support or sales that sharpen context
- Decision recommendation: Investigate, fix, redesign, or defer
A ticket should save a debate, not start one.
This is why a solid feature prioritization matrix still matters. The matrix becomes more credible when every item entering it already carries evidence tied to business outcomes, not just stakeholder opinion.
Real-World Impact and Getting Started
The clearest sign that a team has matured is simple. Backlog arguments get less emotional because the evidence gets better.
One common before-and-after pattern looks like this. Support keeps flagging a "small" onboarding issue. On its own, each ticket sounds minor. A few setup questions. A few complaints about confusion. Nothing that looks roadmap-worthy. But once the team groups the feedback, checks behavior, and looks at the affected cohort, the story changes. New accounts that hit that issue fail to complete a key setup step, then show weak early usage. The fix isn't prioritized because support is loud. It's prioritized because the pattern is linked to poor activation and likely retention risk.
A second pattern shows up on the growth side. Sales keeps hearing a request that product has been dismissing as niche. It appears in late-stage calls, security reviews, and expansion conversations with larger accounts. On its own, any single request sounds anecdotal. Combined with pipeline context and account value, it becomes a meaningful commercial signal. The resulting decision isn't "build what sales asked for." It's "invest in the capability because the request is consistently attached to high-value revenue conversations."
What changes when teams work this way
The best-performing companies in product innovation have an average success rate of 76%, compared with 51% for other companies, a 25-point gap highlighted in this product innovation summary. That doesn't mean every team needs a giant analytics program. It means better insight and prioritization processes compound.
A few practical changes usually follow:
- Roadmaps become easier to defend: PMs can explain why an item matters in business terms.
- Support and sales become stronger inputs: Their signals stop being treated as anecdotal noise.
- Engineering gets cleaner problem framing: Teams debate solution options, not whether the issue is real.
- Leadership sees product as a revenue partner: Not just the team that manages feature delivery.
The easiest place to start
Don't try to operationalize every signal at once. Pick one feedback channel and map it to one business metric.
A good first pass might be support conversations tied to churn risk, or sales requests tied to expansion likelihood. Define the pattern, connect the account data, review it weekly, and see whether the output changes what gets prioritized. That's enough to start replacing subjective prioritization with a system the rest of the company can trust.
If you're trying to turn customer feedback, support tickets, sales calls, and usage data into ranked product decisions, SigOS is built for that workflow. It helps teams connect qualitative signals to retention, expansion, and revenue impact so prioritization isn't driven by whoever spoke last in the roadmap meeting.
Keep Reading
More insights from our blog


Ready to find your hidden revenue leaks?
Start analyzing your customer feedback and discover insights that drive revenue.
Start Free Trial →