10 Product Differentiation Examples for 2026
Discover 10 real-world product differentiation examples from leading SaaS companies. Learn how to identify opportunities and replicate their success.
Apple’s revenue grew from 274.5 billion in FY2020 to 394.3 billion in FY2023, a 44% increase, while gross margins reached 44.1% in 2023, according to this breakdown of Apple’s differentiation strategy. That kind of performance is what strong product differentiation can do when it’s built into the product, the experience, and the surrounding system.
Differentiation is often discussed as if it’s branding polish or a killer feature. In practice, it’s much messier. Products stand out when teams identify a painful pattern before competitors do, fix a workflow others ignore, or remove friction buyers have accepted as normal. That’s why so many product differentiation examples are misunderstood. People copy the visible layer and miss the operating system underneath.
In SaaS, that mistake gets expensive fast. Features are copied quickly. Positioning claims blur together. Pricing pressure follows. If your only story is “we’re better,” you’ll eventually sound like everyone else. The stronger move is to build a product that gets sharper as it learns from customer behavior, support pain, usage drop-offs, sales objections, and expansion signals.
This is a key opportunity. Differentiation isn’t just what you ship. It’s how you discover what to ship, how quickly you recognize patterns, and how reliably you turn noise into action.
Teams trying to become an AI-first company need to think this way. AI only becomes a moat when it improves product judgment, speeds response time, and helps teams solve the right customer problems before competitors catch up.
Below are 10 practical product differentiation examples for SaaS teams. Each one matters on its own, but the bigger lesson is how to uncover these opportunities from customer signals. That discovery process is often the primary advantage.
1. AI-Powered Behavioral Analysis & Pattern Recognition
A lot of teams still treat feedback review like archaeology. Someone exports tickets, tags a few themes, reads call notes, and tries to infer what matters. That process misses weak signals and usually arrives late.
AI-powered behavioral analysis changes the game because it connects messy customer inputs to business outcomes. Support tickets, chat logs, sales calls, and usage events stop being separate artifacts. They become one pattern set.
What makes it different
The strongest version of this approach doesn’t just summarize complaints. It looks for recurring behaviors that align with churn, expansion, or stalled adoption. That matters because request volume is often misleading. Loud customers aren’t always the highest-value signal.
The more useful model is closer to pattern recognition than survey analytics. A team might discover that repeated confusion during onboarding, combined with a drop in feature activation and an increase in support contact, consistently appears before accounts weaken. Another team might find that a cluster of integration requests tends to show up in deals that later expand.
SigOS is built around this type of workflow, and its platform can correlate feedback to churn and expansion with 87% correlation accuracy. That’s the kind of capability that turns unstructured feedback into a practical prioritization engine.
Practical rule: Don’t ask AI to replace product judgment. Ask it to surface patterns humans won’t catch consistently at scale.
Slack and Notion are useful reference points here. Their differentiation didn’t come from feature volume. Their products changed workflows. Slack reduced communication friction through threading and notification structure. Notion let users consolidate documents, databases, and kanban boards in one flexible environment. The lesson is simple. Behavior change beats feature count.
To apply this well:
- Connect rich inputs: Include support, sales, and product usage, not just one feedback source.
- Check the model early: Compare AI-discovered patterns against a manual sample before teams trust them.
- Act on outcome signals: Prioritize patterns tied to churn or expansion, not the noisiest queue.
2. Revenue Impact Quantification & Scoring
Revenue scoring fixes a common product mistake. Teams treat every request as if demand alone should decide priority, even though some requests come from low-retention accounts, weak-fit prospects, or edge-case workflows that do not change the business.

The better approach is to score each issue against commercial impact. That means tying product friction to retention, expansion, onboarding success, and strategic segment fit. Once teams do that, differentiation stops being a brainstorming exercise and becomes a repeatable discovery process. You can see the operating model in strong real-time data analytics workflows, where usage signals and customer feedback are evaluated together instead of in separate queues.
What scoring changes inside a product org
A useful scoring model asks four questions. Which customers are affected? What revenue is at risk or available? Where in the journey does the issue appear? Does solving it strengthen the product for the segment you want more of?
Those questions change the conversation fast. A bug that blocks activation for new enterprise accounts usually deserves more attention than a loudly requested feature from long-tail customers who rarely expand. A repeated complaint from high-value accounts during implementation can matter more than a larger volume of low-stakes requests in mature accounts. This is how teams find real differentiation opportunities. They look for frictions that show up before churn, during failed onboarding, or inside accounts with clear expansion potential.
A good starting point is to study how revenue intelligence changes prioritization decisions, then build that logic into roadmap reviews, sprint planning, and escalation rules.
I have found that simple scoring models usually beat complicated ones early on. If a team cannot explain the score in one minute, nobody will trust it when priorities get political.
Use a scoring discipline like this:
- Score by account value: Weight issues based on ARR, expansion likelihood, renewal timing, and strategic fit.
- Use behavior, not request volume: Give more weight to friction tied to failed activation, repeated support contacts, low adoption, or stalled rollouts.
- Check for pattern recurrence: Prioritize issues that appear across multiple high-value accounts, not one-off requests from a single customer.
- Include delivery cost: A high-impact item that takes six weeks may still lose to a medium-impact fix you can ship this sprint.
- Review the model against outcomes: Compare past scores to churn, expansion, and support load so the model improves over time.
If a request cannot be connected to observed behavior, retention risk, or expansion potential, it should not outrank issues that can.
This is also where many teams miss the trade-off. Revenue scoring should guide judgment, not replace strategy. If you let near-term deal pressure dominate every cycle, the roadmap turns into custom work for the loudest account. Strong product teams protect the core product while still acting quickly on issues that clearly affect revenue.
3. Multi-Source Data Integration & Normalization
Teams that connect support, usage, CRM, and delivery data find differentiation opportunities faster because they can see what customers say, what they do, and where they get stuck in one view.
Support has Zendesk. Success has call notes. Sales has CRM fields and transcripts. Engineering has Jira and GitHub. Product has usage analytics. Each function sees a valid slice of the customer experience. The problem is that product decisions get made from partial evidence, so the team mistakes isolated requests for market signals.

Why normalization matters more than another dashboard
A fragmented stack creates false confidence. Every team has reporting, but each report uses different account names, feature labels, timestamps, and definitions of “active” or “at risk.” That breaks the discovery process. You cannot spot a real differentiation opportunity if the same customer appears as three records and the complaint taxonomy changes by tool.
Normalization creates the operating layer that makes cross-signal analysis trustworthy. A support complaint can be tied to a release. A feature request from sales can be checked against actual product usage. An expansion idea can be weighed against onboarding friction, unresolved bugs, and time-to-value for the same segment. That is how teams move from collecting feedback to finding patterns worth building around.
I’ve seen this change roadmap conversations quickly. Once the product team can connect repeated objections from sales with low adoption in the same workflow, the discussion shifts from “Should we add this feature?” to “Is this friction common enough, costly enough, and fixable enough to become a real product advantage?”
Start smaller than your architecture diagram suggests. In practice, the first useful integration is often support plus usage, or support plus CRM, because those pairings expose where stated pain matches observed behavior.
A workable setup usually includes:
- One shared customer key: Use a consistent account or workspace ID across systems before you add more sources.
- A common event and feedback taxonomy: Normalize feature names, issue types, and lifecycle stages so teams are comparing the same thing.
- Timestamp alignment: Match events, tickets, calls, and releases on a consistent time standard.
- Data freshness rules: Set acceptable sync windows by use case. A weekly sync may work for planning, but not for intervention.
- Source-level confidence checks: Flag missing fields, duplicate records, and low-quality joins before they pollute prioritization.
The trade-off is real. More sources increase coverage, but they also increase mapping work, failure points, and time spent arguing over definitions. Early on, I prefer narrower integration with cleaner joins over broad ingestion with weak identity resolution. Clean joins beat flashy reporting every time.
Teams building this capability usually end up adopting real-time data analytics in product workflows because static reporting cannot keep up once signals start arriving from multiple systems.
If ticket data, account data, and event data do not line up, the team will keep shipping based on anecdotes. If they do line up, product differentiation stops being a brainstorm exercise and becomes a repeatable discovery process.
4. Real-Time Automated Alerts for Churn Risk & Opportunities
Dashboards are useful. They’re also passive. Someone has to remember to open them, interpret them, and decide whether the signal matters. By then, the window to act may already be shrinking.
Real-time alerts are different because they turn pattern detection into operational response.
Where alerts create real separation
The point isn’t to notify people about everything. Bad alerting creates fatigue and teaches teams to ignore the system. Good alerting watches for combinations that deserve intervention now.
That might mean flagging a strategic customer whose support complaints suddenly cluster around one workflow. It might mean notifying sales when a repeated integration request shows up across active late-stage deals. It might mean pulling engineering into a reliability issue before the churn conversation starts.
The products that pull ahead in crowded markets don’t just have stronger technology. They make the advantage feel immediate in the customer workflow. That’s especially important in AI-powered SaaS, where raw model quality often matters less than whether the product helps teams act faster and with more confidence.
For teams building that muscle, real-time data analytics in product workflows is the operating model to study. The important shift is from retrospective reporting to live intervention.
Here’s where teams usually get this wrong:
- They alert on single events: One complaint rarely means much.
- They skip ownership: Every alert type needs a clear responder.
- They ignore confidence: Early systems should focus on fewer, higher-confidence patterns.
Field note: An alert without an owner is just a louder dashboard.
One more lesson matters here. Competing on price rarely creates a durable SaaS position. The stronger move is to detect value moments and risk moments before buyers reduce your product to a commodity. Real-time pattern alerts support that by helping teams intervene while context still exists.
5. Continuous Behavioral Analysis Without Manual Feedback Tagging
Manual tagging breaks at scale. It starts with good intent. Product ops creates categories, support tags tickets, PMs review themes weekly, and everyone hopes the taxonomy stays clean. It rarely does.
People interpret labels differently. Categories drift. New issues don’t fit the old structure. Then the analysis becomes more about cleaning inputs than learning from customers.
Why automation changes the economics
Continuous behavioral analysis removes a lot of that admin burden. Instead of forcing teams to pre-sort everything, the system identifies clusters and patterns from raw text and behavior streams. Similar bug reports can be grouped even when customers describe them differently. Related friction points can surface even if one came from chat, another from a call transcript, and a third from a sales note.
That matters because differentiated products often emerge from pattern accumulation, not single requests. You don’t discover the next wedge by reading one angry ticket. You discover it by noticing the same obstacle repeated across customer types, lifecycle stages, and workflows.
This is also where teams can confuse output with learning. A perfectly tagged board feels organized. It doesn’t guarantee insight. In many cases, the taxonomy itself starts to shape what the team is capable of seeing.
A more resilient setup looks like this:
- Use manual review as calibration: Check whether automated grouping matches what domain experts would conclude.
- Let teams correct the model: Corrections improve trust and reduce repeated misclassification.
- Store discovered patterns: Build an internal record of recurring friction and growth themes.
Patagonia offers a useful contrast from outside SaaS. Its quality positioning works because the company backs it with a systematic commitment, not a slogan. The same principle applies here. Automated analysis becomes differentiation only when it’s part of a consistent operating system for decision-making, not a one-off AI feature bolted onto feedback management.
6. Encrypted Security-First Architecture with Zero Customer Data Retraining
Some product differentiation examples are visible in the interface. Others win deals before the customer ever logs in. Security architecture falls into that second category.
In AI-powered SaaS, trust is now part of the product. Enterprise buyers want the upside of intelligence without the fear that their proprietary data becomes training fuel for someone else’s model. If you can’t answer that concern clearly, your product looks risky no matter how polished the UX is.
Why privacy can be the differentiator
A security-first architecture matters most when the customer data is sensitive, commercially valuable, or tightly regulated. Think healthcare feedback, financial operations data, customer support records, contract language, or internal product discussions. In those environments, “we use AI responsibly” isn’t enough. Buyers want architectural clarity.
That’s why a zero-retraining stance can create meaningful separation. If the platform analyzes customer data without using it to retrain underlying models, the trust conversation changes. Legal review gets simpler. Security teams have fewer open questions. Internal champions have a stronger case.
The broader market trend also supports this. In AI SaaS, technology only pulls ahead when users can feel the workflow advantage. Security-first design is part of that feeling. It lets product teams use intelligence in places where competitors trigger compliance resistance.
Good execution here includes a few essential requirements:
- Publish security details: Buyers need documentation, not vague assurances.
- Support deletion workflows: Customers should know how their data is removed.
- Explain model boundaries clearly: Say what the system does and does not do with customer data.
You can see how this positioning works in practice through WhisperAI's encrypted security-first architecture. The lesson isn’t limited to one vendor. When trust is scarce, privacy design becomes product design.
I’ve watched security become a deciding factor in categories where vendors assumed feature depth would carry the deal. It doesn’t. Not when the customer worries about exposure more than capability.
7. Automated Issue Creation with Revenue Impact Scores in Native Tools
Insight dies in handoff. That’s one of the most common product org failures.
Support identifies a pattern. Product agrees it matters. Someone writes a summary. Another person translates it into a Jira ticket. Context gets stripped out, urgency becomes subjective, and engineering sees yet another loosely framed request.
Automation can turn that weak handoff into a differentiator.
What good workflow integration looks like
The best systems create issues directly inside the tools teams already use, with enough context to act immediately. That means the bug or feature request doesn’t arrive as a vague note. It arrives with customer evidence, related conversations, affected accounts, and business impact signals attached.
When this works, product intelligence stops being a separate reporting layer and becomes part of day-to-day execution. Engineers stay in Jira, GitHub, or Linear. PMs don’t spend hours reformatting customer pain into backlog language. Support doesn’t have to lobby manually for repeated issues.
Product differentiation examples often look glamorous from the outside, yet the edge usually stems from internal execution speed. Teams that move from signal to issue faster solve customer pain faster.
A few operating rules make this reliable:
- Match native templates: Auto-created issues should follow the same structure engineers already expect.
- Attach evidence: Include supporting customer context, not just a title and score.
- Set response rules: High-impact issues need defined triage paths.
There’s also a trust angle here. If your product automates action in core development tools, customers will ask whether that workflow is secure. That’s where a documented posture like WhisperAI's encrypted security-first architecture becomes relevant as a benchmark for what modern buyers expect from AI-enabled systems interacting with sensitive operational data.
A practical test is simple. If an auto-created issue lands in engineering and no one asks, “what does this mean?” then the integration is doing its job.
8. Daily Executive Dashboard with Top Revenue-Impact Insights
Executives make high-cost product decisions with limited attention. A daily dashboard earns its place only if it reduces that decision load and points to the few signals that are worth action now.
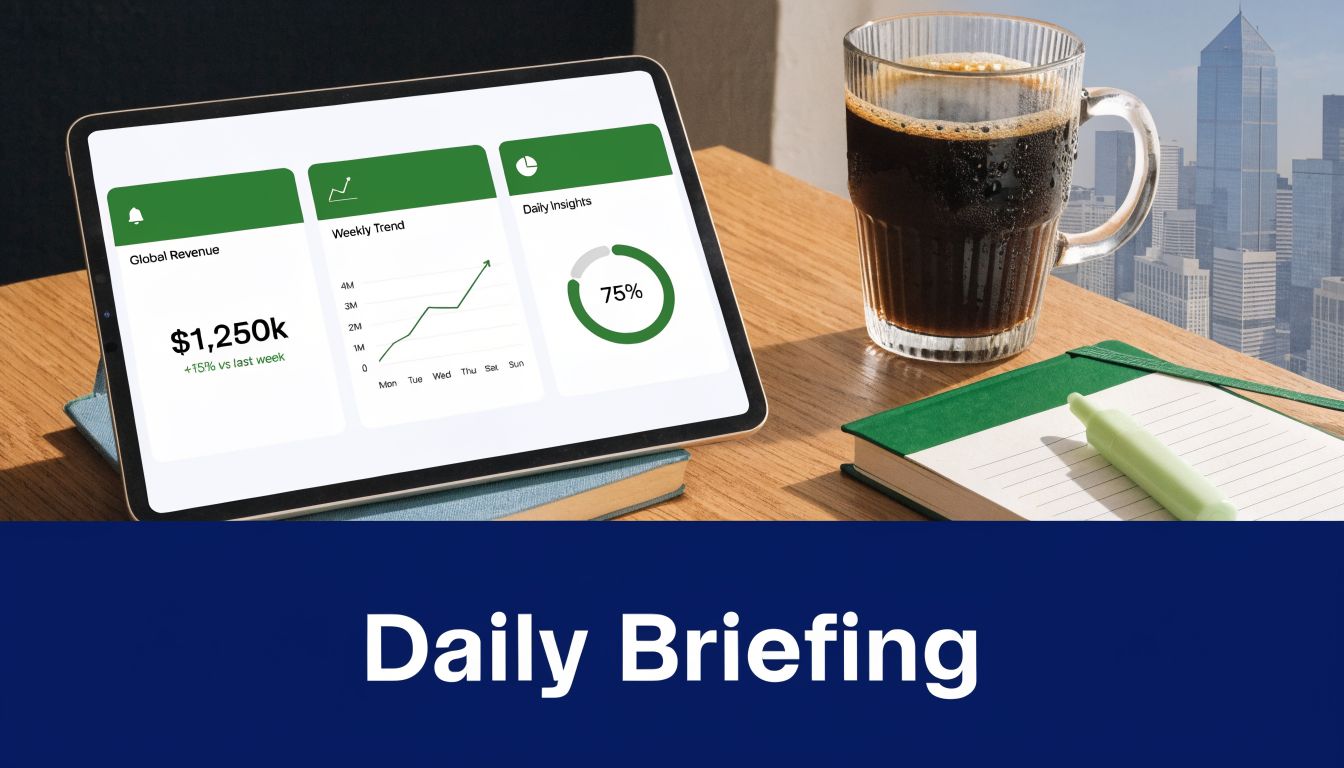
The differentiator is not the dashboard itself. Plenty of products can display charts. The primary edge comes from how the system identifies, ranks, and explains revenue-impact signals drawn from behavior data and customer feedback. That discovery layer is what turns a reporting surface into an operating tool.
Daily cadence matters because it matches executive work. Leaders rarely need a fresh view of everything. They need a sharp read on what changed since yesterday, which accounts or segments are affected, and whether the issue points to churn risk, expansion potential, or a product gap that deserves a decision.
A useful executive dashboard should answer four questions in under a minute:
- What changed? A clear summary of new risks, opportunities, or shifts in customer behavior.
- Why does it matter? Estimated revenue exposure, account concentration, or retention impact.
- What is driving it? The underlying pattern across usage, support, calls, or feedback.
- What should happen next? A recommended owner, decision, or follow-up path.
That last part gets missed often. I have seen teams ship dashboards that look polished but create more work because leaders still have to ask analysts or PMs to interpret the signal. If the dashboard cannot connect the insight to a likely action, it is still halfway to useful.
The best versions are opinionated. They rank the top few items by business impact, then let executives inspect the evidence if needed. That ranking discipline matters because leadership meetings often fail for a simple reason. Sales, support, product, and success each bring a different version of reality. A shared daily view, built from normalized signals across those systems, reduces that drift.
Apple is a useful mental model here, even without turning this into a consumer-tech comparison. Its advantage comes from connecting product decisions to a broader customer system, not treating each interaction as an isolated event. SaaS teams should apply the same principle internally. An executive dashboard should not stop at "feature usage is up" or "ticket volume is down." It should show which behavior patterns strengthen retention, which complaints correlate with stalled expansion, and which customer segments need attention before revenue moves the wrong way.
Good dashboard design usually includes:
- A ranked top five: Force prioritization.
- Evidence on click: Call excerpts, support themes, usage drops, and affected accounts.
- Segment context: Separate enterprise, mid-market, and SMB patterns so leaders do not react to blended averages.
- Decision framing: Flag whether the signal suggests product investment, customer intervention, or monitoring only.
- Cadence fit: Daily for fast-moving products, weekly for slower buying cycles.
Warby Parker’s Home Try-On succeeded because it removed a key decision barrier. A strong executive dashboard does the same inside the company. It removes analysis friction, so leaders can spend their time choosing a response instead of debating what the signal means.
9. Cross-Signal Correlation Identifying Hidden Churn and Growth Drivers
Single-source analysis misses the patterns that shape retention and expansion.
I’ve seen teams react to a spike in support tickets, only to find later that the underlying problem was a messy onboarding path for one segment. I’ve also seen leaders panic over lower feature usage when the healthier interpretation was different. Customers were shifting toward advanced workflows, asking harder questions, and getting ready to expand. The difference came from correlating signals instead of reviewing each stream in isolation.
That is the practical lesson behind strong product differentiation examples. The product advantage is not only the feature itself. It is the team’s ability to discover which behaviors, complaints, and requests matter before competitors see the pattern.
Correlation finds the opportunity behind the symptom
A single signal usually produces noise.
Support sentiment can reflect a temporary incident. Sales calls can overrepresent prospects with unusual objections. Usage data can hide friction if customers are still forcing adoption through a broken workflow. Correlation improves the read because it asks a better question: which combinations show up together before churn, expansion, stalled rollout, or stronger adoption?
That shift matters. It turns feedback review from reporting into discovery.
For example, a customer cohort may look stable on login frequency alone. Add implementation notes, repeated training questions, and delayed time-to-value, and the picture changes. The risk was already there. It was just distributed across systems that no one examined together.
The same method works in the other direction. A rise in support volume is not always bad news. If those conversations cluster around API limits, admin controls, or multi-team workflows, that pattern can point to deeper product adoption and a near-term expansion motion.
How teams actually uncover these differentiation opportunities
Cross-signal correlation works best when teams treat it as a repeatable operating method, not a one-off analysis project.
Use this sequence:
- Start with an outcome: Pick one business event to study first, such as churn in the first 90 days, stalled expansion, or unusually fast activation.
- Pull the signals around that event: Include product usage, support themes, call notes, onboarding milestones, NPS comments, renewal risk flags, and account changes.
- Look for combinations, not isolated indicators: A single complaint rarely matters. Repeated confusion plus low setup completion plus reduced admin activity often does.
- Check by segment: Enterprise, mid-market, and SMB accounts often produce different patterns. Blended analysis hides useful differences.
- Turn the pattern into a test: Change onboarding, adjust the product surface area, update success outreach, or prioritize a roadmap fix. Then measure whether the correlated risk drops.
Many teams often get stuck. They collect feedback, tag tickets, and build dashboards, but they never connect the signals tightly enough to identify a product wedge competitors will miss.
The trade-off is complexity
Correlation adds decision quality, but it also raises the bar for data hygiene and interpretation. Weak normalization creates false patterns. Small sample sizes create false confidence. Teams also overfit fast if they assume every repeated combination is causal.
Handle that risk with a few operating rules:
- Pressure-test surprising correlations with frontline teams: Support, success, and sales can confirm whether the pattern matches account reality.
- Recheck after product changes: A strong correlation can disappear once onboarding, packaging, or UX changes.
- Prioritize patterns tied to money or retention: Interesting relationships are not enough. Focus on the ones linked to churn, expansion, activation, or cost to serve.
The teams that do this well build a harder-to-copy advantage. Competitors can replicate visible features. They have a much harder time replicating a discovery process that consistently finds hidden churn drivers and unexpected growth signals before they become obvious.
10. Sub-Minute Analysis Velocity Enabling Responsive Decision-Making
A feedback signal that sits for 24 hours usually loses its highest-value context. The customer has moved on, the internal thread has cooled, and the team is left interpreting a stale summary instead of responding to a live problem.
That speed gap changes the kind of differentiation a company can build.
Teams that can process behavior and feedback in under a minute can do more than react faster. They can test faster, route faster, and learn faster. That matters because differentiation rarely comes from a single insight. It comes from a repeated discovery loop: detect the pattern, confirm it with customer evidence, estimate the revenue impact, and ship a response while the signal is still relevant.
Why analysis velocity changes product decisions
Slow analysis pushes teams toward batch thinking. They review trends in weekly meetings, merge unlike issues into broad themes, and prioritize based on whatever stayed visible long enough to make the deck. Fast analysis supports a different operating model. Product managers can review a new pattern the same day it appears, ask support for account context, and decide whether the issue belongs in onboarding, UX, pricing, or roadmap triage.
That distinction matters in crowded SaaS categories. Competitors can copy visible features. They struggle to copy an operating cadence that helps a team find and act on emerging friction before it spreads.
I have seen this trade-off firsthand. Fast insight without a response path creates noise. Slow insight with perfect rigor creates missed windows. The practical target is sub-minute detection paired with clear ownership.
Use these rules to make speed useful:
- Set routing rules before you scale alerts: Decide which signals go to product, support, success, or sales, and define the trigger for each path.
- Tie fast signals to a business threshold: A pattern should reach a human because it affects activation, retention, expansion, or support load, not because the model found something interesting.
- Preserve raw evidence with the summary: Teams need the underlying comments, session patterns, or account history to verify that the signal is real.
- Measure time to action, not just time to analysis: If insight arrives in 30 seconds but sits untouched for three days, the operating advantage is gone.
The main opportunity is discovery. Sub-minute analysis helps teams catch small behavioral shifts and feedback clusters early enough to examine them before they flatten into a generic "customer issue" bucket. That is how product differentiation opportunities surface in practice. Not from a brainstorm, but from repeated, fast comparisons between what customers say, what they do, and what those signals are worth.
Speed strengthens every other capability in this stack. Better pattern recognition matters more when teams can inspect it immediately. Revenue scoring matters more when it informs action before churn risk hardens. Data integration matters more when the combined signal reaches the right team while a decision can still change the outcome.
Top 10 Product Differentiation Features Comparison
| Solution | Implementation Complexity 🔄 | Resource Requirements ⚡ | Expected Outcomes ⭐📊 | Ideal Use Cases 💡 | Key Advantages ⭐ |
|---|---|---|---|---|---|
| AI-Powered Behavioral Analysis & Pattern Recognition | 🔄 High, ML models + integrations and baseline tuning | ⚡ Medium–High, data volume, ML infra, integrations | ⭐📊 Predictive churn/expansion (87% corr.), continuous revenue scoring | Product teams with large unstructured feedback streams | Automated pattern detection, revenue-impact prioritization |
| Revenue Impact Quantification & Scoring | 🔄 Medium, modeling to map issues to revenue | ⚡ Medium, historical revenue data and validation | ⭐📊 Monetary prioritization, ROI-driven roadmap decisions | Roadmap prioritization, finance-aligned product decisions | Justifies decisions with financial metrics; aligns teams |
| Multi-Source Data Integration & Normalization | 🔄 High, API connectors, mapping, normalization | ⚡ High, engineering effort, ongoing maintenance | ⭐📊 Single source of truth enabling cross-source analysis | Organizations with many SaaS tools and siloed data | Eliminates manual consolidation; provides full customer context |
| Real-Time Automated Alerts for Churn Risk & Opportunities | 🔄 Medium–High, real-time detection + alert routing | ⚡ Medium, streaming infra and notification integrations | ⭐📊 Faster response to risks/opps; reduced time-to-action | High-velocity support, growth and sales ops | Immediate, context-rich alerts tailored to stakeholders |
| Continuous Behavioral Analysis Without Manual Feedback Tagging | 🔄 Medium, NLP and self-learning pipelines | ⚡ Medium, sufficient data volume and model upkeep | ⭐📊 Reduced manual work; unbiased continuous discovery | Teams wanting to eliminate tagging at scale | Scales analysis; uncovers unexpected patterns automatically |
| Encrypted Security-First Architecture with Zero Customer Data Retraining | 🔄 High, encryption, compliance, isolation of models | ⚡ High, security engineering, audits, possible perf cost | ⭐📊 Enterprise-grade privacy, reduced compliance risk | Regulated industries (finance, healthcare, large enterprises) | Protects customer data; avoids retraining on customer inputs |
| Automated Issue Creation with Revenue Impact Scores in Native Tools | 🔄 Medium, connectors + templating for tickets | ⚡ Medium, API creds, mapping to workflows | ⭐📊 Faster handoff to engineering; prioritized actionable tasks | Dev teams using Jira/Linear/GitHub; product-ops workflows | Eliminates manual ticketing; embeds revenue context in issues |
| Daily Executive Dashboard with Top Revenue-Impact Insights | 🔄 Low–Medium, curation + dashboarding | ⚡ Low, analytics + UX maintenance | ⭐📊 Executive-focused prioritized briefings; time saved | Executives needing daily briefings and quick decisions | Delivers concise, prioritized insights; saves analysis time |
| Cross-Signal Correlation Identifying Hidden Churn and Growth Drivers | 🔄 Very High, multi-signal correlation and causal inference | ⚡ High, data maturity, data science expertise | ⭐📊 Root-cause discoveries; uncovers compound drivers | Complex products with many interacting signals | Reveals non-obvious correlations; supports scientific decisions |
| Sub-Minute Analysis Velocity Enabling Responsive Decision-Making | 🔄 High, optimized real-time pipelines and tooling | ⚡ High, streaming infra, monitoring, performance tuning | ⭐📊 Immediate insights and live prioritization; faster reactions | Systems needing instant detection (payments, critical UX) | Enables same-day responses; competitive speed advantage |
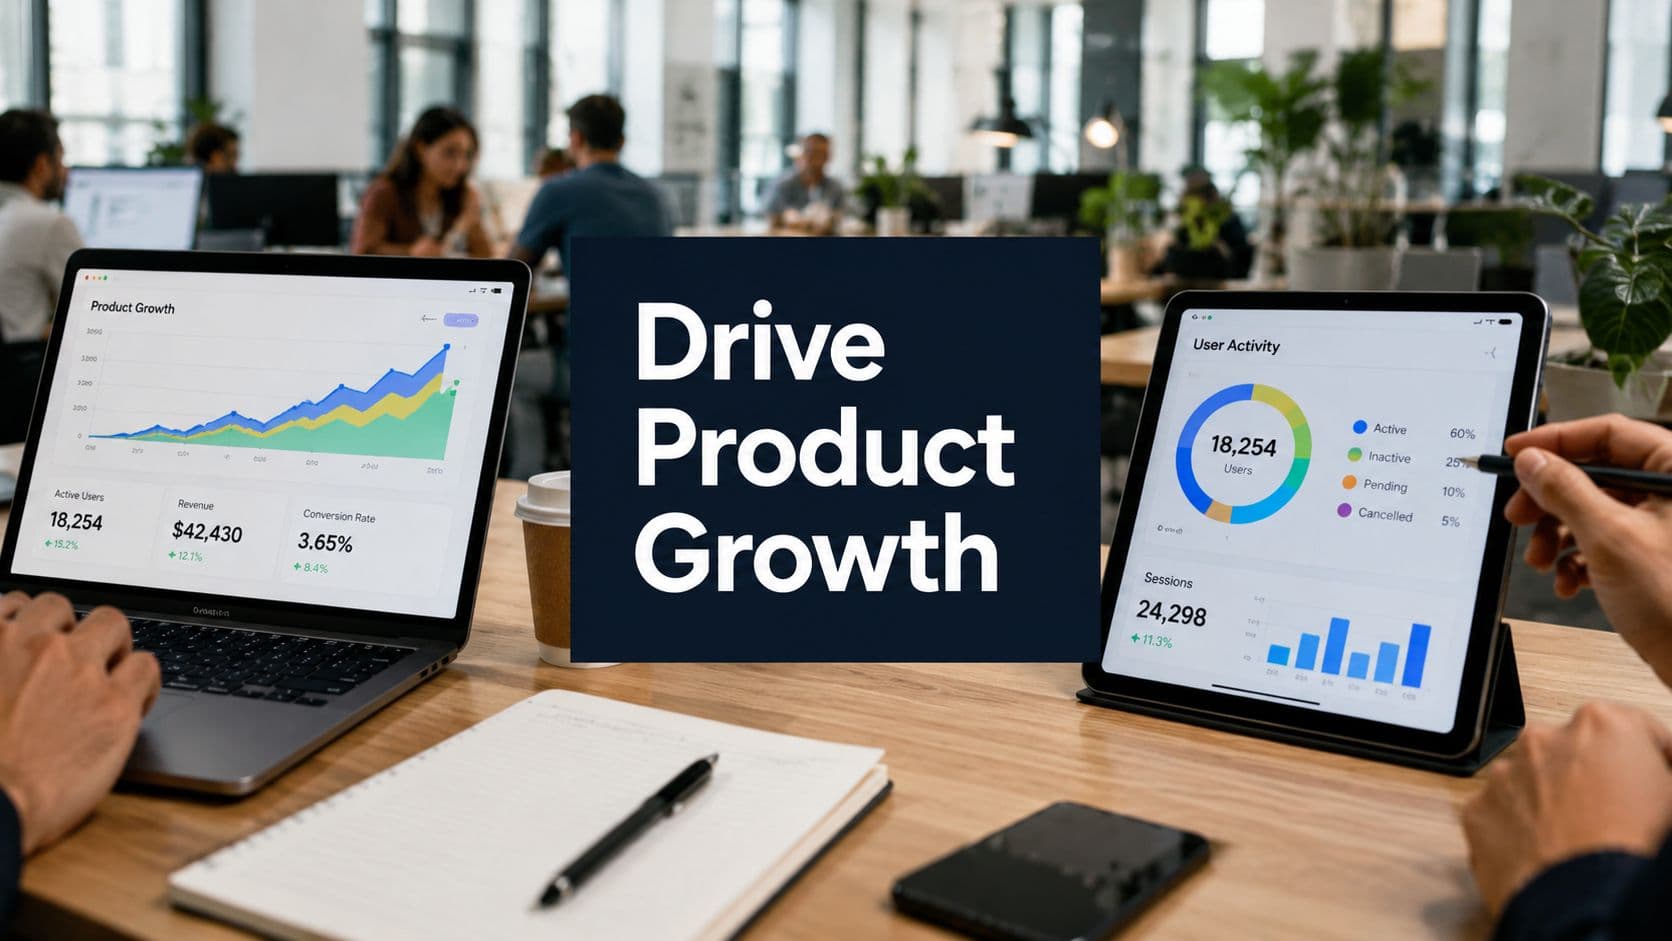
Turn Signals into Strategy
The best product differentiation examples don’t start with brainstorming sessions about how to appear different. They start with disciplined observation. Teams notice a recurring friction point, connect it to business impact, and build a better system around it than anyone else in the category.
That’s the shared DNA across the examples above.
AI-powered pattern recognition matters because it catches what manual review misses. Revenue scoring matters because it gives cross-functional teams a common prioritization language. Multi-source integration matters because customer truth is usually fragmented across support, sales, engineering, and product systems. Real-time alerts matter because timing changes outcomes. Security-first architecture matters because trust is now part of the product. Automated issue creation matters because insight without execution is just reporting. Daily dashboards, cross-signal correlation, and sub-minute analysis velocity all serve the same bigger goal. They help teams move from noise to action with less delay and less guesswork.
That’s the playbook.
Start by unifying the data you already have. Most companies don’t need more input volume. They need a cleaner view across the systems they already use. Pull together support conversations, usage signals, sales objections, roadmap items, and engineering issues into one layer that can be analyzed together.
Then quantify impact. Don’t rely on request counts alone. Ask which issues show up near churn, stalled onboarding, delayed activation, lost confidence, or expansion momentum. If a pain point affects strategic accounts or repeatedly interrupts a critical workflow, it deserves more weight than a louder but lower-value theme.
Next, tighten the loop between discovery and execution. Many teams fail here. They generate insights but don’t operationalize them. Product managers still rewrite context manually. Engineers still receive low-quality tickets. Executives still get too much data and not enough ranking. Differentiation gets stronger when the system itself makes action easier.
There’s a cultural shift buried inside all of this. Product teams have to stop treating feedback as a collection exercise and start treating it as a signal system. The job isn’t to gather more comments. The job is to identify which patterns predict customer behavior, which frictions destroy value, and which improvements create habit, trust, and switching cost.
That’s also why “better” is such a weak ambition. Better is subjective and easy for competitors to claim. Different is more durable when it’s grounded in how your team discovers truth faster, prioritizes more intelligently, and solves customer problems in ways that compound over time.
Platforms like SigOS are built for this model. But the underlying mindset applies whether you use a dedicated platform, a custom stack, or a transitional workflow inside your existing tools. Build a system that listens continuously, connects signals across sources, ranks issues by business impact, and routes action into the tools your team already uses.
That’s how product differentiation stops being a slogan and starts becoming an operating advantage.
If your team is drowning in support tickets, scattered feedback, and roadmap debates driven by the loudest voice, SigOS gives you a practical way to prioritize what is essential. It connects customer signals across support, sales, and usage data, identifies patterns tied to churn and expansion, and helps teams act on revenue-impact insights instead of guesswork.
Keep Reading
More insights from our blog


Ready to find your hidden revenue leaks?
Start analyzing your customer feedback and discover insights that drive revenue.
Start Free Trial →