Product Research Surveys That Drive Revenue
Master product research surveys. Learn to design, analyze, and integrate survey data with product intelligence to prioritize features that impact revenue.

Most advice about product research surveys starts with the same line: listen to customers.
That advice is incomplete.
Product teams rarely fail because they ignored feedback. They fail because they collected too much of the wrong kind, from the wrong users, at the wrong moment, then treated every response as equal. A feature request from a casual evaluator gets stacked next to a complaint from a high-value account. A loud anecdote outranks a quiet pattern. Survey results become a report, not a decision system.
That is why product research surveys still matter, and why they are not enough on their own. They give structure to customer input. They force teams to ask consistent questions, compare responses across segments, and validate a hypothesis at scale. There is a reason online surveys are the most widely adopted quantitative research method, used regularly by 85% of market research professionals according to Backlinko's market research statistics roundup. Surveys are fast, scalable, and operationally simple.
But the teams that get real value from them do something more disciplined. They connect survey responses to product usage, support signals, account context, and commercial outcomes. They stop asking only, “What did users say?” and start asking, “Which signal predicts churn, expansion, activation, or stalled adoption?”
That change sounds subtle. In practice, it changes everything.
A survey should not end at a dashboard full of scores. It should feed a prioritization model. It should help a PM decide whether to fix onboarding friction, rework a workflow, or ignore a popular request that has no commercial weight. It should help support leaders separate isolated frustration from a systemic issue. It should help growth teams understand whether a requested feature affects conversion or just creates noise in the roadmap.
The strongest product research surveys do not replace interviews, analytics, or support review. They sit in the middle of them, translating messy feedback into something you can test against behavior and revenue.
Why 'Listening to Customers' Is Not Enough
Well-intentioned teams make bad product calls every week because they treat customer input as proof instead of evidence.
In a growing SaaS company, feedback is everywhere. Support tickets, feature requests, sales call notes, onboarding transcripts, cancellation reasons, and survey responses all compete for attention. The bottleneck is rarely collection. It is deciding which signal has enough weight to justify product time.
Volume creates false confidence
Many product teams assume that if the same request shows up often enough, the roadmap decision is obvious. In practice, raw feedback volume usually reflects who is loudest, who talked to your team most recently, or which request is easiest to describe in a sentence. Those are weak prioritization rules.
I have seen teams ship highly requested polish work while larger accounts kept failing to adopt the core workflow that drove renewal risk. On paper, the survey results looked clear. In revenue terms, the team backed the wrong problem.
That is why survey counts need context. A request from ten casual users is not automatically more important than a recurring blocker among a small set of high-fit accounts. Product research surveys help only when they separate noise from patterns that affect activation, retention, expansion, or churn.
A useful survey does not answer, "What did people mention most?" It answers, "Which problem, for which segment, is expensive enough to act on?"
Surveys capture stated truth, not commercial truth
Surveys are good at one job. They standardize questions so teams can compare answers across segments and time periods.
That matters. Without structure, product teams end up with anecdotes and selective memory.
But surveys still measure what respondents say. SaaS decisions usually require more than that. Users misremember steps, overstate feature interest, skip over routine friction, and answer from their own role. The buyer cares about ROI. The admin cares about setup effort. The daily user cares about speed and clarity. A single survey response can be accurate for that person and still incomplete for the business decision.
Many teams get stuck here. They run a clean survey, produce a tidy chart, and assume they have learned what matters. What they have is stated sentiment, detached from behavior and account value.
Better product teams connect feedback to stakes
The shift is straightforward, even if the execution is not. Survey data becomes far more useful when it is joined with product intelligence and commercial context.
That means checking questions like these:
- Which complaints come from accounts with low activation or declining usage?
- Which requested features are concentrated in segments with strong expansion potential?
- Which onboarding pain points show up in survey responses and in event-level drop-off data?
- Which "important" requests come from users who never adopted the current workflow?
Those comparisons change the quality of the decision. They force a team to ask whether a problem is frequent, expensive, and fixable, instead of merely visible.
Listening is table stakes. Valuation is the primary work
Customer listening still matters. No serious product team ignores direct feedback.
Valuation is the core work. Customer listening still matters. No serious product team ignores direct feedback.
The mistake is stopping there.
A survey should feed a decision system, not a sentiment archive. The strongest teams use product research surveys to frame the question, then test that signal against usage data, support history, account tier, and revenue outcomes. That is how customer research starts influencing roadmap quality, retention, and expansion instead of producing a longer backlog.
When to Deploy Product Research Surveys
Deploying a survey requires timing and a clear decision. In SaaS, the cost of sending one too early is not just bad data. It is roadmap noise, false confidence, and teams debating opinions that never had enough context behind them.
Surveys earn their place when the team already has a working hypothesis and needs coverage across a larger sample. They are useful when interviews have surfaced a pattern, analytics have shown unusual behavior, or support tickets keep repeating the same complaint, and now the question is whether the issue is widespread, segment-specific, or commercially important.
A key question to ask before launching a survey is: what decision will change if the answers come back one way versus another? If there is no real decision attached, the survey can wait. A better first move is often to collect customer feedback through interviews, support conversations, and product signals, then use a survey once the team knows what it is measuring.
Use surveys when you need coverage across segments
The strongest survey use cases show up after some evidence already exists.
Good examples include:
- Product-market fit checks: You need to measure necessity across a defined customer group, not just hear that users "like" the product.
- Feature prioritization: Several plausible investments are competing for limited engineering time and you need comparable input from the right segments.
- Churn diagnosis: Cancellation reasons are piling up, but you need a structured read on which problems are concentrated in high-value accounts.
- Onboarding friction review: Event data shows drop-off and you need clearer user language about what felt confusing or risky.
- Pricing or packaging input: You want to test perceived value by plan, persona, or account maturity before making a packaging change.
Product-market fit is a good example because the survey question is narrow and decision-oriented. Sean Ellis popularized the benchmark that companies with strong product-market fit often see at least 40% of surveyed users answer "Very disappointed" to "How would you feel if you could no longer use this product?" in his work on the Sean Ellis test at https://articles.sequoiacap.com/why-product-market-fit-matters. The number matters less than the discipline behind it. The question measures necessity, which is far more useful than a generic satisfaction score.
Do not send surveys to define a problem you have not framed
Teams get weak results when they ask a survey to do discovery work that belongs somewhere else.
If the workflow is still unclear, interviews usually produce better insight. If the main question is where users abandon a task, product analytics will answer it faster. If an account says a feature is important but has never used the current version, usage history should carry more weight than the survey response.
Here is the practical split:
| Situation | Better method |
|---|---|
| You need to explore an unclear problem | User interviews |
| You need to measure known hypotheses across many users | Product research surveys |
| You need to verify what users did | Product analytics |
| You need emotional nuance or detailed workflow context | Live interviews or session review |
| You need to spot repeated operational pain points | Support and ticket analysis |
That trade-off matters. Surveys are efficient, but they flatten context. They work best after the team has already done enough work to ask focused questions.
Match survey timing to business stakes
In practice, four moments tend to justify a survey.
Product-market fit
Use a short survey when leadership needs a clean read on whether the product solves a problem customers would miss if it disappeared. This is especially useful before a major pricing change, repositioning effort, or category expansion.
Roadmap prioritization
Run the survey after the candidate bets are narrowed down. Asking customers to score a backlog with twenty loose ideas usually creates polite feedback, not a ranking you can trust.
Churn analysis
Survey close to the churn event while the experience is still fresh. Then compare the response against seat usage, support history, contract value, and feature adoption. A complaint from a declining, low-fit account should not carry the same weight as the same complaint from an expanding customer.
Expansion opportunity
Use a survey when behavioral data already shows heavy usage in a segment and the team needs to know whether adjacent needs are strong enough to support a new package, add-on, or workflow investment.
What works in practice
The sequence that holds up in a fast-moving SaaS environment is simple.
A team spots a pattern in usage, support volume, win-loss notes, or account behavior. A few interviews clarify the language and expose where the issue sits in the workflow. Then the survey measures prevalence across the segment that matters. After that, product and revenue data decide whether the signal deserves action.
That last step is where many teams still fall short. They treat survey volume as priority.
A better standard is to ask which responses come from retained accounts, expanding accounts, stalled accounts, or customers with clear monetization potential. That is when product research stops being a listening exercise and starts contributing to roadmap quality, retention, and expansion decisions.
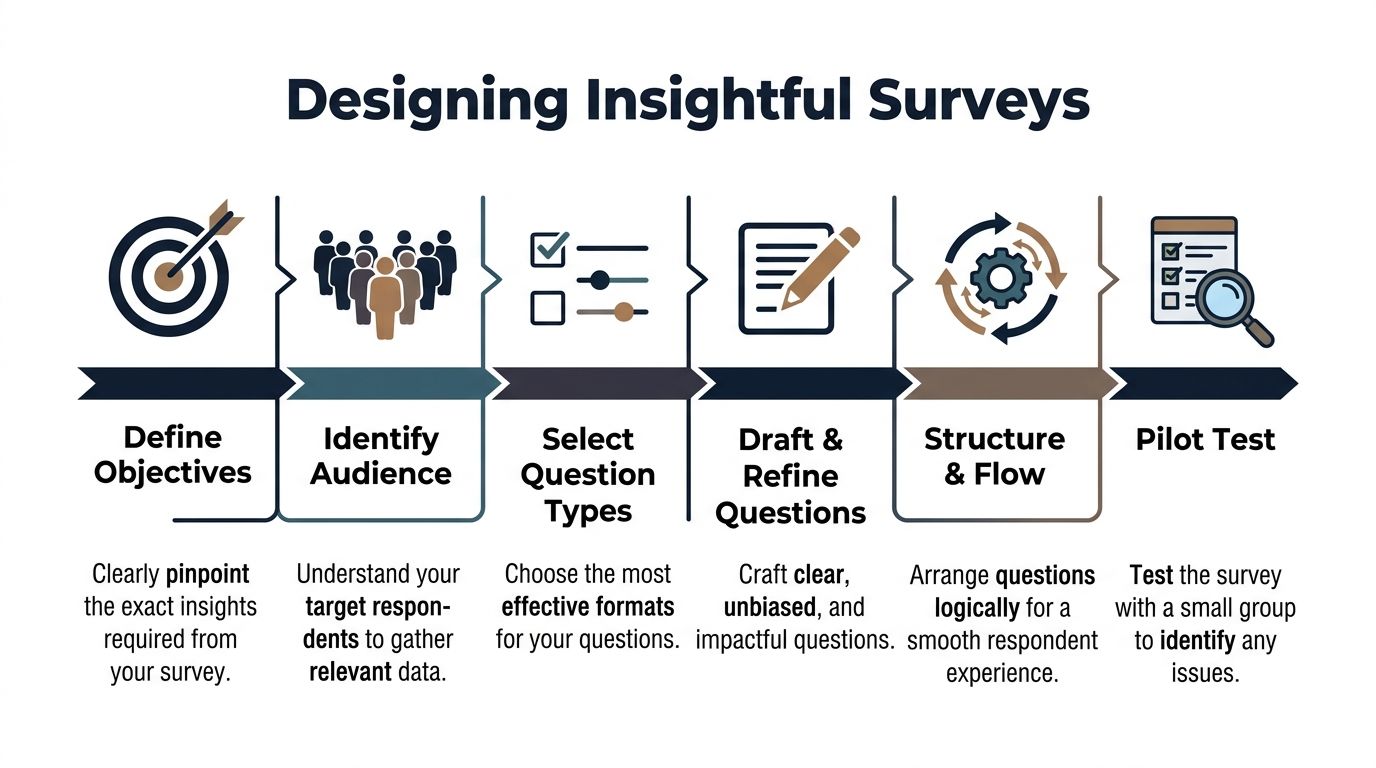
How to Design Surveys That Uncover Real Insights
Most bad surveys fail before the first question is written.
They fail when the team has not defined the decision, has not chosen the right audience, or asks broad questions that invite polite but useless answers. Good survey design is less about wording tricks and more about disciplined setup.
A repeatable process helps.
Start with one decision, not a topic
If the brief says “learn more about onboarding” or “understand sentiment about reporting,” the survey is already too loose.
A better prompt looks like this:
- Onboarding: Which step creates the strongest early friction for newly activated admins?
- Reporting: Which reporting gap blocks weekly usage for paid accounts?
- Expansion: Which user segment shows unmet needs worth packaging into a premium workflow?
That level of specificity changes everything. It narrows the audience, improves question quality, and makes analysis cleaner.
Choose respondents with intent
Survey design starts with sampling. Many SaaS teams blast the entire user base, then wonder why the answers conflict.
Respondents should be selected based on the decision at hand:
- New users for activation and onboarding questions
- Power users for workflow depth and advanced feature feedback
- Recently churned accounts for exit and value perception
- Admins or buyers for pricing, packaging, and procurement questions
- Specific cohorts based on behavior, such as low adoption or repeated support contact
This is also where many teams miss underserved opportunities. Product teams often target known demographics or familiar personas, but that can hide high-potential segments. Research should evolve to identify underserved groups by combining behavioral clustering with revenue correlation, as discussed in Retailist's piece on underserved markets and product development.
In practice, that means surveying beyond the obvious segment definitions. Instead of “SMB customers” or “enterprise admins,” look at patterns like repeated export usage, unusual support intensity, or teams adopting one workflow extensively while ignoring the rest of the product.
If you need a practical starting point for collection mechanics, this guide on how to collect feedback from customers is a useful operational reference.
Match question type to the signal you need
Question format should follow the decision. Not every survey needs an open text box, and not every insight should be reduced to a scale.
A simple rule set works well:
| Goal | Better question type |
|---|---|
| Measure sentiment or intensity | Rating scale |
| Compare fixed options | Multiple choice |
| Identify a dominant reason | Single select |
| Capture language and nuance | Open-ended response |
| Route respondents dynamically | Conditional logic |
Use rating questions when you need comparability. Use forced-choice questions when trade-offs matter. Use open text only where explanation is essential.
Too many open-ended questions create analysis debt. Too few create shallow conclusions.
Write questions that remove bias
The fastest way to corrupt a survey is to suggest the answer inside the question.
Avoid:
- Leading prompts such as “How helpful was our improved dashboard?”
- Double-barreled questions such as “How satisfied are you with onboarding and support?”
- Hypothetical enthusiasm checks such as “Would you love a new AI assistant?”
- Internal jargon that users do not use
Better alternatives are plain and specific:
- What was the hardest part of setting up the dashboard?
- Which of these issues slowed your first week of use the most?
- How would you describe the value of this feature to your team?
Keep wording neutral. Keep time windows clear. Keep concepts singular.
Control the respondent experience
Survey quality is also a UX problem.
The more cognitive load you add, the worse the data gets. People rush, skip nuance, or abandon the form altogether. Keep the survey short, group similar questions, and use branching so respondents only see what is relevant.
This walkthrough is useful if your team wants a visual refresher on crafting better questions and structure.
A practical flow:
- Confirm the respondent fits the target audience.
- Ask one broad framing question.
- Move into ranked or scaled diagnostics.
- Capture one open-ended explanation.
- End with segmentation fields only if needed for analysis.
If a question will not change segmentation, prioritization, or the next product decision, cut it.
Pilot before launch
Even experienced teams miss ambiguity in live surveys.
Run a small pilot with internal stakeholders or a handful of target users. Look for questions people interpret differently, options that overlap, and places where respondents stall. A pilot catches confusion before it pollutes the full dataset.
The difference between a mediocre survey and a strong one is usually not ambition. It is restraint.
High-Value Survey Templates for SaaS Products
Good survey work does not start with originality. It starts with repeatable decision inputs.
In SaaS, the same product questions come up every quarter. Why are trial users stalling? Which request is tied to real budget, not casual interest? Why did a customer leave, and was that loss preventable? A template helps because it standardizes how teams ask, compare, and act. It also makes it easier to connect responses to usage patterns and account value later.
Here is a practical starter set.
| Survey Type | Key Question Example |
|---|---|
| Product-market fit | How disappointed would you be if this product no longer existed? |
| Feature prioritization | Which one of these improvements would create the most value for your team? |
| Churn analysis | What was the primary reason you decided to stop using the product? |
| Onboarding feedback | What was the hardest part of getting value from the product in your first week? |
| Expansion discovery | What related problem does your team still solve outside this product today? |
If your team needs a broader planning worksheet before building these flows, use this customer research template for structuring interviews and surveys.
Template one for product-market fit
Product-market fit surveys should stay narrow. The goal is to measure dependency and clarity of value, not collect a general opinion dump.
Use a structure like this:
- Core necessity question: How disappointed would you be if this product no longer existed?
- Primary value question: What is the main benefit you get from the product today?
- Audience fit question: What type of team or role are you using the product for?
- Replacement behavior question: If this product disappeared, what would you use instead?
This template works because it separates satisfaction from reliance. I have seen accounts give high satisfaction scores and still churn because the product was helpful, not necessary.
Template two for feature prioritization
Feature prioritization surveys fail when teams overload the list. A common mistake is listing 10 to 20 ideas, then treating the top vote-getter as a roadmap signal. That usually produces weak data because respondents pick the least bad option, not the problem they would pay to solve.
A tighter version works better:
- Which of these potential improvements would have the biggest impact on your work?
- What problem would that improvement solve for you?
- How are you handling that problem today?
- If this were available, how important would it be relative to your current priorities?
The useful output is not demand volume alone. It is the combination of stated importance, current workaround, affected segment, and whether high-value accounts behave as if the problem is painful.
Template three for churn analysis
Churn surveys should be immediate and precise.
A practical set:
- What was the main reason you chose to cancel?
- Which part of the product fell short of your needs?
- What did you expect the product to help you do?
- Was the issue related to setup, workflow fit, missing functionality, support, or budget?
- What did your team use instead, if anything?
Keep the wording neutral. Customers who already left will not write a thoughtful retrospective for your benefit. They will give you one clear signal if the survey respects their time.
Template four for onboarding friction
Onboarding surveys work best inside the product, at the moment friction occurs. Amplitude makes that case in its guide to product surveys, and the practical reason is straightforward. Feedback tied to a real task is easier to interpret and easier to connect to completion rates, activation milestones, and later expansion.
Use prompts like:
- What almost stopped you from completing setup?
- Which step felt unclear or harder than expected?
- What did you expect to happen next?
- What were you trying to accomplish when you got stuck?
That context matters. A complaint from a new user who still activated is different from the same complaint from an account that never finished setup and never converted.
Template five for expansion discovery
Expansion surveys are underused because teams ask them too late or ask the wrong buyer.
Use prompts like:
- What adjacent workflow does your team still manage outside this product?
- Where are you stitching together spreadsheets, internal tools, or another vendor?
- Which team feels the gap most often?
- If that gap were solved well, who would care enough to sponsor budget?
Survey research starts becoming commercially useful at this point. A request from a heavily engaged champion is interesting. A repeated gap reported by expansion-ready accounts with clear spend authority is pipeline.
Templates are useful because they make survey work operational. Operational value shows up when responses stop living in a slide deck and start getting scored against product behavior, account health, and revenue potential.
Analyzing Survey Data to Find Actionable Signals
Survey analysis breaks down when teams treat response volume as proof of insight. A hundred answers still produce weak decisions if the output is one average score, one top-box percentage, and a loose summary of comments.
A common mistake in analysis is stopping at averages. Mean satisfaction, broad sentiment buckets, and a shortlist of repeated themes hide the differences that affect retention, expansion, and support cost.

Segment before you summarize
Start with segments that map to product and commercial decisions, not just demographics.
For a SaaS product, the useful cuts usually include:
- Plan type: free, trial, paid, enterprise
- Role: buyer, admin, operator, contributor
- Lifecycle stage: new, active, stalled, renewing, churned
- Behavioral pattern: high usage, partial adoption, repeated support contact
- Commercial profile: expansion candidate, at-risk account, low-engagement customer
The same complaint means different things depending on who reported it. Confusion from a trial user often points to activation friction. The same confusion from an enterprise admin can signal an adoption blocker that puts renewal and seat growth at risk.
Use cross-tabs to find concentrated problems
Cross-tabulation is one of the fastest ways to move from raw feedback to priority. Compare a survey response against plan, role, account stage, product usage, or account value.
That is where weak aggregate findings start to sharpen. “Reporting is confusing” may look like a moderate issue in the full sample. A cross-tab can show that the problem is concentrated among admins at larger accounts who are responsible for rollout, while end users barely mention it.
Greenbook’s guidance on using market research surveys for new product development highlights cross-tabulation and correlation analysis as practical methods for isolating which inputs deserve action first. That matters because product teams do not need more themes. They need clearer evidence on where the issue sits and what it is worth to fix.
Code open text like evidence
Open text is useful only after it is structured. Skimming comments and pasting a few quotes into slides usually overweights the loudest phrasing and underweights the pattern.
A practical workflow looks like this:
- Read an initial sample end to end.
- Build a short theme set from the language respondents use.
- Tag each response to one or more themes.
- Compare theme frequency by segment.
- Pull a few representative quotes for product, design, and GTM teams.
Keep the taxonomy tight. Too many labels scatter the signal. Too few labels blur distinct problems together.
A simple coding set often includes:
| Theme type | Example |
|---|---|
| Workflow friction | “Took too many steps to complete” |
| Missing capability | “Could not export what our team needed” |
| Confusion | “Did not understand what to do next” |
| Trust concern | “Did not feel confident in the data” |
| Value mismatch | “Felt like more effort than benefit” |
Tie responses to outcomes
This is the point where survey analysis starts becoming commercially useful.
Do not stop at “users disliked this flow.” Check whether the people reporting that issue activated later, submitted more support tickets, expanded seats, downgraded, or disappeared. If a complaint shows up often but has no measurable effect on behavior or account value, it may deserve a different response than an issue raised less often by high-fit accounts that later churn.
That trade-off matters. Product teams have limited capacity. Revenue teams do too.
If your team needs a repeatable method for organizing themes, tags, and follow-up analysis, this guide on how to analyse customer feedback is a useful reference.
Actionable survey analysis connects three things. What users said, what they did next, and what that behavior was worth.
Integrating Survey Data with Product Intelligence
Most survey programs hit a ceiling for one reason. They stop at self-reported feedback.
A user says onboarding was confusing. Another says a feature is important. A third says support was slow. Those statements matter, but they remain weak signals until you connect them to behavior. Did the user abandon setup? Did the requested feature affect retention? Did the support complaint come from a small trial account or a strategic customer with expansion potential?
That is the gap many product teams still leave open.

What surveys miss on their own
Traditional surveys capture what customers say. They rarely capture what their actions reveal. That gap is underexplored in product research, especially for SaaS teams trying to understand which issues are causing revenue loss, as noted in Luth Research's discussion of underserved gaps in market research practice.
In plain terms, a survey might tell you that users dislike a workflow. Product intelligence tells you whether that workflow also causes support spikes, lower activation, failed renewals, or stalled expansion conversations.
Those are very different levels of truth.
Build a joined view of the customer
A revenue-driven research process links survey responses with adjacent systems:
- Product analytics: feature adoption, path analysis, drop-off points
- Support systems: ticket themes, escalation frequency, unresolved issues
- Conversation data: chat transcripts, success calls, sales objections
- Commercial context: account tier, renewal timing, expansion potential
Once those systems are connected, survey answers become much more useful.
A low satisfaction score from a low-engagement trial user may matter less than a moderate frustration signal from a mature account whose team uses the product heavily. A feature request repeated by support, surfaced in surveys, and linked to stalled adoption deserves a different level of urgency than a standalone suggestion.
Turn feedback into weighted evidence
With feedback integrated into weighted evidence, product teams begin operating differently in this phase.
Instead of saying, “Users asked for advanced permissions,” they can say, “Accounts with complex admin setups repeatedly mention permissions, show related support friction, and slow adoption in the workflows tied to renewal value.”
That is a much stronger prioritization input.
A practical model looks like this:
| Data layer | What it adds |
|---|---|
| Survey response | Stated need or frustration |
| Usage pattern | Observed behavior around the issue |
| Support evidence | Frequency and severity of operational pain |
| Revenue context | Business importance of affected accounts |
When all four point to the same issue, confidence rises quickly.
One way teams operationalize this is by using platforms that combine support, usage, and feedback streams into a single view. Tools in this category include analytics platforms, support intelligence layers, and product intelligence systems such as SigOS, which ingests tickets, chat transcripts, sales calls, and usage metrics to highlight patterns tied to churn or expansion.
What changes once you do this
Three things usually improve.
First, roadmap conversations get sharper. Teams stop arguing about the loudest request and start comparing validated patterns.
Second, support and product work from the same evidence base. A recurring complaint is no longer “just anecdotal” when it lines up with usage failure and account risk.
Third, product research surveys become more strategic. They are no longer standalone forms. They become a way to test whether a pattern observed in behavior is widespread, segment-specific, or commercially important.
The highest-value survey response is not the most emotional one. It is the one that lines up with repeatable behavior and meaningful business impact.
That is the shift from customer listening to product intelligence.
Turning Insights into Revenue-Driven Actions
A research process earns its keep when it changes what gets built.
That sounds obvious, but many teams still treat product research surveys as a reporting exercise. They publish a deck, share a few quotes, and move on. The better approach is operational. Translate each validated signal into a product action, a confidence level, and a business reason for doing it now.
Use prioritization frameworks with better inputs
Frameworks like RICE or ICE are only as good as the evidence behind the score.
When survey data is combined with behavior, support volume, and account context, the “Impact” score stops being guesswork. So does “Confidence.” A roadmap item tied to repeated survey pain, observable friction, and commercial relevance should score differently from an idea backed only by enthusiasm.
A clean decision filter helps:
- Build now: The issue appears in surveys, shows up in behavior, and affects meaningful accounts.
- Investigate further: The survey signal is strong, but behavior does not yet confirm the consequence.
- Ignore for now: The request is loud, but isolated or commercially weak.
- Reframe the problem: Users describe one thing, but behavior points to a different root cause.
Close the loop fast
Once a signal is validated, move it into execution quickly. Create the Jira or Linear ticket, attach the evidence, define the affected segment, and note the expected product or revenue outcome. That gives engineering, design, support, and leadership the same context.
The point of product research surveys is not better documentation. It is better product judgment.
Teams that make this shift stop rewarding volume. They reward evidence. They stop treating every response equally. They weight feedback by behavior and business impact. That is how research starts reducing churn, improving expansion potential, and shaping a product customers not only say they want, but continue to use and pay for.
If your team wants to move from standalone surveys to a revenue-aware feedback system, SigOS is built for that workflow. It connects customer feedback, support conversations, and product behavior so teams can prioritize issues based on the patterns most likely to affect churn, expansion, and roadmap decisions.
Keep Reading
More insights from our blog


Ready to find your hidden revenue leaks?
Start analyzing your customer feedback and discover insights that drive revenue.
Start Free Trial →