Mastering Query Response Time: A SaaS Guide 2026
Optimize query response time for SaaS teams. Learn to measure, diagnose, & reduce latency, linking database performance to churn & revenue in 2026.

Users rarely report query response time directly. They say the dashboard hangs, search feels unreliable, or exporting a report takes forever. Support tickets start with vague language, but the pattern is usually precise. A click triggers a query, the system takes too long to answer, and the delay becomes product friction the team can feel but hasn't named correctly.
In SaaS, that friction spreads subtly. It slows onboarding, makes power users distrust reports, and turns simple workflows into repeated clicks because people aren't sure whether the app is processing or stuck. Teams often treat this as an engineering nuisance. It isn't. It's a product KPI that shapes retention, expansion, and whether customers trust your software enough to build habits around it.
Why Your App Feels Slow
A familiar scenario plays out in a lot of product teams. Customer success says enterprise users think the app is sluggish. Engineering checks uptime and sees no outage. The database isn't down. Error rates look normal. Yet the complaints keep coming.
That gap exists because slow queries don't announce themselves like hard failures do. They hide inside normal-looking operations. A search request that drags. A filtered list that takes too long to render. A usage report that spins just long enough for someone to open a support ticket.
Slowness is often a query problem in disguise
Every product has moments where a user asks the system a question. Show my accounts. Filter tickets by team. Load the latest activity. Calculate renewal risk. Under the hood, those are all queries, even when the interface looks simple.
Query response time is the time between that request and the returned answer. If it stretches, the product feels hesitant. Users don't care whether the delay came from SQL, an ORM, an API hop, or an aggregation pipeline. They only experience waiting.
That waiting changes behavior. People retry actions. They leave the page. They stop trusting what they see because delayed systems feel inconsistent, even when the data is technically correct.
The product cost shows up before the root cause is obvious
Product leaders may overlook a key signal. They may see lower feature adoption or more complaints about usability and assume the problem is design, training, or customer expectations. Sometimes it is. Often, the underlying issue is that the system takes too long to answer common questions.
A team that wants to understand product friction needs usage context, not just incident logs. Looking at app usage patterns across workflows helps identify where users stall, repeat steps, or abandon tasks after a slow interaction.
Slow software doesn't need to crash to lose revenue. It only needs to make users hesitate often enough that they stop depending on it.
A useful way to frame this internally is simple. If users ask the product a question and the product answers slowly, that's not just infrastructure debt. That's a degraded product experience.
Why product managers should care as much as engineers
DBAs and backend engineers already know latency matters. Product managers should care for a different reason. Query response time sits at the point where technical execution meets customer perception.
When a team ignores it, three things usually happen:
- Support volume rises: Customers describe symptoms like slowness, timeouts, and unreliable reports.
- Feature trust drops: Users avoid advanced workflows if they expect a wait every time they click.
- Roadmap quality suffers: Teams misread the problem as missing functionality when the existing functionality is too slow to use confidently.
That last point matters. A feature that technically works but feels slow often performs like a feature no one asked for. That's why query response time belongs in product reviews, not only in engineering dashboards.
Measuring What Actually Matters
A dashboard can say performance is fine while users are still waiting long enough to lose trust. That happens when teams report the average query time across everything and miss the slow paths inside the workflows people use to search, filter, export, and make decisions.
Average latency is easy to graph and easy to misread. In SaaS products, the experience that drives support tickets and renewal risk usually lives in the tail. P95 response time is often the more useful operating metric because it shows what the slower slice of real sessions looked like on the screens that matter.
Averages hide the sessions that shape product perception
A product leader does not need one number for the whole app. They need to know where users feel friction and whether that friction shows up in moments tied to activation, retention, and expansion.
Averages answer a narrow question: what happened overall? For product reviews, a better question is: what did customers experience during the workflows they repeat every day?
That distinction changes prioritization. A reporting page that is fast most of the day but slows down for finance teams every Monday morning can still damage trust, even if the weekly average looks acceptable. The users hitting that delay are often your highest-value accounts.
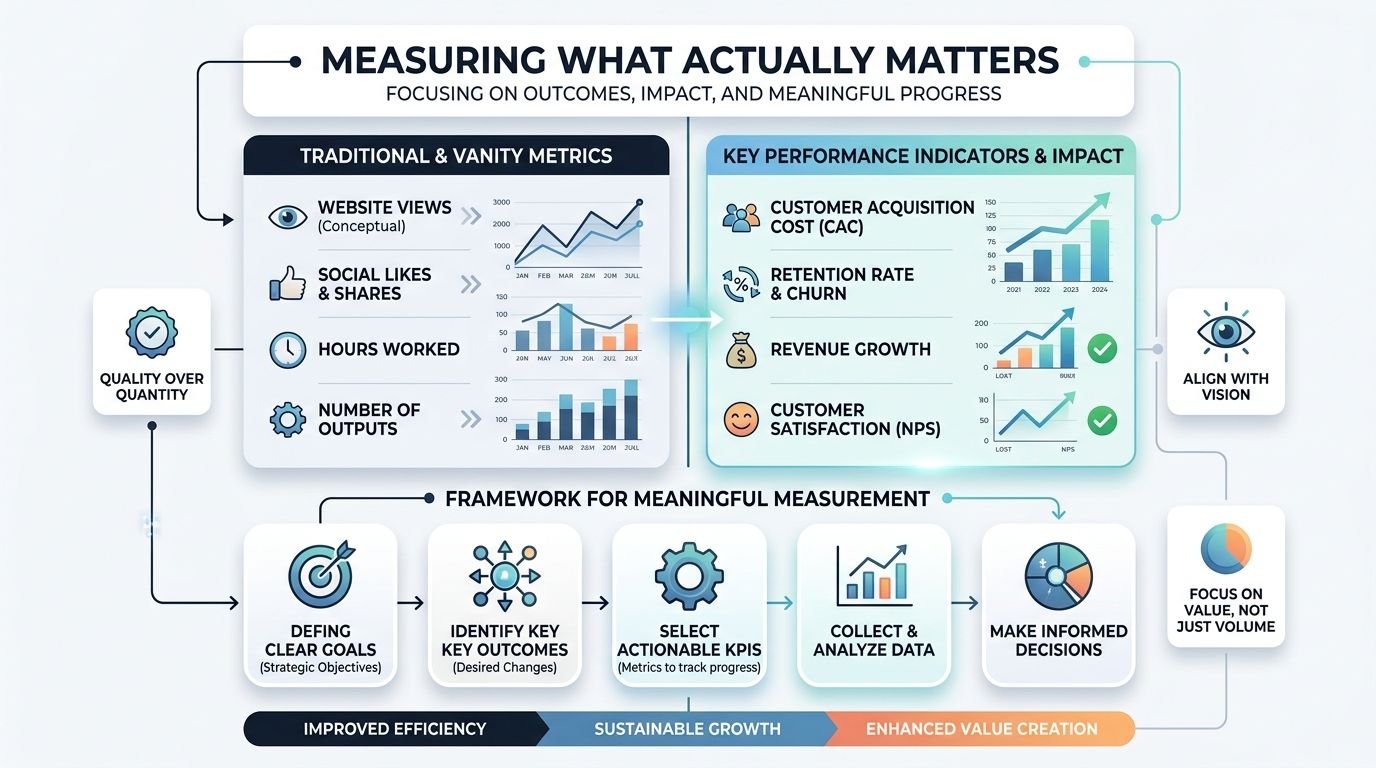
If you're building dashboards for product and engineering reviews, metrics and reporting systems that separate vanity metrics from operational ones make it easier to spot where query latency is becoming a product problem instead of a backend-only metric.
Measure system time and user time separately
Teams often stop at database or application latency. That is useful for diagnosis, but it is not the full customer experience. Users feel the delay from click to usable result, which includes transport, processing, and rendering.
Track both layers:
- Server-side processing time: How long the application and database take to complete the request.
- Network latency: Delay added by geography, mobile conditions, proxies, and upstream services.
- Client-side rendering time: How long the browser or frontend needs before the result is visible and usable.
- Endpoint-level percentile metrics: P95 or P99 on the routes tied to core product workflows.
Here is the practical difference:
| Metric | What it tells you | Where teams get misled |
|---|---|---|
| Average response time | Overall central tendency | Hides tail latency on important workflows |
| P95 response time | What slower user sessions actually experienced | Better for prioritization and triage |
| Server-side latency | Backend execution efficiency | Misses network and rendering delays |
| End-to-end latency | What the customer actually feels | Harder to instrument, closer to revenue impact |
A simple rule works well in practice. If customers say the app feels slow and the average still looks healthy, inspect P95 by workflow, account tier, region, and endpoint before dismissing the feedback.
What belongs on the review dashboard
Do not send executives a wall of endpoint charts. Put the queries and screens that shape product trust in front of them.
Start with:
- Search and filtering workflows.
- Reporting, exports, and scheduled jobs users wait on directly.
- High-frequency list views used throughout the day.
- Customer-facing AI, support, or recommendation interactions.
- Any workflow tied to activation, expansion, or renewal conversations.
Query response time becomes a product KPI. If a core workflow slips from quick to frustrating, adoption drops, usage concentrates in simpler features, support volume rises, and revenue teams start hearing that the product feels unreliable. Measure the parts of latency users remember, and the optimization work becomes easier to justify across engineering, product, and leadership.
Common Causes of Slow Queries
When a product slows down, teams often blame "the database" as if it's one thing. In practice, slow queries usually come from a small set of repeat offenders. The value for product leaders isn't memorizing every low-level fix. It's learning to recognize the patterns quickly enough to ask the right questions.
Missing indexes
A missing index is the database equivalent of asking someone to find a topic in a thick reference book with no index page. The data exists, but the system has to work too hard to find it.
This issue matters because the impact can be extreme. According to the benchmark summarized in Singdata's performance write-up, adding missing database indexes can reduce query response time from 3 seconds to 5ms.
That's the kind of change users feel instantly. A report that used to feel broken suddenly feels native.
The N+1 query problem
This one appears constantly in ORM-heavy applications. A page loads a list of records, then fires additional queries for each related item instead of retrieving everything efficiently up front.
The benchmark above also notes that eliminating N+1 queries through JOINs or eager loading prevents the 50x performance degradation inherent in fetching 50 separate order items sequentially. Product teams don't need to debate the implementation detail. They need to recognize what it does to the experience. Pages that should load in one pass end up making a long series of tiny trips.
If a feature feels fine with test data but slows down in production, check whether the app is making one smart query or hundreds of polite little ones.
Inefficient data access patterns
Some slowdowns aren't a single bad query. They're a product design issue expressed in technical form. A dashboard may request more fields than the user needs. A search result may trigger expensive joins for information that isn't visible until later. An API may compute heavyweight aggregations synchronously for every request.
These patterns often come from reasonable product decisions made without performance boundaries. Teams ask for richer pages, deeper filters, and more context. Engineering delivers. Then usage grows and the same workflow becomes expensive.
A useful architecture conversation often starts with visual clarity. Reviewing data architecture diagrams for critical product flows can reveal where a "simple screen" depends on too many services, tables, or transformations.
Resource contention and concurrency
Even a decent query can turn slow under load. Shared infrastructure, limited connection pools, lock contention, and simultaneous heavy reads all stretch response time when traffic clusters around the same workflows.
Here are the common categories to inspect:
- Hot tables or endpoints: Many users hit the same data path at once.
- Competing workloads: Background jobs, analytics, and user traffic fight for the same resources.
- Poor connection management: Requests wait for available connections instead of doing useful work.
- Overly broad reads: Queries pull large result sets when the interface only needs a subset.
The core lesson is simple. Slow query response time usually isn't mysterious. It tends to come from a few repeatable causes, and each cause points toward a different fix. Product leaders don't need to tune indexes by hand, but they do need enough literacy to tell whether the team is chasing symptoms or addressing the underlying bottleneck.
A Practical Diagnostic Workflow
Performance investigations get expensive when teams jump straight to tuning before they know what broke. A useful workflow starts broad, narrows fast, and ends with evidence. That keeps people from arguing based on hunches.
Start with the affected workflow, not the database
When a customer says the product is slow, the first question isn't "Which query is bad?" It's "Which action is slow, for which users, under what conditions?"
Start by isolating:
- The feature or endpoint involved.
- The user segment affected.
- The time window when slowness appeared.
- Whether the issue is constant or spikes under load.
That gives engineering a defined target. "The dashboard is slow" isn't actionable. "The account health page slows down for larger customer records during morning login spikes" is.
Trace the request path
Once the workflow is known, follow the request through the stack. Application performance monitoring tools, structured logs, and endpoint tracing are useful here because they show where time accumulates.
Look for a simple split:
- Is the request mostly waiting on the database?
- Is the application layer doing too much processing?
- Is network or service-to-service latency a major contributor?
Teams often discover that the "slow query" isn't one monster statement. It's many small operations adding up.
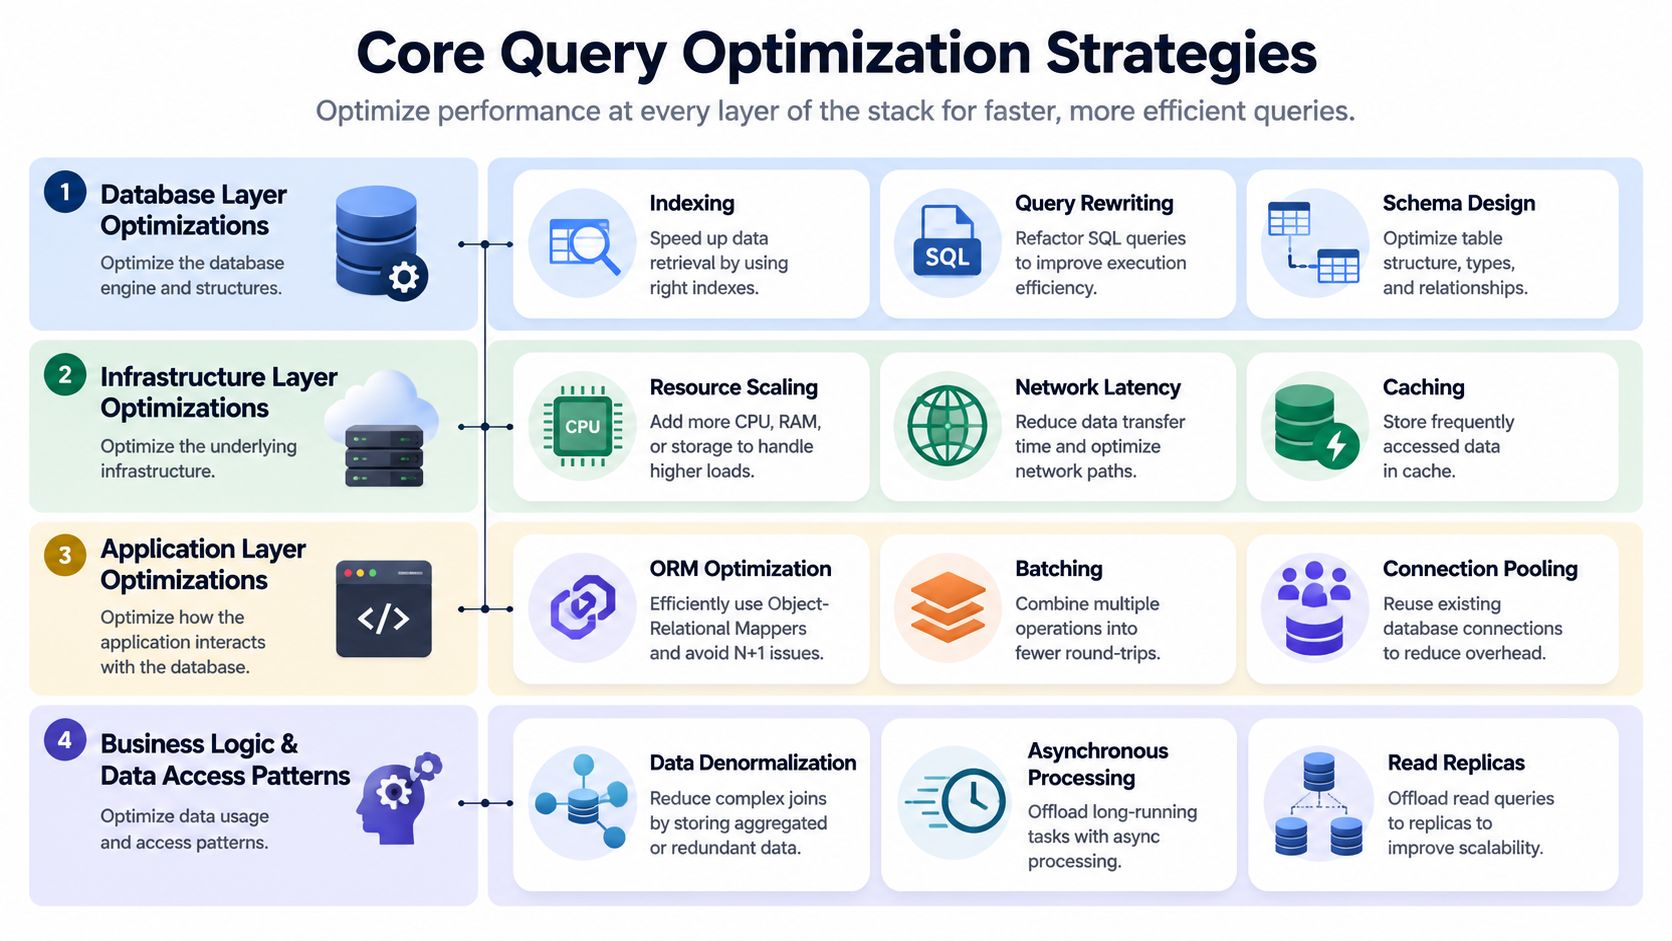
Capture the exact query and inspect the execution plan
After identifying the endpoint, get the actual SQL or datastore query being run. Then inspect the execution plan. This is usually where the main bottleneck becomes visible.
A concise investigation loop looks like this:
| Step | What to inspect | Why it matters |
|---|---|---|
| Isolate endpoint | Route, screen, API operation | Keeps the team focused |
| Review logs and traces | Slow spans, repeated calls, wait time | Shows where time accumulates |
| Capture query | ORM output or generated SQL | Exposes what actually ran |
| Read execution plan | Scans, joins, sort cost, index usage | Identifies the bottleneck |
| Re-test after change | Same workflow, same conditions | Verifies improvement |
A good diagnostic process reduces blame. Once the team sees the request path, the debate shifts from opinions to evidence.
Confirm the fix in production-like conditions
The last step is where many teams stop too early. They apply a query change, test locally, and move on. Then the issue returns because the production workload is different.
Validate in conditions that resemble real traffic. Watch the target workflow, not only the query in isolation. A fix that improves raw execution but increases contention elsewhere may move the bottleneck rather than remove it.
What works is disciplined narrowing. Start from the user complaint, trace the request, inspect the query plan, and verify the result under realistic load. That workflow turns "the app feels slow" from a vague product complaint into a solvable operational problem.
Core Optimization Strategies
A slow query rarely stays a database problem for long. It turns into a product problem. Users wait, retry, abandon the task, or stop trusting the workflow altogether. That is why optimization decisions should follow user impact first, then technical elegance.
Fix the database layer first
Start with the work the database is doing on every request. If a query reads far more rows than the screen needs, sorts large result sets unnecessarily, or joins tables in a way that forces scans, the rest of the stack inherits that cost.
The highest-return fixes usually look familiar, but the trade-offs matter:
- Add indexes to match real product behavior: Index filters, join keys, and sort paths tied to frequent user actions. Every index improves some reads and adds write overhead, storage cost, and maintenance. Choose the paths that affect core workflows.
- Rewrite expensive query shapes: A narrower
SELECT, a better join order, or a different aggregation strategy can remove a surprising amount of work. The cleanest ORM expression is not always the cheapest SQL. - Adjust schema design where read paths suffer: Highly normalized models help consistency, but they can slow read-heavy screens that need data from several tables at once. In some cases, selective denormalization is the practical choice.
- Check connection management: Query time is only part of response time. If requests wait on a saturated pool, users still experience a slow product.
If your team works in Microsoft SQL Server environments, this practical resource on boosting database performance is worth reviewing. It helps ground optimization work in real tuning tools instead of generic advice.
Improve the application layer
Many slow queries start above the database. The application asks for too much data, makes too many round trips, or blocks the request on work the user does not need immediately.
Three patterns show up often.
First, remove waste:
- Eliminate N+1 access patterns: Batch related reads or load associations deliberately.
- Request less data: List views often need summary fields, not full objects with every relation attached.
- Reduce round trips: Chatty APIs can make an acceptable query feel slow because the workflow waits on repeated calls.
Second, stop repeating expensive work:
- Cache hot reads that are stable enough to reuse: Caching helps when access patterns are predictable and freshness requirements are clear.
- Precompute heavy aggregations: Reports, counters, and rollups do not always belong on the request path.
- Move long-running tasks to background jobs: If the user does not need the final result immediately, return fast and show status clearly.
This is a product decision as much as an engineering one. Real-time computation feels elegant until it slows down the feature customers use every day.
A quick visual walkthrough can help teams think through the stack before they tune individual queries:
Tune infrastructure for consistent latency
A query can be fast in isolation and still produce a slow experience in production. Network distance, concurrency spikes, cold starts, noisy neighbors, and overloaded replicas all show up to the user as the same thing. Waiting.
Infrastructure tuning should focus on consistency, not only peak benchmark results:
- Scale for concurrency: Average load can look healthy while tail latency climbs during bursts.
- Reduce unnecessary service hops: Each additional call adds network time and another failure point.
- Split read-heavy traffic when needed: Read replicas or dedicated paths can protect transactional workloads from reporting or analytics demand.
- Use caching with clear intent: Caching can stabilize common reads, but it will not rescue a poor access pattern or unclear invalidation model.
Teams often celebrate a faster median while customers still feel the system is slow. P95 and P99 behavior matter more for product trust because that is where repeated frustration lives.
Know what not to optimize
Performance work pays off when it changes user behavior or protects revenue. It is easy to spend a sprint shaving milliseconds off an internal endpoint while a customer-facing search, dashboard, or checkout flow keeps dragging.
Prioritize queries tied to:
- Core retention workflows
- Frequent daily actions
- Support-heavy features
- Revenue-critical reporting
- Customer-facing AI and retrieval flows
AI products make this prioritization sharper. If retrieval is slow, the model appears slow. If the first answer arrives late, users judge the whole feature as unreliable even when the generation quality is good.
The strongest strategy is selective and layered. Fix the paths customers feel, remove waste across database, application, and infrastructure, and choose trade-offs that improve the product experience, not just the query benchmark.
The Business Impact of Milliseconds
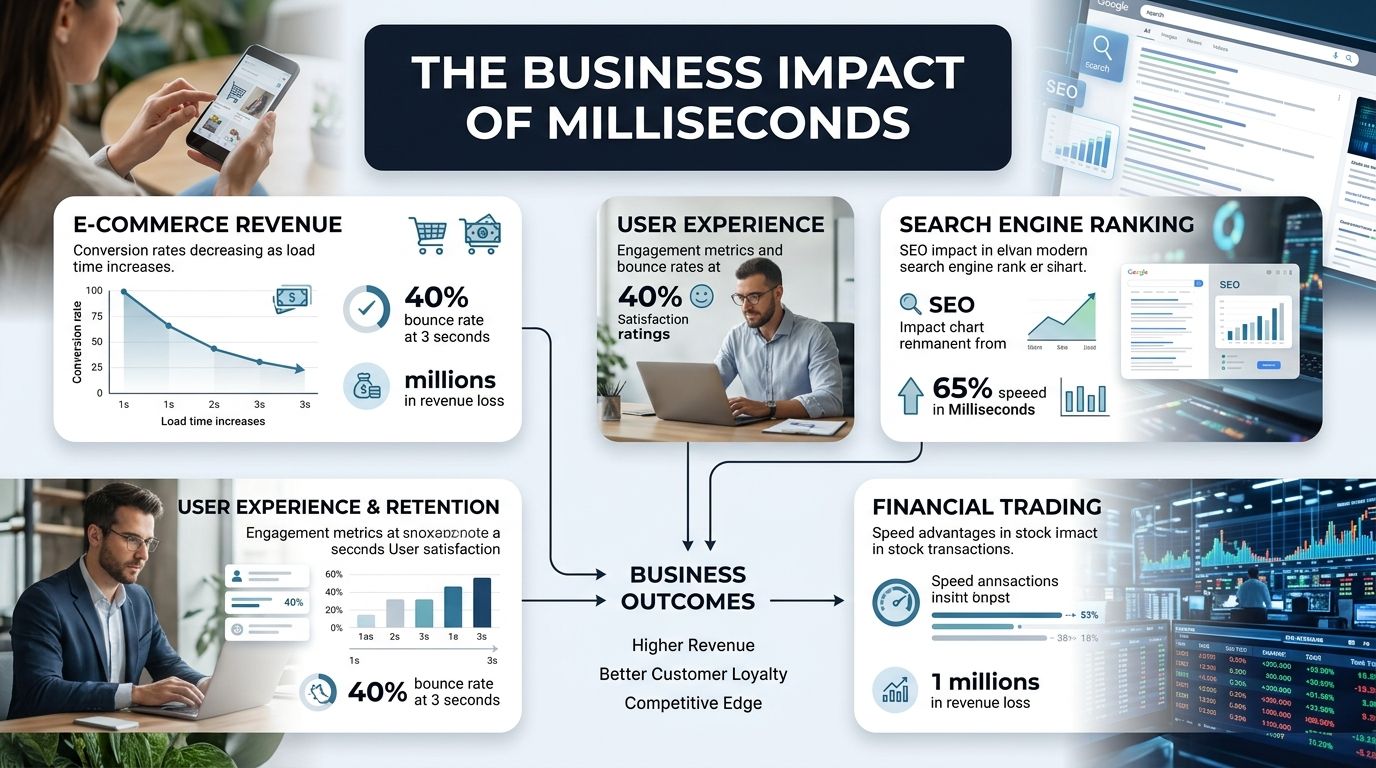
A buyer opens a dashboard during a live review with their team. The page hangs for a few seconds, someone refreshes, and the conversation shifts from the numbers to whether your product can be trusted. That is how query latency turns into churn risk. The feature still works, but confidence drops before anyone files a bug.
Slow queries change user behavior in ways finance will notice. People abandon reports, retry searches, delay decisions, and open support tickets that start with "the app feels off." In SaaS products, that friction shows up in lower adoption, weaker expansion, and harder renewals.
Slow responses break trust before they break functionality
Support data makes the expectation clear. According to the 2026 benchmark summary from Converge's first response time data, 88% of customers expect a response within 60 minutes. Analysts at Converge also found that if a customer waits longer than 5 minutes on chat, 53% will abandon the conversation entirely, and satisfaction drops by 15% for every minute past the two-minute mark in that channel.
Those are support benchmarks, but the product lesson carries over. Users do not separate a slow support interaction from a slow report, search, or AI answer in their memory of your company. They remember whether your product felt responsive when they needed it.
AI products carry a tighter expectation
AI features raise the bar because the promise is speed plus insight. If retrieval drags or the first answer arrives late, users judge the whole experience as unreliable, even when the output is accurate. I have seen teams invest heavily in model quality only to get poor adoption because the waiting time made the product feel uncertain.
The practical standard is simple. Retrieval needs to feel immediate, and total response time needs to stay short enough that users remain in flow. In commercial terms, slow AI weakens a premium feature, hurts demo performance, and gives buyers a reason to question the value of an upgrade.
Why this deserves roadmap priority
Performance work often loses to visible feature work because the payoff looks indirect. In reality, slow query response time taxes the exact workflows that drive retention and revenue.
The business case is usually strongest in four places:
- Retention: Fast products feel dependable during real work, not just in controlled demos.
- Expansion: Customers buy into advanced workflows when the system responds consistently under load.
- Support cost: Latency creates vague, expensive tickets that take multiple teams to diagnose.
- Sales credibility: Trials and live demos fall apart quickly when production data takes too long to load.
Product teams should treat response time the way finance treats cash flow. If latency spikes in the wrong journey, every other investment has to work harder to overcome the friction.
The argument for query performance is not "the database needs tuning." The argument is that delayed responses weaken trust at the moments where usage, renewal, and revenue are decided.
Beyond Speed Monitoring for Quality and Impact
Fast queries are useful only if they return something relevant enough for users to complete the job they came to do. Many performance programs often stall at this point. Teams improve raw speed, celebrate lower latency, and still don't move the product metrics that matter.
Speed without relevance is a partial win
A search that returns instantly but sends users into repeated refinements isn't healthy. A dashboard that loads quickly but answers the wrong business question still creates friction. Good performance work needs a second lens: did the result help the user move forward?
That's why query response time should be monitored alongside behavioral outcomes such as abandonment, repeat searches, workflow completion, and whether users escalate to support after using a feature.
The strongest teams combine technical telemetry with product signals:
- Latency metrics: P95 by workflow, endpoint, and user segment
- Behavior signals: Re-querying, abandonment, repeated filter changes
- Outcome signals: Task completion, feature adoption, support escalation
- Business context: Whether the slow or low-quality query occurred in a retention or revenue-critical journey
Build a continuous performance culture
This isn't a one-time clean-up project. Product behavior changes, data volumes grow, and once-fast queries degrade as the system evolves. Teams need alerting, review rituals, and ownership that spans engineering and product.
The qualitative benchmark on modern query optimization and business outcomes captures the shift well. Teams that prioritize qualitative metrics like query relevance and result refinement alongside raw speed achieve 40% better business outcomes.
That should change how leaders review performance. Don't ask only, "Did we make it faster?" Ask, "Did users finish the workflow with less friction, and did the result support the business decision they were trying to make?"
A fast wrong answer is still a product failure. The real target is timely, relevant output that helps users complete valuable work.
The teams that win here don't separate observability from product strategy. They treat query response time as an operating signal, then connect it to usage, churn risk, and customer trust. That's where performance work stops being defensive maintenance and starts becoming a lever for growth.
If you want that connection between technical performance and business impact to be visible every day, SigOS helps product and growth teams spot the patterns hidden in support conversations, usage data, and customer behavior. It turns noisy signals into prioritized issues tied to churn, expansion, and revenue impact, so teams can fix what matters before slow experiences become customer loss.
Keep Reading
More insights from our blog



Ready to find your hidden revenue leaks?
Start analyzing your customer feedback and discover insights that drive revenue.
Start Free Trial →