Real-Time Analytics Platform: real-time analytics platform for instant insights
Explore how a real-time analytics platform converts data into instant, actionable insights. Learn components, use cases, and tips to pick the right one.

A real-time analytics platform is all about processing data the moment it's created, giving you insights in milliseconds or seconds. It’s like having a live GPS that instantly reroutes you around a traffic jam, instead of relying on a paper map that was outdated the second it was printed. This constant, immediate feedback lets you act on opportunities and threats right now, not tomorrow.
The Shift From Hindsight To Foresight
For too long, data analysis has felt like trying to drive forward while staring into the rearview mirror. By the time you get the weekly report, the moment to act has already passed. That old-school approach is called batch processing, where data is gathered up and analyzed in big, slow chunks—hourly, daily, or even weekly. It's fine for looking back at historical trends, but it's completely useless when you need to make a decision this very second.
Real-time analytics completely flips that model around. It works with a continuous flow of data, allowing you to stop making decisions based on what happened and start acting on what is happening. This isn't just about being faster; it's about being relevant.
Why Immediate Insight Matters
Here's a hard truth: the value of data has a very short shelf life. Finding out about a critical server error a day later is just damage control; knowing about it the instant it happens is prevention. This idea holds true across every part of a business.
- Customer Experience: Spot a user struggling on your website and offer help before they get frustrated and abandon their cart.
- Fraud Detection: Block a fraudulent transaction in milliseconds, not hours after the money is already gone.
- Operational Efficiency: Keep a live eye on your supply chain to reroute shipments and sidestep costly delays before they even become a problem.
For SaaS leaders, this isn't a nice-to-have—it's essential for making the quick, informed decisions that drive growth. You can dive deeper into the strategies behind this by exploring our guide on real-time data analytics.
A real-time analytics platform doesn't just make your business faster; it makes it smarter. By closing the gap between an event and the insight it generates, you build a responsive organization that can seize opportunities your competitors—still waiting for their daily reports—will completely miss.
Real-Time Analytics vs Batch Analytics at a Glance
To really get a feel for the difference, it helps to see the two approaches side-by-side. Each has its place, but only one is built to keep up with the speed of business today.
The table below breaks down the core differences, from how data is handled to the problems each is best suited to solve.
| Attribute | Real-Time Analytics | Batch Analytics |
|---|---|---|
| Data Processing | Continuous stream, event by event | Large, accumulated chunks |
| Latency | Milliseconds to seconds | Minutes, hours, or days |
| Data Scope | Current, up-to-the-second data | Historical, periodic snapshots |
| Ideal Use Cases | Fraud detection, live monitoring | Payroll, billing, weekly reports |
Ultimately, while batch analytics is great for understanding the past, real-time analytics is what allows you to shape the future as it unfolds. It’s the key to staying agile and competitive.
How a Real-Time Analytics Platform Architecture Works
To really get what a real-time analytics platform does, you have to look under the hood. The architecture might seem complicated at first glance, but it’s a lot like a high-tech factory assembly line. It takes raw materials (your data) and turns them into a finished product (actionable insights) with astonishing speed.
Let's follow a piece of data as it moves through the five core stages of this digital factory. Each step is designed to make sure insights land exactly when you need them—right now.
The flow is actually pretty straightforward: raw data comes in, gets processed on the fly, and comes out the other side as an insight you can act on.
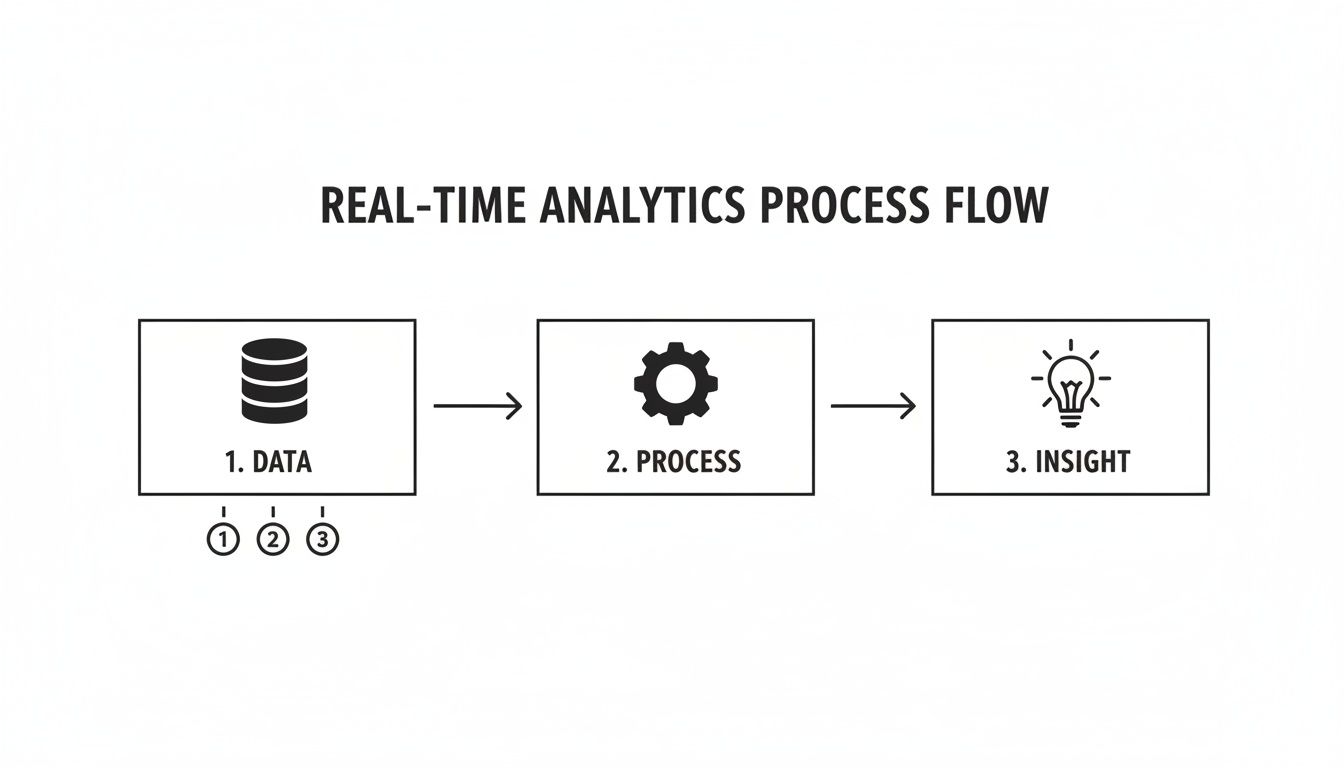
This diagram shows that simple, powerful sequence in action. It's a continuous, automated loop designed for immediate results.
Stage 1: Data Ingestion
Think of data ingestion as the factory’s loading dock. This is the entry point for raw data pouring in from all over the place—user clicks, application logs, IoT sensor pings, support tickets, you name it. The key difference here is that the data isn't delivered in neat, scheduled batches. It’s a constant, never-ending stream of events.
The main job here is to get that data off the truck and into the system as quickly and reliably as possible. This is where a technology like Apache Kafka often comes in. It acts as a massive, organized entryway that can handle millions of events every second without dropping a single one. It ensures every piece of data is received and queued up, ready for the next step.
Stage 2: Stream Processing
Once inside, the data hits the main assembly line: the stream processing engine. This is where the real transformation begins. Unlike a batch system that waits around for a giant pile of data to work on, a stream processor handles each event individually as it zips past.
This engine juggles several critical jobs in real time:
- Enrichment: It adds missing context, like matching a user ID to a full customer profile.
- Transformation: It cleans up messy data and restructures it into a consistent, usable format.
- Aggregation: It performs quick calculations, like counting login failures over the last 60 seconds.
Tools like Apache Flink or Apache Spark** Streaming** are the super-fast robotic arms on this assembly line. They execute complex jobs with sub-second latency, making sure the data is shaped and primed for analysis without ever stopping the flow.
Stage 3: Real-Time Storage
Next, the freshly processed data is sent to a special kind of warehouse built for speed. This is the real-time storage layer. It’s not a dusty, long-term archive; it’s more like a fast-access holding area where data is kept hot and ready for immediate querying.
This stage is the secret sauce that makes hyper-fast analytics possible. By storing data in a way that’s optimized for lightning-fast retrieval, dashboards and ad-hoc queries can return answers in milliseconds, even when scanning billions of recent events.
Databases like Apache Druid or ClickHouse are purpose-built for this job. They index incoming data to make it instantly available for interactive analysis, powering the live dashboards and data exploration tools that users depend on. Mapping out how these systems connect can get complex, but our guide on creating data architecture diagrams can help you visualize the flow.
Stage 4: Querying and Visualization
Now we’ve reached the quality control station, where the finished product is inspected and displayed. The querying and visualization layer is the part that people actually see and use—the dashboards, charts, and reports that turn a flood of numbers into a clear, compelling story.
When a user asks a question—say, "How many new sign-ups did we get in the last 10 minutes?"—the query engine instantly pulls the answer from the real-time storage layer. A front-end tool like Grafana or a custom-built interface then translates that data into visuals that update in the blink of an eye.
Stage 5: Alerting and Actions
This final stage is where the factory's output triggers real-world change. The alerting and action system is like an automated shipping department. It doesn't just show you what's happening; it actually does something about it.
Based on rules you set or predictions from a machine learning model, this component can automatically:
- Ping an engineering team the second error rates begin to spike.
- Trigger a workflow in a CRM to reach out to a customer at risk of churning.
- Block a transaction that looks like fraudulent activity.
This is where you see the true value of a real-time analytics platform. It closes the loop by connecting an insight directly to an intelligent, automated response, allowing the business to react to opportunities and threats the moment they emerge.
Why Your Business Needs Real-Time Analytics Now
In a world where customer loyalty can evaporate in seconds, running your business on yesterday's data is like trying to drive a race car by looking in the rearview mirror. The move from weekly reports to live insights isn't just a tech upgrade; it’s a complete overhaul of how modern businesses compete and win. A real-time analytics platform eliminates the costly delay between something happening and you being able to do something about it.
This isn't just a passing trend. It’s a market-wide sprint towards immediacy, driven by the rapid pace of digital transformation initiatives everywhere. Companies have stopped asking if they need instant insights and are now focused on how fast they can implement them.
The market growth tells the story loud and clear. The real-time analytics market is on a tear, projected to rocket from US27.6 billion to US147.5 billion by 2031. That’s a compound annual growth rate (CAGR) of 26%, fueled by technology that makes sub-second data processing a reality. You can dig into the full report on market research for real-time analytics.
Moving from Reactive to Proactive
At its heart, a real-time analytics platform flips the script, turning your business from a reactive organization into a proactive one. Instead of analyzing why a customer churned last month, you can spot the subtle behaviors that signal they're about to.
Think about it. A user suddenly stops engaging with a core feature, or their session times become shorter and more sporadic. A traditional analytics tool might flag this trend in next week's dashboard update—long after the user has made up their mind. A real-time system, on the other hand, alerts you the moment it happens. This gives your success team a chance to step in with a helpful email or a targeted in-app message before it's too late.
This proactive approach has a direct and measurable impact on your bottom line:
- Drastically Reduces Churn: Catching signs of frustration early lets you solve problems before they become deal-breakers, saving priceless customer relationships.
- Maximizes Revenue Opportunities: Instantly identify power users who are perfect candidates for an upgrade or spot cross-sell opportunities based on what they're doing in your product right now.
- Enhances Operational Efficiency: Pinpoint performance issues or API failures the second they occur, allowing your engineering team to ship a fix before most customers even notice a problem.
The True Cost of Delay
Putting off the move to real-time analytics isn't a neutral decision. It's an active choice to fall behind. Every moment you operate on stale data is a moment a competitor could be swooping in to delight a customer you're about to lose or capitalizing on a market shift you haven't even seen yet.
In today's economy, speed is a currency. The ability to understand and act on data in the present moment is the single greatest advantage a business can have. Waiting for data is waiting to fail.
The financial hit is real. Saving just one high-value customer from churning can pay for your entire analytics platform. Catching a widespread bug in minutes instead of hours can save thousands in support tickets and protect your brand's hard-won reputation. The ROI isn't some abstract concept; it's measured in retained revenue, expansion deals, and massive operational savings.
Ultimately, the question isn't whether your business can afford a real-time analytics platform. It's how much longer you can afford to operate without one.
Powerful Use Cases for Revenue and Retention

A real-time analytics platform isn't just a faster dashboard. It’s an engine for growth that directly connects raw data to real dollars. By seeing what customers are doing and saying as it happens, you can stop reacting to problems and start proactively creating opportunities. This is where the magic really happens—applying this speed to the metrics that make or break a SaaS business: churn, revenue, and product development.
Forget waiting around for cancellation surveys to tell you what went wrong last month. A real-time system gives you the foresight to act when it actually matters. It turns fuzzy, qualitative feedback from tools like Zendesk and Intercom into hard, quantifiable signals that can drive revenue. Your teams can finally stop guessing and start making confident decisions based on what’s happening right now.
Proactive Churn Prediction
Customer churn is usually a silent killer. It builds up slowly, with small warning signs that are easy to miss until a customer is already out the door. A real-time analytics platform acts as your smoke detector, picking up on those subtle shifts in behavior that scream "churn risk." It does this by constantly pulling in and making sense of data from all over your business.
Think about a high-value customer who suddenly stops using one of your key features. Around the same time, they log a support ticket for a minor bug, and their tone in a recent support chat was clearly frustrated. A traditional BI tool looking at last week's data would miss the connection entirely. A real-time platform, however, pieces it all together instantly.
By connecting the dots between usage data, support tickets, and chat sentiment in the moment, you can identify an at-risk customer days or even weeks before they formally churn. This creates a critical window for your customer success team to intervene.
This automated detection can kick off a whole retention workflow. For example:
- Ping the assigned Customer Success Manager with a quick summary of what’s going on.
- Automatically create a high-priority ticket for engineering to squash the bug that’s causing the frustration.
- Enroll the user in an automated email campaign that reminds them of the value of the feature they stopped using.
This proactive approach transforms customer success from a reactive support desk into a powerful retention engine that actively protects your bottom line.
Identifying Revenue and Expansion Opportunities
The same real-time engine that flags churn risk can also shine a spotlight on growth opportunities. Your customer data is packed with buying signals, but they’re usually buried in unstructured text from sales calls, support chats, and feature requests. A real-time analytics platform digs them up and serves them to you on a platter.
For instance, a user on your mid-tier plan might keep asking your support team about features only available in the enterprise package. Or maybe a free-trial user is acting like a power user, adopting advanced features way faster than average. A real-time analytics platform catches these patterns the moment they emerge.
This lets you act on expansion opportunities when a customer's interest is at its peak. You can trigger a personalized upgrade offer right then and there, or notify a sales rep to reach out with a targeted demo. It’s a far more effective approach than blasting out generic marketing campaigns and just hoping something sticks.
Data-Driven Product Prioritization
One of the toughest jobs for any product team is deciding what to build next. Without solid data, the loudest voice in the room often wins. A real-time analytics platform cuts through the noise and replaces opinions with objective numbers, showing you the real business impact of bugs and feature requests.
Imagine your support channels are getting flooded with feedback. A real-time platform can scan every ticket, chat, and call transcript to spot recurring themes. But here’s the important part: it also connects those issues to the specific customers reporting them and how much they're worth.
This creates a crystal-clear prioritization framework:
- Quantify Bug Impact: The platform might calculate that a specific bug is affecting 15% of your enterprise customers, putting $50,000 in monthly recurring revenue at risk. Suddenly, that bug is a five-alarm fire for the engineering team.
- Surface High-Value Feature Requests: It could also spot a feature request mentioned by three high-growth prospects in your sales pipeline, who are collectively worth over $250,000 in new annual contract value. That’s a powerful signal for the product roadmap.
- Link Feedback to Revenue: By tying every piece of feedback to a dollar amount—whether it's revenue at risk or potential new revenue—the platform gives your product managers an objective way to decide where to focus.
This data-driven loop ensures your development efforts are always aimed at the work that will most directly impact customer retention and revenue. It closes the gap between what customers are asking for and what your team actually builds.
Choosing the Right Real-Time Analytics Platform

Picking the right real-time analytics platform is way more than a technical check-the-box exercise. It's a strategic investment that can directly impact your revenue and customer loyalty. With so many vendors out there making nearly identical claims, you have to cut through the marketing fluff and get down to what really matters for your business. A good evaluation framework helps you see past the slick demos and figure out which solution can actually handle your demands for speed, scale, and accuracy.
For anyone in a CTO or product leadership role, the evaluation boils down to five critical areas: latency, scalability, integration, accuracy, and the total cost of ownership. Get one of these wrong, and your powerful new asset quickly becomes a frustrating bottleneck.
Latency and Performance
The whole point of "real-time" is speed, right? But the term gets thrown around a lot. True real-time means getting insights with sub-second latency. When you're talking to vendors, you need to push them on how fast their platform can actually ingest data, process it, and have it ready for you to query. Ask for benchmarks. Ask for proof of how it performs under a heavy load.
A system that takes several minutes to update a dashboard isn't living up to the promise. Think about it—for something like fraud detection or spotting a customer about to churn, a few seconds of delay can mean the difference between getting ahead of a problem and cleaning up a mess.
Scalability and Integration
Here’s a guarantee: your data volume is going to grow. The platform you choose has to scale right along with it as you add more data sources—from user event streams and application logs to support tickets and CRM updates. That means it needs an architecture built to handle sudden spikes in data without slowing down or sending your costs through the roof.
Just as important is how well it plays with your other tools. A real-time analytics platform should be the central nervous system of your operations, not another data silo. It absolutely has to connect with the tools your teams live in every day.
- Support Systems: Does it integrate with Zendesk, Intercom, or whatever helpdesk you use to analyze customer conversations?
- Development Tools: Can it automatically create tickets in Jira or Linear when it spots a bug or a popular feature request?
- Sales and Marketing: Can it push alerts to your CRM when a customer is ripe for an upsell?
The whole idea is to get insights into the workflows where people can actually act on them.
The best platforms don't just show you data; they make it actionable. They bridge the gap between an insight and a decision by plugging directly into your existing tech stack, turning data into automated workflows that move the needle.
Data Accuracy and Reliability
Speed is worthless if the data is wrong. A platform that gives you fast but flawed insights can lead you to make some truly terrible business decisions. Accuracy all comes down to the system’s ability to process data without dropping any of it and to correctly connect the dots between different sources. In fact, one of the biggest challenges teams run into is simply maintaining high data quality, which is the foundation of any analytics you can actually trust. You can read more in our guide on solving data quality issues.
Ask vendors how they validate data and guarantee reliability. For example, a platform like SigOS achieves an 87% correlation accuracy, so when it tells you a specific support ticket is tied to a revenue-impacting bug, you can bet it's a connection worth investigating.
This focus on accuracy is more critical than ever, especially as AI-powered features become standard. Real-time analytics platforms are now central to the market, with North America holding a 36.41% global share and 61% of enterprises now on board. This massive growth is fueled by cloud adoption, which makes AI-driven insights for everything from personalization to fraud detection possible. You can find more details in this real-time analytics market report.
Vendor Selection Checklist
To make your evaluation process a bit easier, it helps to use a checklist to compare different solutions against what you truly need. This table breaks down what to look for and what a best-in-class solution should be able to deliver.
| Evaluation Criterion | What to Look For | How Top Solutions Deliver |
|---|---|---|
| Performance | Sub-second query latency and data freshness. | Sub-minute analysis times from ingestion to insight. |
| Integrations | Native connectors for tools like Jira, Zendesk, and CRMs. | Automated, bi-directional workflows with key systems. |
| Accuracy | High correlation accuracy and reliable data processing. | Proven models with 85%+ accuracy in linking data points. |
| Security | End-to-end encryption and strict data privacy policies. | A security-first architecture where models are not retrained on customer data. |
| TCO | Predictable pricing and low maintenance overhead. | A fully managed SaaS model that eliminates infrastructure costs. |
By focusing on these core pillars, you can confidently choose a platform that not only meets your technical requirements but also becomes a genuine driver of business growth.
Got Questions About Real-Time Analytics? We've Got Answers.
Jumping into real-time analytics can feel like a big step, and it's natural to have questions. Even when the benefits are clear, the "how" can seem a bit fuzzy. Let's tackle some of the most common questions head-on to clear things up.
Think of this as your practical guide to understanding what modern platforms are all about—accessible, secure, and built for businesses of any size.
How Is This Different From My BI Dashboard?
This is easily the most common question we hear. The simplest way to think about it is with an analogy:
Your traditional BI dashboard—think Tableau or Power BI—is like a high-resolution photograph of your business. It's a fantastic, detailed snapshot based on data from yesterday, last week, or last month. It’s perfect for historical analysis and spotting big-picture trends over time.
A real-time analytics platform, on the other hand, is a live video feed. It processes data as it happens, showing you what’s going on right now. A BI tool might tell you how many customers churned last quarter; a real-time platform alerts you that a specific customer is showing signs of churn this very minute.
Here’s the breakdown:
- Speed: BI dashboards update on a schedule, maybe every 24 hours. Real-time platforms update in seconds or even milliseconds.
- Data Source: BI usually pulls from a tidy, structured data warehouse. Real-time platforms tap into a constant flow of raw events from all kinds of sources.
- Purpose: BI is for strategic, backward-looking thinking. Real-time analytics is for immediate, in-the-moment operational decisions.
Is Implementation A Massive Engineering Project?
A decade ago? Absolutely, yes. Building a real-time stack from scratch meant stitching together complex open-source tools and having a dedicated team of engineers just to keep the lights on. It was a luxury only the biggest tech giants could afford.
Thankfully, that’s no longer the case. Modern SaaS platforms have done the heavy lifting for you, handling all the complex infrastructure behind the scenes. Implementation today often just means connecting your existing tools (like Zendesk, Jira, or your own application logs) using pre-built integrations. A small team can get a system up and running in days, not months, without needing a PhD in stream processing.
How Secure Is Our Data In A Real-Time Platform?
Data security is non-negotiable, and it's table stakes for any serious vendor in this space. The best platforms are built with a security-first mindset from the very beginning.
You should be looking for platforms that offer end-to-end encryption. This protects your data both while it’s streaming into the platform (in transit) and when it’s stored (at rest). It's also crucial to check their data privacy policies. A top-tier provider will guarantee your sensitive customer data is never, ever used to train their own AI models.
Things like strict access controls and compliance with standards like SOC 2 are also key signs that a vendor takes protecting your most valuable asset seriously.
Can We Even Afford Real-Time Analytics?
The cost has come way down. Thanks to cloud-based, multi-tenant architectures, you're not on the hook for buying and maintaining massive server clusters anymore. Most modern platforms use a consumption-based pricing model, so you pay for what you actually use. This makes it a scalable solution for businesses of all sizes.
The better question might be, can you afford not to?
When you add up the ROI from preventing customer churn, spotting upsell opportunities the moment they appear, and saving engineering hours by focusing on the right problems, the platform often pays for itself many times over. The cost of losing a single enterprise customer can easily be more than the annual cost of the platform that could have saved them.
This blend of affordability and clear ROI is why the market is exploding. The streaming analytics market is projected to jump from 23.4 billion in 2026 to ****128.4 billion by 2030. This is happening because 72% of organizations worldwide are now adopting event-driven architectures to keep up. If you're curious, you can dig into these insights on real-time data integration growth.
Ready to turn your customer feedback into a predictable revenue engine? SigOS connects your support, sales, and product data to reveal which issues are costing you money and which features will drive growth. Discover how SigOS can help you prioritize with confidence.
Keep Reading
More insights from our blog


Ready to find your hidden revenue leaks?
Start analyzing your customer feedback and discover insights that drive revenue.
Start Free Trial →