Real Time Data Processing: Architectures and Tradeoffs
Explore real time data processing architectures, tradeoffs, and implementation strategies to build fast, scalable systems in 2026.

Most real time data processing guides start with the wrong question. They ask how quickly your architecture can process an event, then treat the smallest possible latency as the goal. In production, the better question is simpler: how quickly must a decision happen before the opportunity, risk, or customer context disappears?
That distinction changes the design. A fraud decision may need immediate evaluation, while a product team investigating a support-ticket trend may gain nearly all the value from a pipeline that updates within minutes. The industry has clearly moved toward continuous processing. A 2016 survey of 4,000 big-data professionals found that 92% of companies planned to use stream-processing applications, while 65% already had real-time data pipelines in production and another 24% expected to deploy them before year-end (SiliconANGLE's report on the survey). Adoption, however, doesn't eliminate the need to choose the right level of speed.
When Real Time Actually Matters
The phrase “real time” hides several different operating models. A pipeline that updates a dashboard every few minutes can be real time for a product manager. A security control that must block an event before access is granted needs a much shorter decision path. Treating both workloads as if they require identical infrastructure usually produces an expensive system that solves the technical problem more aggressively than the business requires.
Start with the decision window
Define the last useful moment for action, then work backward. If a customer success manager can respond during the same work session, minute-level freshness may be sufficient. If an automated control must deny a transaction, contain an incident, or update a safety response before the next event arrives, sub-second processing may be justified.
A useful test is to ask what happens when the data arrives late:
- No material consequence: Enhanced batch processing may be enough.
- A person can still act: Near-real-time processing often offers the best balance.
- An automated decision becomes invalid: Low-latency streaming deserves serious consideration.
- A delayed response creates direct exposure: Sub-second processing may be necessary.
Practical rule: Don't buy millisecond latency for a decision that humans won't make until much later.
For SaaS product intelligence, a support-ticket spike rarely requires a response in milliseconds. The value comes from recognizing the pattern while the issue is still active, connecting it to affected accounts, and routing the finding to the right team. A near-real-time pipeline can often support that workflow without the complexity of maintaining the strictest streaming guarantees.
The economics also matter. Independent market research published in 2026 estimated the global real-time analytics market at US****43.8 billion in 2026, with a projection of US****223.3 billion by 2033 at a 26.2% CAGR (the cited market analysis). Those projections reflect strong demand, but they don't prove that every workload needs sub-second infrastructure.
Reserve the sharpest latency for high-stakes paths
Fraud detection, incident response, security enforcement, and safety-sensitive operations can justify a tighter processing budget because the decision loses value rapidly. Teams evaluating security architectures may also benefit from this guide to real time threat detection, particularly when they're mapping event freshness to containment actions.
Product teams should document the threshold instead of inheriting it from a framework default. The real-time data analytics perspective from SigOS is useful here because product intelligence depends on connecting fresh behavior to an action, not merely displaying a constantly changing chart. The right target is the point where faster data changes what the team does.
Streaming vs Micro-Batching Architecture Choices
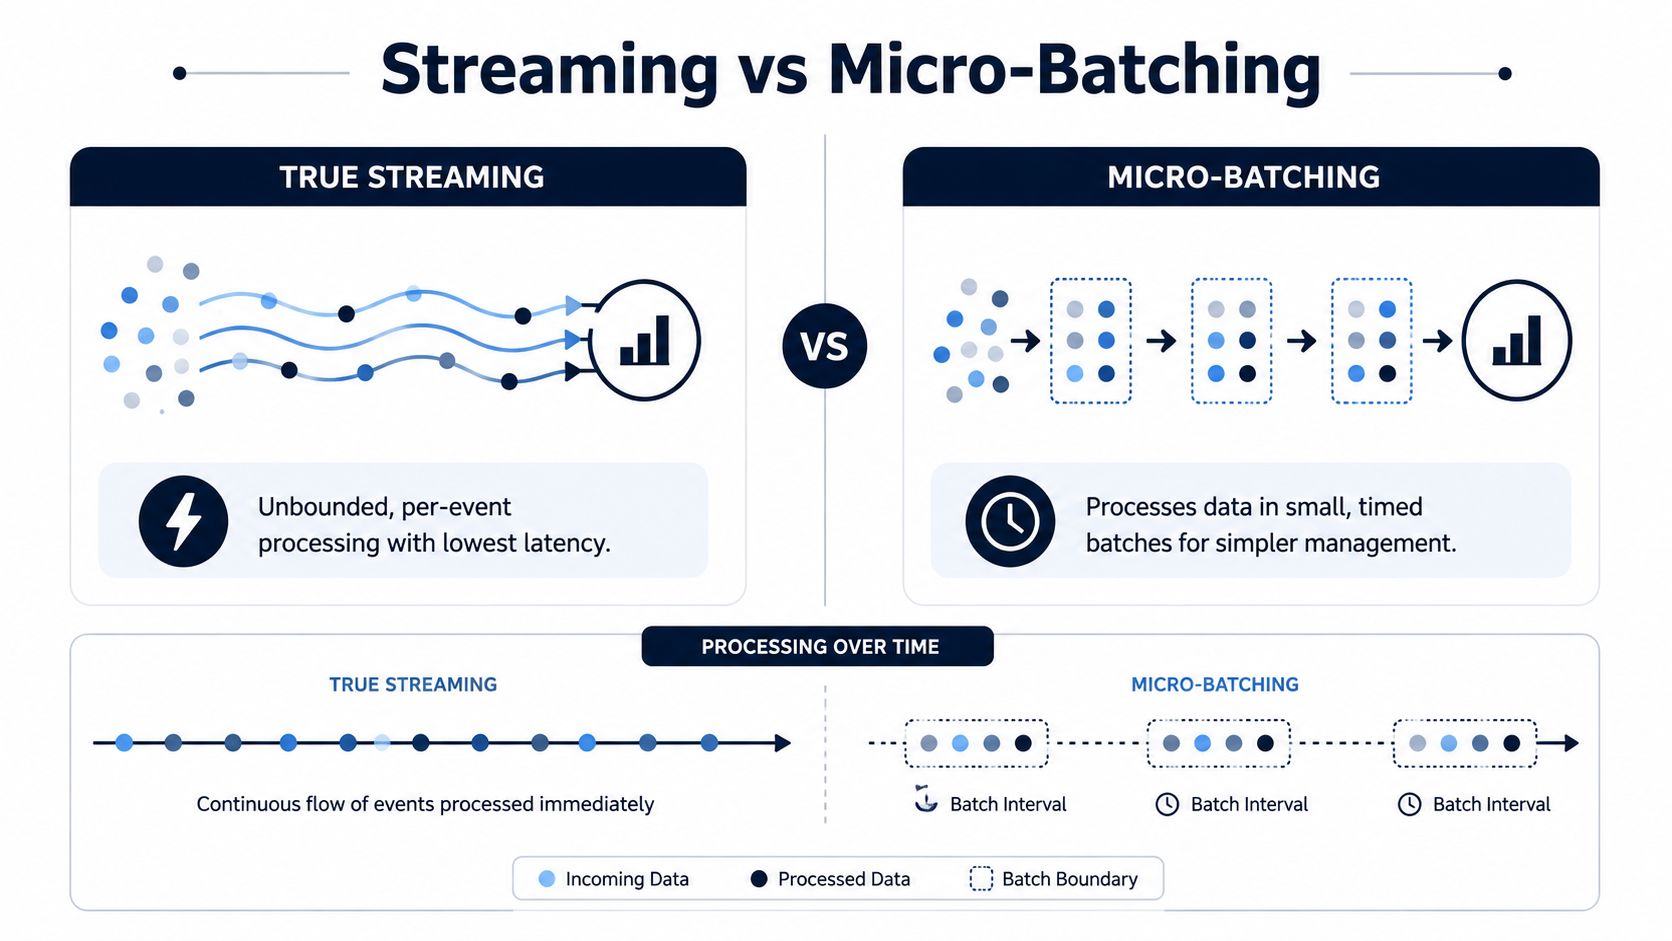
True streaming and micro-batching solve related problems with different compromises. True streaming processes an unbounded flow event by event, which can reduce processing delay and support fine-grained state updates. Micro-batching collects events into small intervals, then processes each interval as a compact batch.
Neither model is automatically superior. A streaming engine can provide faster reactions, but it also demands careful handling of state, event time, late data, checkpoints, replay, and backpressure. Micro-batching can simplify execution and make batch-oriented transformations easier to operate, although each interval introduces waiting time.
Match the model to the workload
Benchmark-oriented research separates data latency, the time until new data becomes visible, from query latency, the time required to return a result. A system can ingest continuously and still feel slow if its storage or query layer lags behind (the real-time analytics benchmarking discussion).
Apache Flink generally favors lower latency in benchmarked stream-processing workloads. Spark Streaming has shown higher latency in comparable tests, while offering better tolerance under heavy load through its micro-batch design. That trade is often sensible for product analytics, scheduled enrichment, and workloads where predictable throughput matters more than immediate event-by-event action.
A market data consumer, such as a real-time Solana price data feed, may need continuous updates because each new event can affect an active decision. A customer usage aggregation pipeline may not. The architecture should follow the consequence of delay, not the popularity of the tool.
| Characteristic | True Streaming | Micro-Batching |
|---|---|---|
| Processing model | Per-event computation | Timed groups of events |
| Latency profile | Lowest achievable delay | Adds interval-based waiting |
| State handling | Continuous and often complex | More closely aligned with batch execution |
| Failure recovery | Requires careful checkpoints and replay | Can simplify recovery around batch boundaries |
| Best fit | Immediate alerts, event-driven controls, complex live state | Product analytics, heavy transformations, workloads tolerant of short delays |
The benchmark evidence doesn't mean Spark Streaming is unsuitable for real time data processing. It means the word “real time” doesn't tell you enough. Specify the acceptable delay, event pattern, state complexity, recovery behavior, and load profile before selecting the engine.
Core Components of Real-Time Systems
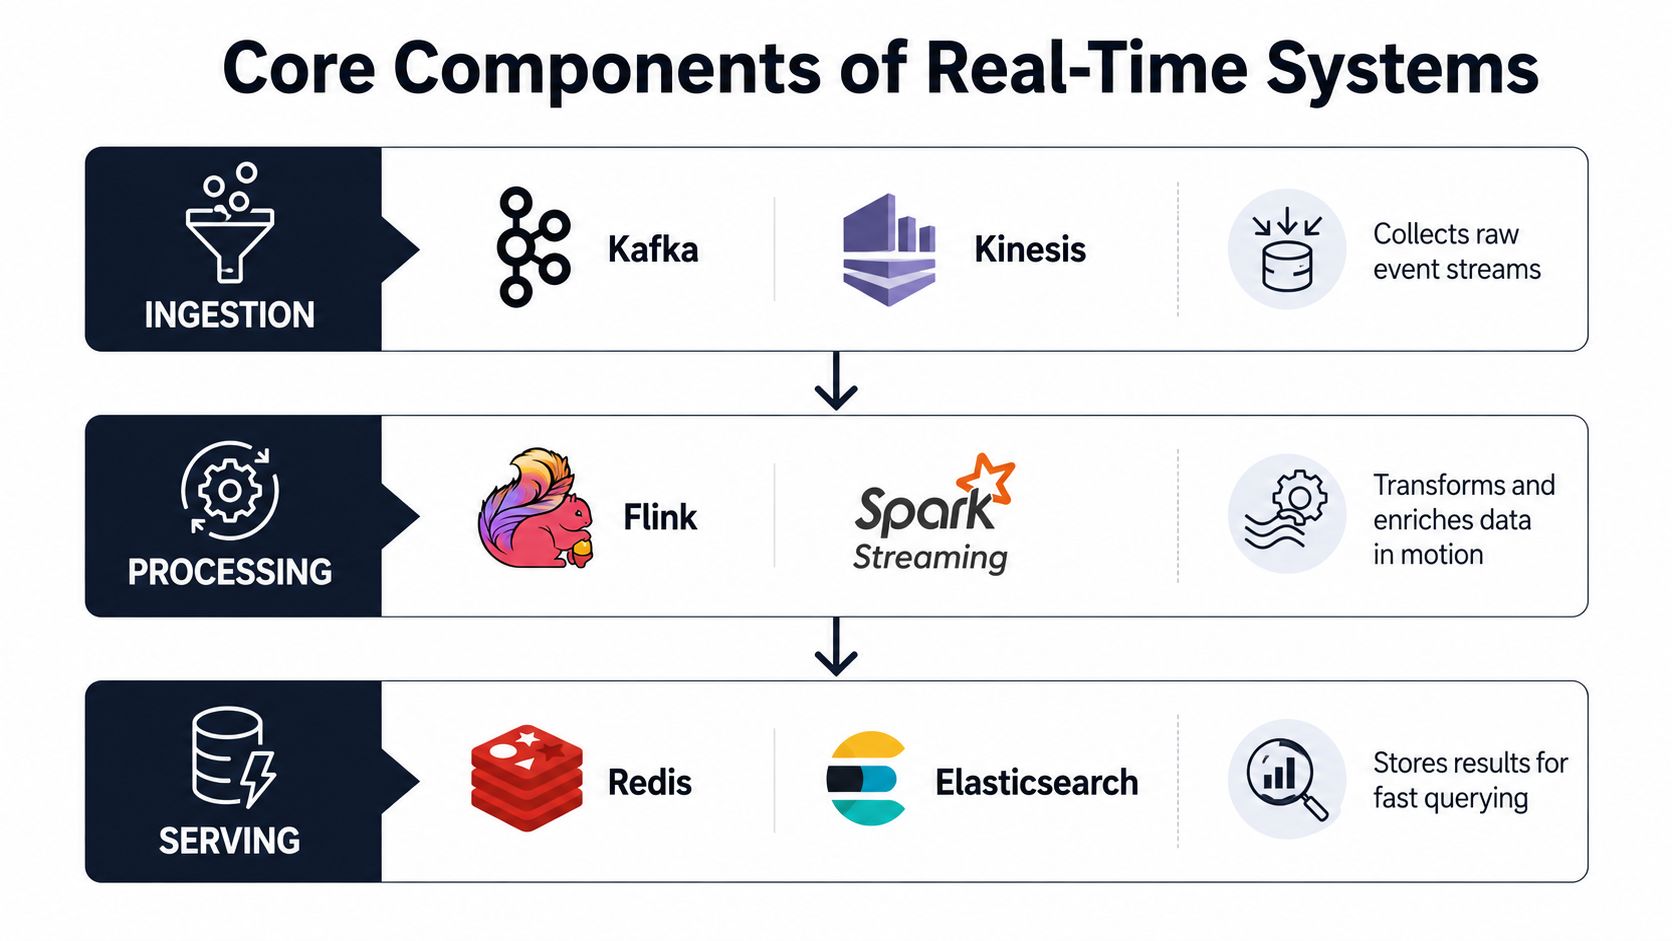
A production pipeline is a chain of independently failing systems. The broker can accept events while the processor is stalled. The processor can calculate correct aggregates while the serving layer exposes stale results. A dashboard can remain available while showing an incomplete window.
Ingestion establishes the contract
Kafka, Kinesis, and Pulsar commonly sit at the ingestion layer. Their job is to accept events, preserve ordering where required, separate producers from consumers, and support replay after downstream failures. They aren't interchangeable with an analytics database or a stream processor.
The ingestion contract should define event identity, timestamps, partitioning, retention, schema behavior, and retry semantics. If producers emit duplicate or ambiguous events, downstream exactly-once processing won't repair the underlying business meaning. Idempotent consumers and durable event identifiers often matter more than a theoretical guarantee stated in a product brochure.
Processing turns events into decisions
Flink, Spark Streaming, and Storm can filter, enrich, join, aggregate, and evaluate windows while data moves through the system. The difficult part is state. A rolling usage count, account-level risk score, or session-level anomaly detector must retain enough context to calculate the next result, then recover that context after a restart.
Backpressure appears when downstream processing can't keep up with ingestion. A healthy design makes that condition visible and gives operators choices, such as slowing producers, expanding capacity, dropping noncritical work, or routing overflow for later processing. Hiding backpressure only moves the failure into memory, storage, or query freshness.
The data architecture diagrams resource from SigOS can help teams communicate these boundaries before they commit to implementation. Draw the path from producer to consumer, then mark every place where buffering, transformation, state, or independent failure can occur.
Serving determines what users see
Redis can support fast lookups for operational decisions, while Elasticsearch can serve search-oriented exploration and alert views. Other systems may provide SQL analytics over fresh events. The choice depends on whether consumers need point reads, text search, aggregations, or a combination.
Keep the serving contract explicit. A result can be correctly computed but unavailable to the application. Conversely, a fast query can return an answer built from stale or partial data. Reliability starts when teams treat freshness, completeness, and query behavior as separate properties.
Choosing Frameworks for Your Workload
Framework selection works better as a constraint exercise than as a popularity contest. Start with the decision path, then evaluate the event model, state requirements, query behavior, and operational ownership.
Choose by latency and state
Apache Flink is a strong candidate when the workload needs continuous event processing, substantial state, event-time handling, and tight latency control. Fraud scoring, session analysis, and complex windowed joins often benefit from that model, provided the team can operate checkpoints, state backends, scaling, and recovery.
Spark Structured Streaming fits teams already invested in Spark and workloads that benefit from a unified batch and streaming programming model. Its micro-batch behavior can be a reasonable trade when the business accepts short delays and the processing logic resembles existing Spark transformations.
Kafka Streams makes sense when processing is closely coupled to Kafka and the team wants an application-embedded model rather than a separate processing cluster. It can reduce platform sprawl, but application teams still own state, deployment, upgrades, and operational diagnosis.
Consider managed services carefully
AWS Kinesis Data Analytics and Google Dataflow can reduce infrastructure administration. Managed services don't remove design responsibility. Teams still need to define event-time behavior, schema evolution, replay, access controls, data retention, cost boundaries, and failure recovery.
Use this sequence:
- Write the business SLO: State how fresh the result must be and what action depends on it.
- Describe the state: Identify whether processing is stateless, windowed, keyed, or dependent on joins.
- Test failure behavior: Stop consumers, delay inputs, introduce duplicates, and send late events.
- Measure the serving path: Confirm that results are queryable within the same freshness target.
- Account for team ownership: Choose a system your team can debug during an incident, not only one that wins a benchmark.
A product analytics team may reasonably choose Spark Streaming or a managed service for familiar operations and efficient transformations. A fraud team may prefer Flink when low latency and complex state directly affect authorization outcomes. The framework is only one part of the result. Poor partitioning, oversized state, slow enrichment calls, and weak observability can undermine any engine.
Performance Metrics That Matter
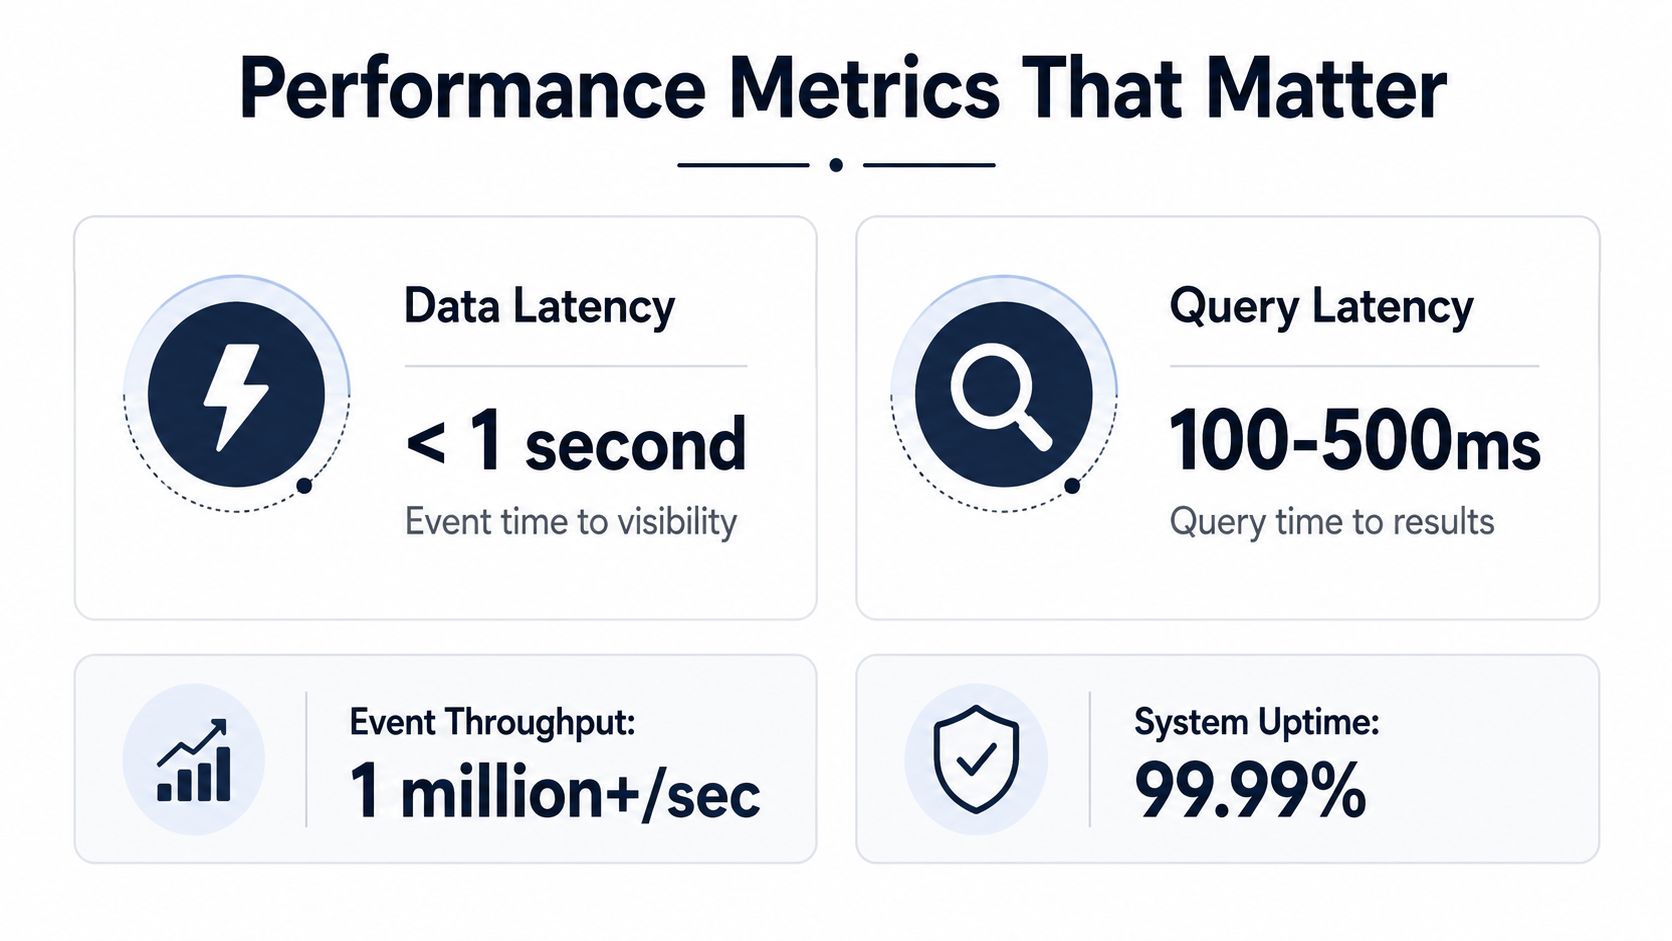
Latency is not one metric. Real time data processing systems have at least two paths to measure: data latency and query latency. Data latency tells you when an event becomes visible. Query latency tells you how long a consumer waits for an answer.
Measure freshness from the source
Record timestamps at event creation, ingestion, processing completion, storage visibility, and query response. Those markers let you separate producer delay from broker lag, processor time, indexing delay, and query execution.
A support-ticket spike demonstrates why this matters. If the processor sees new tickets quickly but the dashboard only exposes updated aggregates after a slow refresh, ingestion speed hasn't improved the decision. The same applies to usage anomalies and revenue-risk signals. The useful window is the time between a signal becoming actionable and the moment the team can still respond.
Benchmark research describes practical targets of a few seconds or even sub-seconds, but the correct target remains workload-specific (benchmark guidance for real-time analytics systems). Don't turn a benchmark target into a product requirement without connecting it to an actual decision.
Build SLOs around outcomes
Track these metrics together:
- End-to-end freshness: Time from source event to usable result.
- Query response: Time from request to returned answer.
- Consumer lag: Distance between the newest available event and the event being processed.
- Completeness: Whether expected events and partitions are represented.
- Decision success: Whether downstream users or services can act within their required window.
An SLO should describe the business promise, not just the processor's internal speed. A minute-level product alert that reliably reaches the owner may outperform a sub-second alert that arrives without account context, fails during schema changes, or overwhelms the team with noise.
Monitoring and Operational Reliability
A streaming pipeline can be running, connected, and wrong. That silent failure is more dangerous than a visible crash because operators may assume the business is receiving current information.
Monitor the system in layers. At ingestion, watch consumer lag, partition health, rejected events, and producer errors. In processing, track event-time delay, processing rate, checkpoint health, state growth, retries, and late-event volume. At serving, measure freshness, query latency, error rates, and the age of the newest visible record.
Detect stale success
Freshness checks should ask whether the newest result is plausible, not merely whether a job is alive. A pipeline that keeps producing identical aggregates can pass a heartbeat check while its source connector has stopped delivering meaningful events.
Useful safeguards include:
- Schema validation: Reject or quarantine incompatible events before they corrupt downstream state.
- Volume bounds: Alert when event rates fall outside expected patterns, while remembering that quiet periods may be legitimate.
- Freshness assertions: Compare source and serving timestamps for each critical dataset.
- Dead-letter handling: Preserve malformed events for inspection and controlled replay.
- Circuit breakers: Stop repeated calls to a failing enrichment service before retries create a cascade.
The operational guidance in this Fivenines real time metrics guide is a useful companion when teams are deciding which measurements belong on an operator dashboard.
Make recovery part of the design
Test restarts, broker interruptions, duplicate delivery, late data, schema changes, and serving-layer outages. Exactly-once semantics can help, but they don't guarantee correct business outcomes when source events are duplicated before ingestion or when an external side effect can't be rolled back.
Operational insight: A pipeline isn't reliable because it never fails. It's reliable when failure is visible, bounded, replayable, and safe for downstream consumers.
Teams should also document ownership. Someone needs to decide whether to pause consumers, accept stale results, replay a partition, or fall back to batch reconstruction. The data quality issues guidance from SigOS provides useful context for treating correctness as an operational responsibility rather than a one-time cleanup task.
Implementation Patterns for Product Teams
Product teams rarely need a live event stream just to watch a dashboard move. They need timely evidence that changes prioritization, customer intervention, or revenue decisions.
A practical pattern starts with multiple signals. Support tickets reveal explicit complaints, chat transcripts show recurring friction, sales calls surface objections, and usage metrics show whether behavior changes after an issue appears. The processing layer normalizes these inputs, associates them with accounts or product areas, and maintains rolling patterns instead of treating each record as an isolated item.
Turn signals into owned actions
Suppose a cluster of tickets describes a workflow failure while affected accounts also show declining usage. A useful pipeline doesn't stop at classifying the text. It links the issue to the accounts, estimates the operational context available to the team, and sends an alert only when the pattern crosses a defined decision threshold.
The action path might look like this:
- Ingest feedback and product events continuously.
- Normalize identities, timestamps, and product areas.
- Enrich records with account and lifecycle context.
- Update rolling issue and behavior aggregates.
- Notify the responsible stakeholder when the pattern is actionable.
- Create a work item in an existing system, preserving the evidence and context.
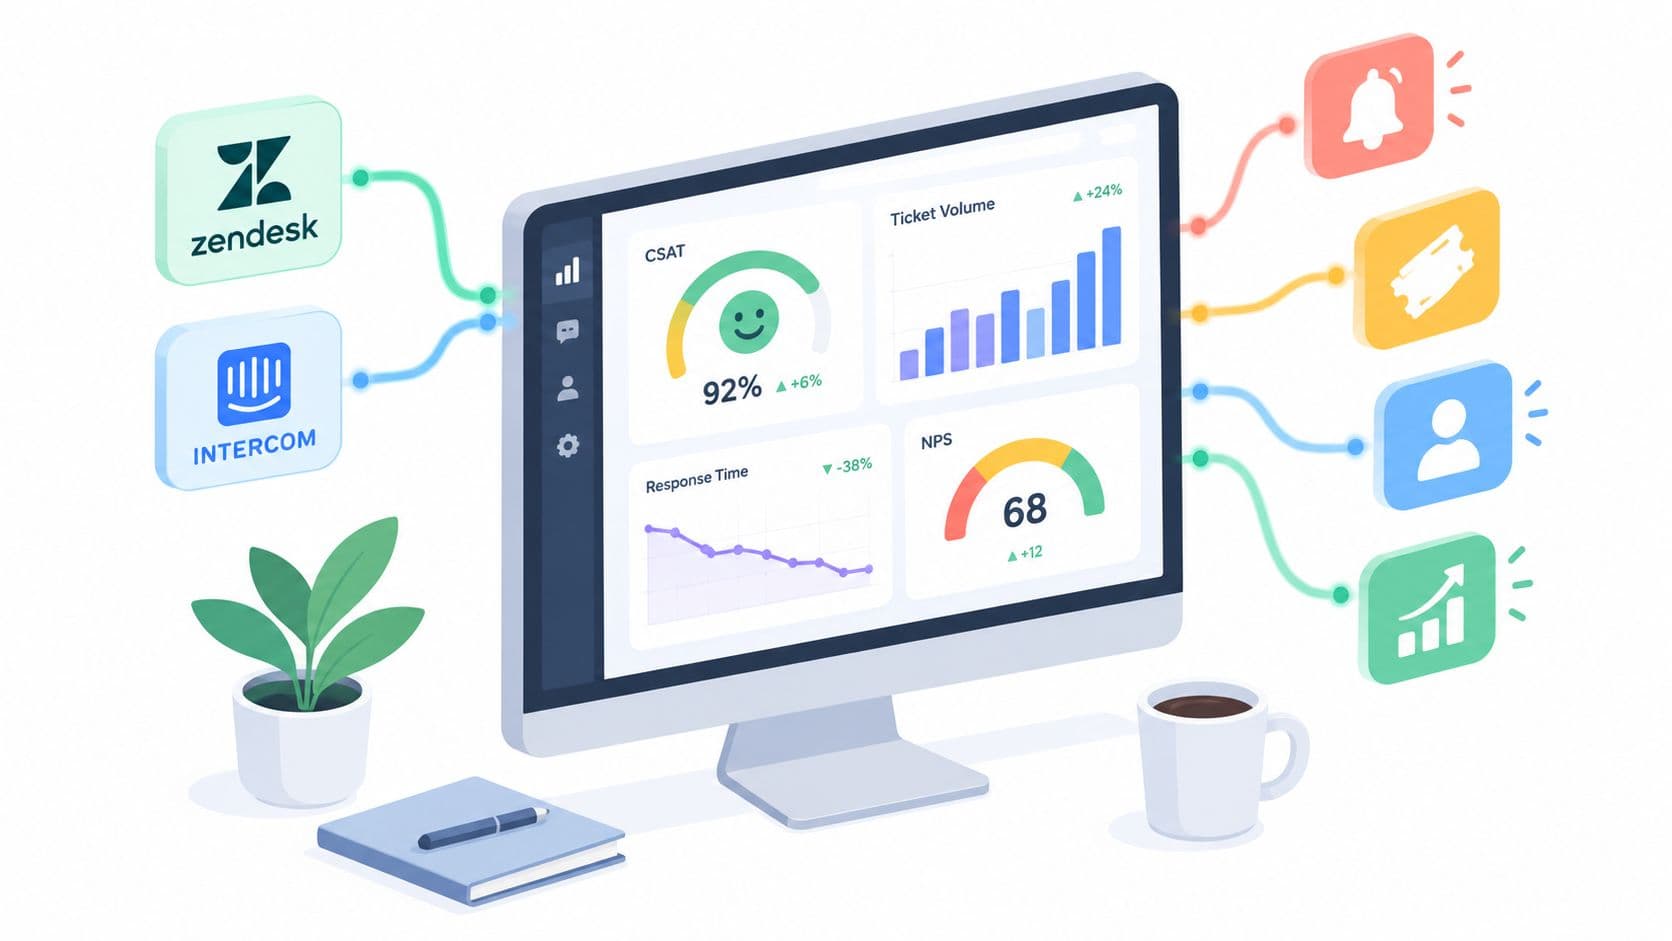
Automated integrations with Zendesk, Intercom, Linear, Jira, and GitHub can connect the insight to the workflow where teams already operate. The key design choice is not whether every event should trigger an alert. It's whether the system can distinguish a meaningful emerging pattern from ordinary feedback noise.
SigOS is one example of a product intelligence platform that ingests support tickets, chat transcripts, sales calls, usage metrics, and real-time API streams to surface behavioral patterns and alerts. Teams should evaluate any similar tool by checking its identity resolution, freshness, explainability, privacy controls, and integration behavior, rather than assuming that faster classification automatically improves prioritization.
Your Real-Time Readiness Checklist
Before choosing a streaming architecture, confirm that the organization can explain why freshness matters and operate the system after launch. A real-time pipeline doesn't solve ambiguous ownership, inconsistent identifiers, weak source data, or missing incident procedures.
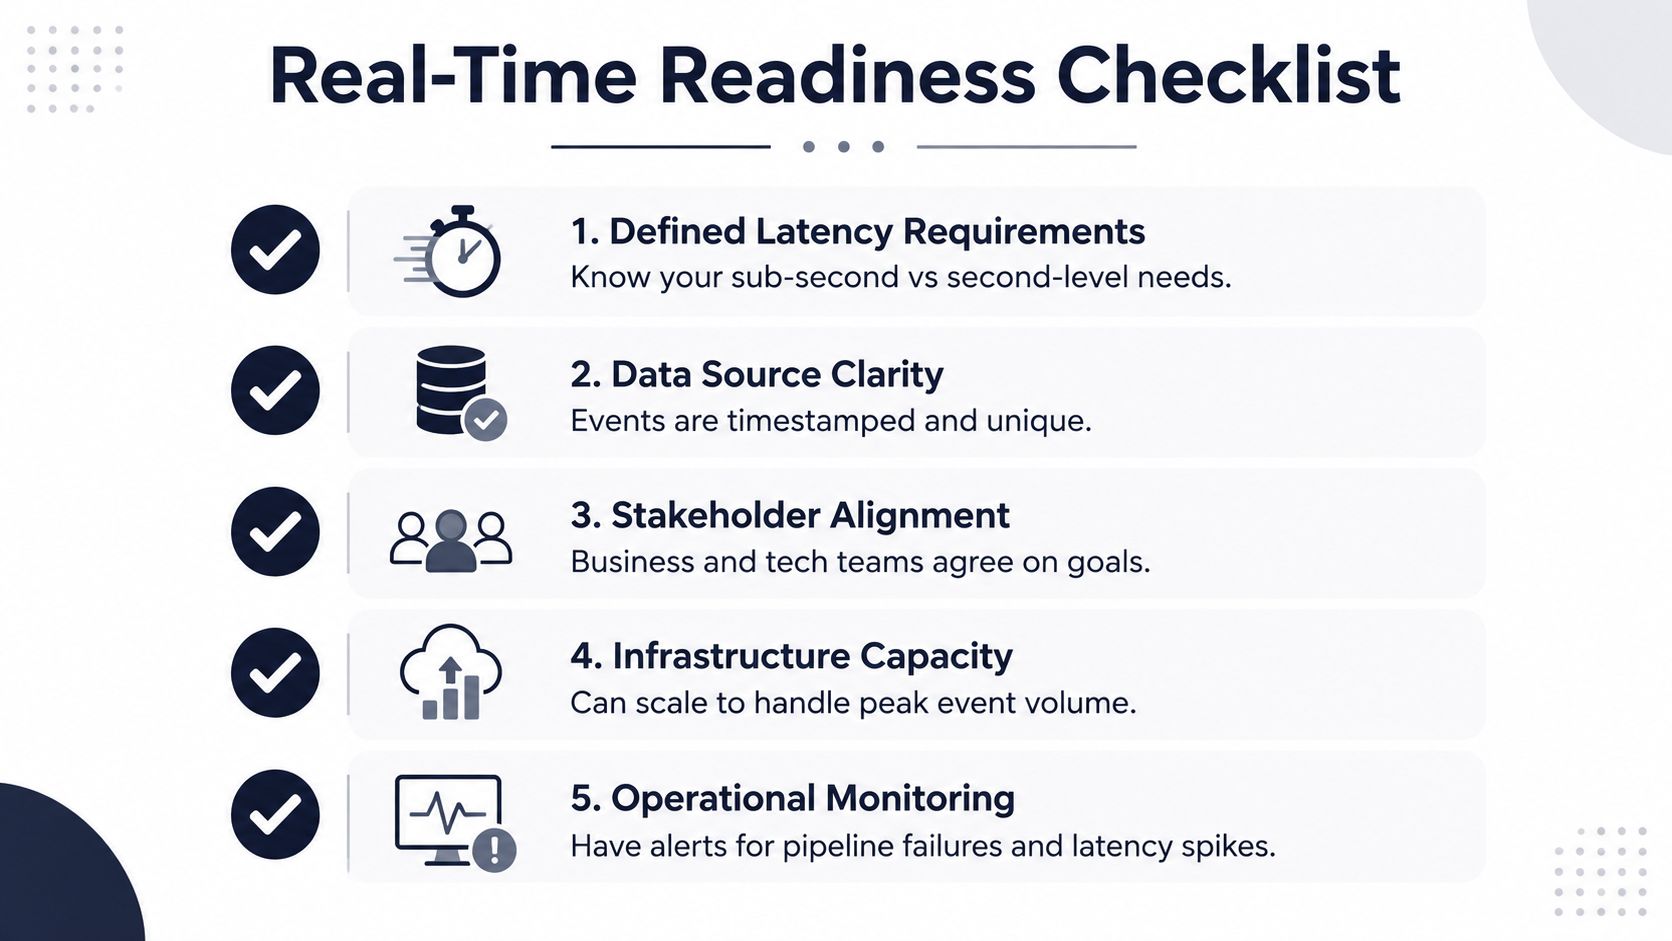
Use the checklist below as a decision gate:
- Defined latency requirements: Write the latest useful decision time, then separate sub-second, second-level, minute-level, and batch needs.
- Data source clarity: Confirm that events carry usable timestamps, stable identities, and a documented schema.
- Stakeholder alignment: Make product, support, revenue, security, and engineering agree on the action each signal should trigger.
- Infrastructure capacity: Test peak behavior, replay, state growth, downstream throttling, and serving-layer limits.
- Operational monitoring: Establish alerts for lag, freshness, schema violations, failed checkpoints, query degradation, and silent inactivity.
Choose enhanced batch processing when decisions are retrospective and source data needs consolidation. Choose near-real-time processing when people can act during the same operating window and a short delay doesn't change the outcome. Choose true streaming when an automated or high-stakes decision becomes invalid within that delay.
The final readiness question is operational: who will investigate stale data at night, replay damaged state, approve schema changes, and explain an incorrect alert to the business? If nobody owns those answers, the architecture isn't ready, regardless of its theoretical latency.
SigOS helps product, support, and growth teams connect customer feedback with usage behavior, identify emerging churn and expansion signals, and route actionable findings into tools such as Zendesk, Intercom, Linear, and Jira. Visit SigOS to see how continuous product intelligence can help your team prioritize customer problems by business impact instead of waiting for another batch report.
Keep Reading
More insights from our blog

Ready to find your hidden revenue leaks?
Start analyzing your customer feedback and discover insights that drive revenue.
Start Free Trial →