Real Time Data: What It Means and When You Actually Need It
Real time data explained without the buzzwords. Learn how streaming works, where it pays off, and when near-real-time is the smarter choice for SaaS teams.
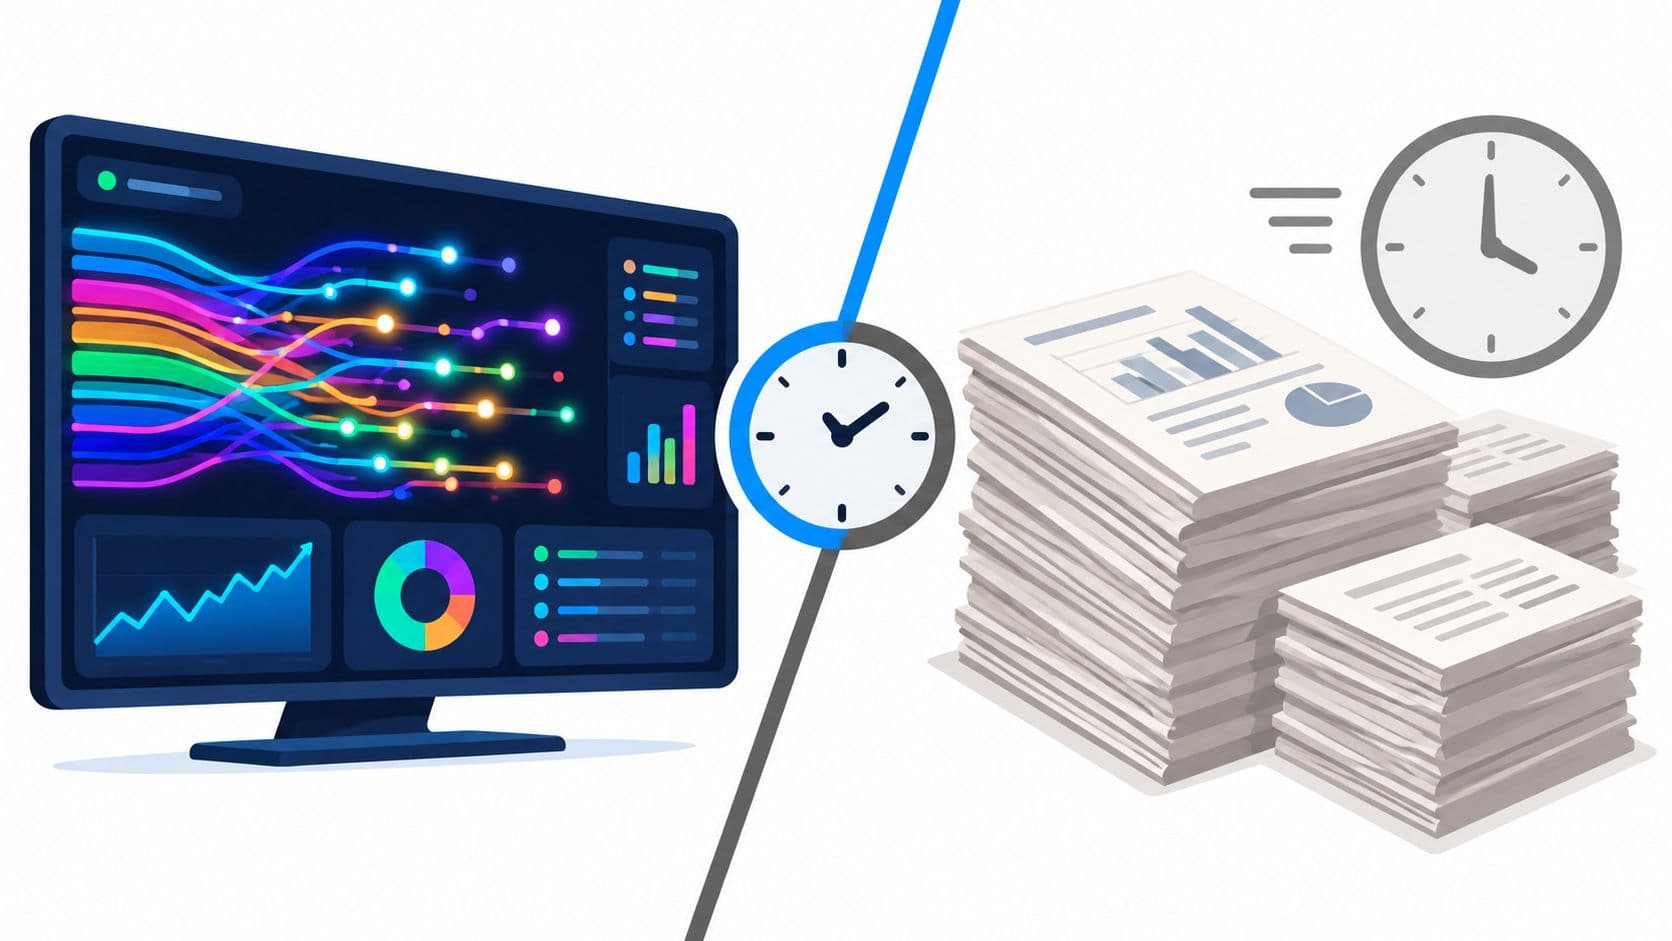
Many teams don't need millisecond-level real time data. 63% of enterprise use cases need data processed within minutes to remain useful, so the practical answer is to make each signal fresh enough for the decision it supports, not to make every pipeline instantaneous.
That challenges the most popular advice about real time data. Faster sounds automatically better, especially when vendors frame milliseconds as the finish line. But speed brings infrastructure, monitoring, storage, and compute demands, and it can make decisions less trustworthy when records arrive incomplete or definitions change.
A support leader deciding whether to escalate a customer issue may need an alert within minutes. A fraud system may need an event almost immediately. A finance team preparing a daily report usually needs consistency more than immediacy. The right question is not, “How fast can we process this?” It's, “How fresh must this signal be before it stops helping someone act?”
What Real Time Data Actually Means in Practice
Real time data is data available fresh enough to influence the next decision. It isn't a universal technical threshold. A sports score ticker feels real time because a viewer cares about changes as the game unfolds. A morning newspaper can be perfectly adequate for yesterday's local events, while a quarterly financial statement serves a different decision entirely.
The same distinction applies inside a SaaS company. A product manager monitoring an outage needs current signals. A team reviewing long-term retention trends can work with scheduled data. Calling both situations “real time” without defining the decision creates confusion and unnecessary cost.
Three useful freshness categories
True real time means events are processed continuously as they arrive. This model fits decisions where waiting can directly create harm or lost opportunity, such as an operational alert, a security response, or an in-session product action.
Near real time means data is refreshed frequently, often through micro-batches. A pipeline may collect events and update a result after a short interval. For many support, product, and usage workflows, this provides enough freshness without the operational burden of continuous processing.
Batch means data is collected and processed on a schedule. Daily financial reporting, historical analysis, and periodic planning often benefit from this approach because it prioritizes completeness, repeatability, and efficient computation.
Practical rule: Define freshness from the action backward. Start with the moment a person or system must respond, then work out how old the data can be at that moment.
The distinction matters in payments, too. Executives evaluating payment infrastructure can use this 2026 payments playbook for executives to separate immediate transaction settlement from broader operational reporting. A payment may need instant handling, while the performance analysis around it may not.
A simple test for your own data
Take each source and ask three questions:
- What decision uses it? Identify the person, workflow, or automated system that consumes the signal.
- How long is the signal useful? A churn warning may remain actionable for a period, while an outage event may lose value quickly.
- What happens if it arrives late? Separate inconvenience from financial, operational, or customer impact.
This mental model pairs well with a deeper explanation of real-time data processing, especially when your team is deciding whether a source belongs in a continuous, near-real-time, or batch workflow. Stop treating “real time” as one bucket. Treat it as a freshness requirement attached to a business decision.
Streaming, Near-Real-Time, and Batch Compared
The three delivery models differ less by branding than by how they move work through a system. Streaming processes events continuously, like a ticker tape. Near-real-time groups events into small batches and refreshes results frequently. Batch waits for a scheduled window and processes a larger collection at once.
Choosing the right data delivery model
| Model | Typical Latency | Relative Cost | Best For |
|---|---|---|---|
| Streaming | As events arrive | Highest operational complexity | Fraud detection, outage response, active-session actions |
| Near real time | Short scheduled intervals | Moderate | Support triage, product usage monitoring, behavioral alerts |
| Batch | Scheduled intervals | Lowest operational complexity | Financial reporting, historical analysis, periodic planning |
These labels describe patterns rather than universal guarantees. A streaming pipeline can still deliver stale results if events sit in a queue, a connector fails, or a transformation becomes overloaded. A carefully designed near-real-time pipeline can be more useful than a poorly operated streaming system.
Streaming is powerful, but it has a larger surface area
Continuous processing requires teams to manage event publication, ordering, retries, schema changes, state, storage, observability, and downstream delivery while traffic changes. It also demands capacity planning that can handle peaks rather than only average conditions.
Near-real-time pipelines often cover the majority of SaaS analytics needs. A support dashboard that refreshes frequently can help a team identify emerging themes without forcing every event through a sub-second architecture. The lower operational burden can leave more time for data quality, definitions, and action design.
Batch remains a sound choice when the decision doesn't depend on current events. A monthly revenue review doesn't become more accurate because the dashboard updates continuously. In that case, batching can simplify reconciliation and reduce the chance that people act on incomplete periods.
For teams evaluating architecture, this guide to AI-ready data infrastructure offers useful context on how ingestion, processing, storage, and downstream use fit together. The important evaluation isn't “Which model is newest?” It's “Which model meets the freshness requirement with acceptable complexity?”
Compare the full business workflow
Don't compare only ingestion speed. Compare the path from event creation to action:
- Publication: How quickly does the source emit the event?
- Transport: Can the ingestion layer accept and deliver it reliably?
- Processing: How long do transformations and joins take?
- Storage: When is the result available for querying?
- Action: How quickly can a person or system respond?
A pipeline is only as real time as its slowest meaningful step. That is why a modest near-real-time design can outperform a faster-looking stream when it produces more complete, understandable, and actionable results.
How a Real Time Data Pipeline Actually Works
Consider a SaaS support alert for a sudden rise in negative chat transcripts. The pipeline starts with event sources, such as a chat platform, ticketing system, product logs, or application events. Each new message or ticket becomes an event with fields such as account, timestamp, topic, sentiment classification, and product area.
The ingestion layer receives those events and moves them into a queue or streaming platform. It should handle retries, preserve useful ordering information, and prevent a temporary downstream failure from discarding records without notice. The stream-processing engine then filters messages, enriches them with account or plan context, and calculates whether negative conversations exceed the team's alert condition.
The result moves into storage, where a current aggregate or event history can be queried. A dashboard may show support leaders the affected product area, while an alerting service sends a notification and an API exposes the result to another application.
The pipeline has more than one consumer
A useful design separates the output from the people and systems that consume it:
- Support operations may receive an alert when a product issue appears across accounts.
- Product managers may query a trend view with historical context.
- Engineering tools may receive a ticket only after confidence and impact rules are met.
- Customer success systems may use the signal to prioritize outreach.
The choice of processing architecture can change the result. A benchmark comparing Apache Spark continuous processing with micro-batching measured 2 ms mean latency versus 528 ms for a rate source. Yet under one Kafka workload, the relationship reversed, with continuous processing at 260 ms and micro-batching at 197 ms. The comparison is documented in this Spark processing benchmark.
That result should change how you evaluate vendors. Connector behavior, coordination overhead, event shape, sink delivery, and workload patterns can matter as much as the engine's headline capability. Test the complete path, not an isolated component.
For teams integrating external property or location signals into a broader event pipeline, RealtyAPI.io documentation provides an example of the kind of source contract engineers must understand before designing ingestion. The same principle applies to support, product, and revenue systems.
A practical guide to building data pipelines should always include failure handling, schema evolution, late events, replay behavior, and ownership. A fast pipeline that can't explain missing or duplicated events isn't operationally real time. It's fast only when everything goes well.
Latency Is Not the Whole Story
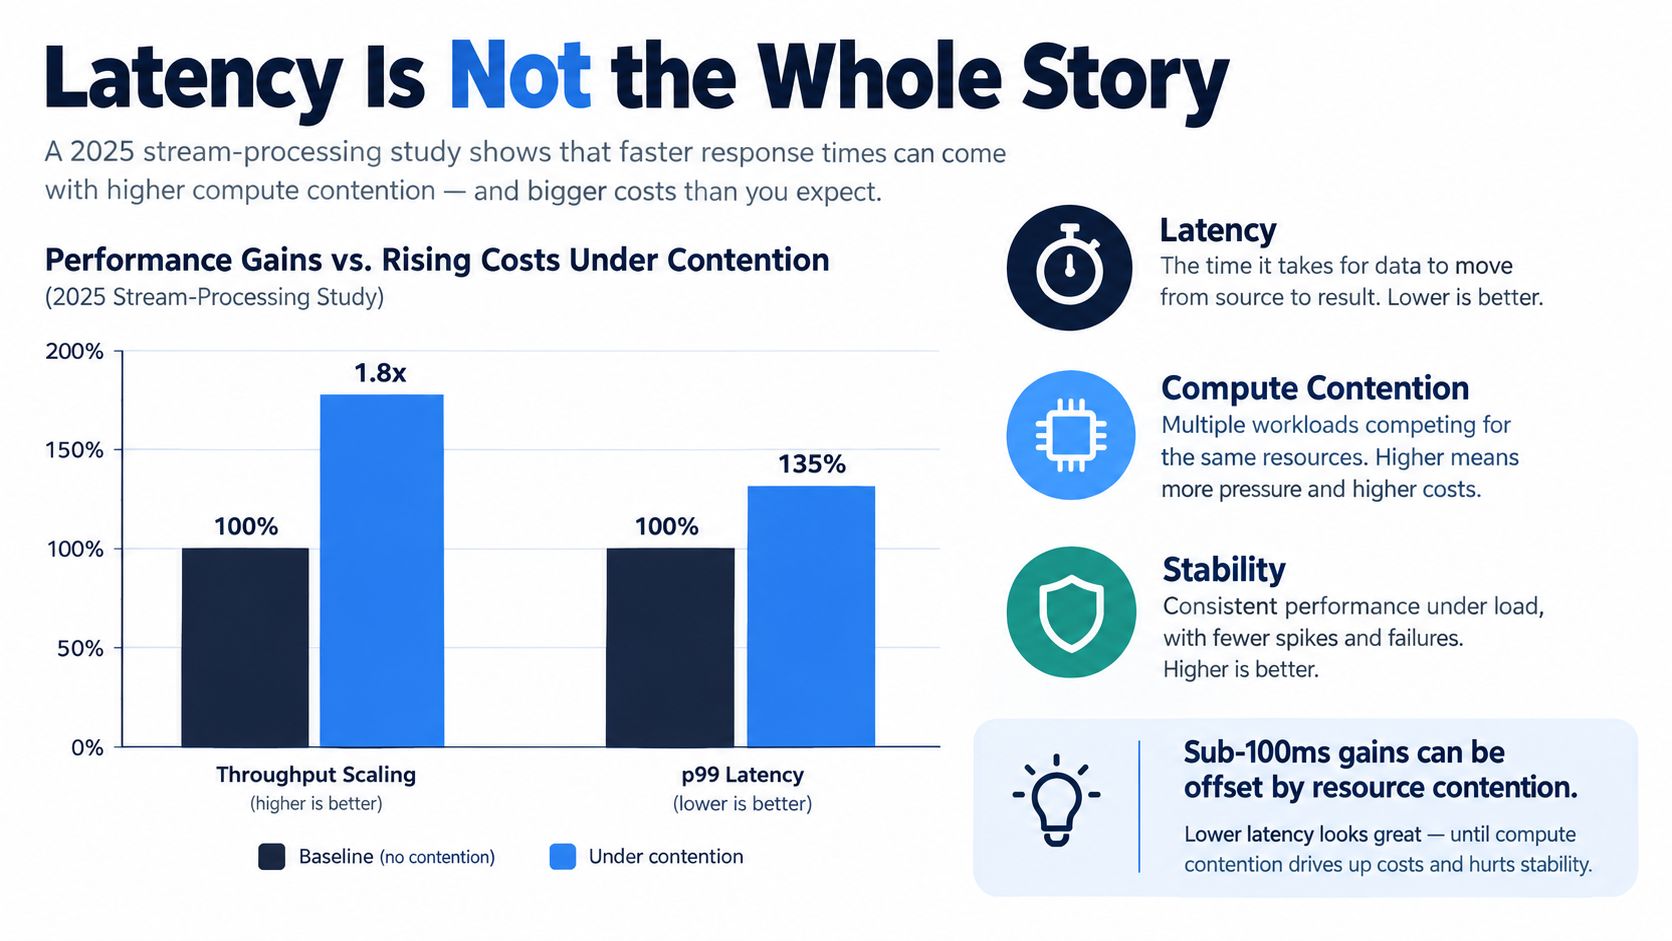
Latency measures how long an event takes to produce a result. It doesn't tell you whether the system can sustain the workload, whether the result is complete, or whether the pipeline remains stable during a traffic surge.
A 2025 stream-processing study illustrates the problem. Under stable conditions, increasing throughput from 0.6 to 72 operations per second reduced latency from 21 seconds to 6.2 seconds. When computational bottlenecks appeared, latency spiked to 349 seconds while throughput fell to 32 operations per second. Distributed processing improved the stressed case to 11 seconds of latency and 169.9 operations per second. The study is available through this stream-processing performance research.
Watch the system under pressure
The lesson isn't that higher throughput is bad. The lesson is that throughput without compute control can reduce freshness. A team that celebrates event rate while ignoring queue growth may discover that the “real-time” output arrives too late to matter.
Track these metrics together:
- p95 and p99 latency: Average latency hides the slow tail that users experience during spikes.
- Event rate: Measure incoming and successfully processed events, not just the source's advertised volume.
- Queue depth: A growing queue shows that work is arriving faster than the system can complete it.
- CPU and memory saturation: Resource contention often explains why latency rises after a scaling change.
- Dropped, retried, or late events: Freshness without completeness can produce misleading alerts.
The query response time guide can help teams distinguish application-facing response speed from the broader pipeline freshness problem. A query may return quickly against data that is already stale, while a fresh result may still be unusable if the query is unstable under load.
Capacity planning should answer two questions at once: Can the system process the event rate, and can it keep the result fresh when the workload changes?
Matching Freshness to Business Value
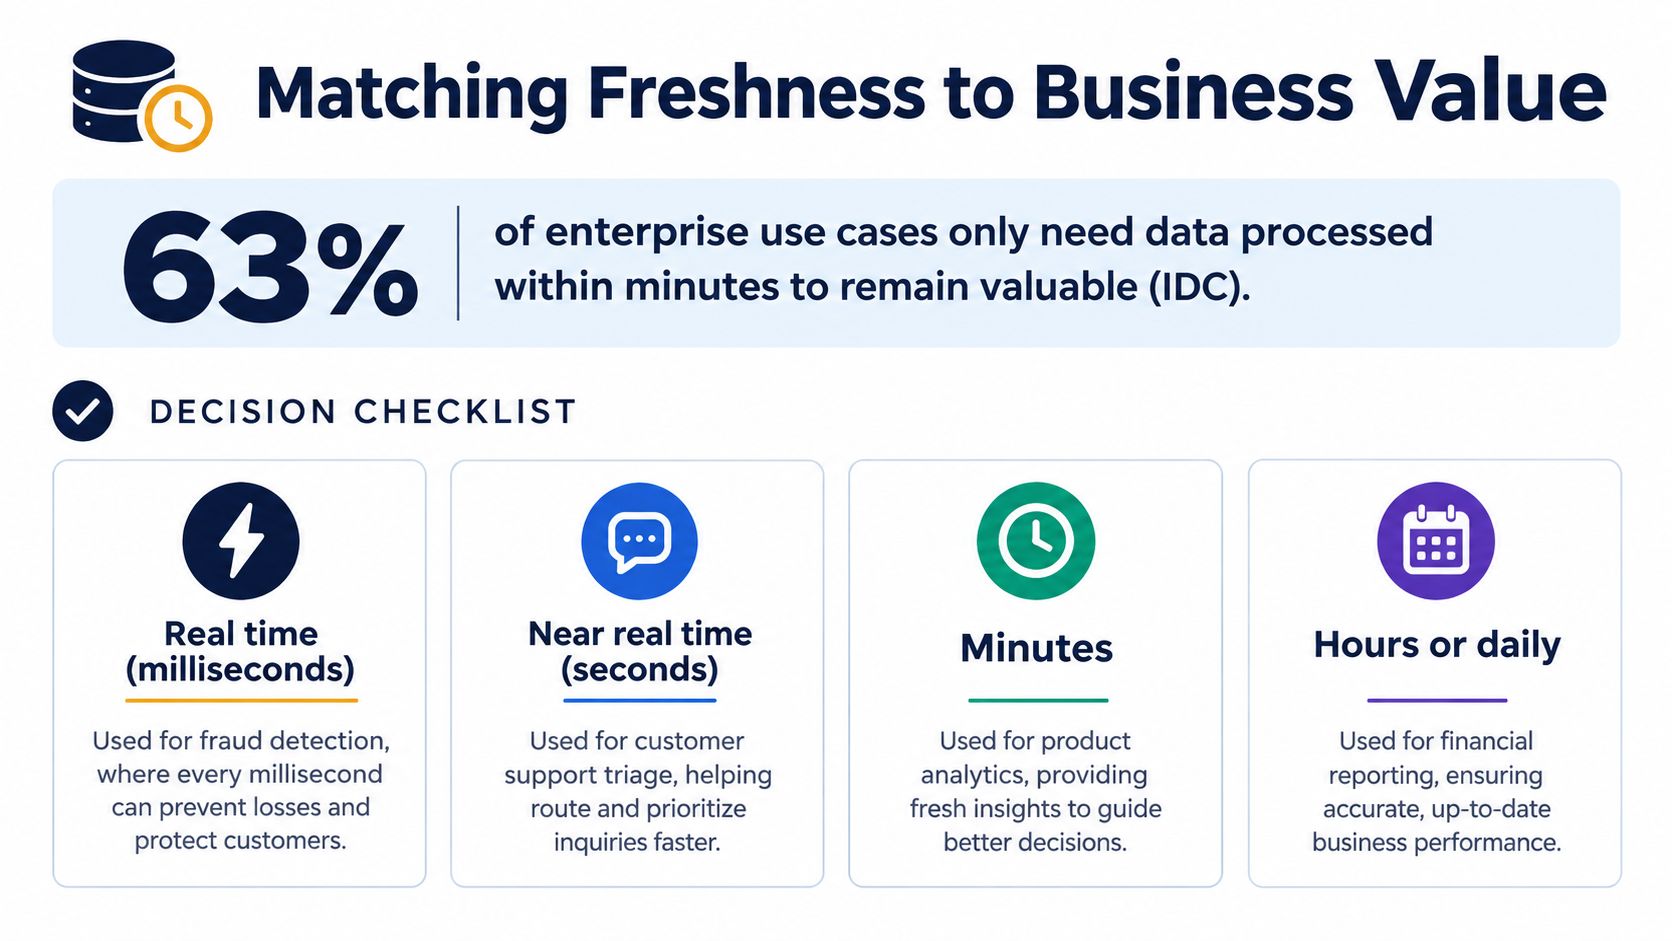
63% of enterprise use cases need data processed within minutes to remain useful, according to IDC data cited by IBM in its real-time data overview. That figure doesn't eliminate the need for fast systems. It does show why a single sub-second SLA for every signal is usually a poor starting point.
Begin with the action, not the source. List the decisions your team makes, identify the signal behind each decision, and record the latest acceptable arrival time. This creates a freshness map that reflects business value rather than technical fashion.
Separate event-critical signals from periodic decisions
Event-critical workflows lose value quickly. Outage response, fraud detection, and active-session personalization may require continuous processing because the system or person must act while the event is still relevant.
Operational workflows often fit near real time. A support leader may need a current view of rising complaints, but an update after a short interval can still support escalation. Product usage alerts can follow the same pattern if the objective is intervention during a customer relationship rather than an automated action inside a live session.
Periodic decisions usually need a slower cadence. Churn risk reviews, roadmap planning, and revenue analysis often benefit from more complete data, stable definitions, and time for validation. Daily or scheduled aggregation can be the right design when a late signal won't change today's action.
Ask four questions before upgrading a pipeline
- How much value depends on freshness? Connect the signal to a specific decision, not a general desire for speed.
- How stale is too stale? Define the point at which the signal no longer changes the outcome.
- What is the cost of a wrong decision? A fast but incomplete alert may create unnecessary outreach, engineering work, or customer confusion.
- What will continuous operation require? Include infrastructure, storage, monitoring, incident response, schema management, and ownership.
| Signal type | Sensible starting point | Decision supported |
|---|---|---|
| Support signals | Near real time | Escalate emerging product problems |
| Product usage | Near real time or scheduled | Identify adoption changes and intervention opportunities |
| Churn indicators | Frequent refresh or batch review | Prioritize account health work |
| Revenue events | Event-driven for critical actions, scheduled for reporting | Trigger immediate controls or reconcile financial views |
Integration research cited by IBM shows that 43% of surveyed organizations identify insufficient real-time or streaming capability as a challenge, while high implementation costs rank at 44% and limited automation or self-service ranks at 45%. These findings reinforce the tradeoff. Capability matters, but cost and usability can matter even more.
Set different SLAs by signal type, document the reason for each one, and revisit them when the decision changes. That approach gives engineering a defensible target and gives product teams a clear explanation of what freshness they are paying for.
Real Time Data in Product Intelligence and Support
A SaaS team can combine support tickets, chat transcripts, sales calls, and usage metrics to detect patterns while they are still actionable. The useful design isn't “stream everything at maximum speed.” It's to connect each incoming signal to an intervention, such as escalating a bug, contacting an at-risk account, or routing a high-value request to product.

Suppose a product manager starts the morning with a dashboard showing recurring complaints, affected accounts, usage changes, and related sales conversations. The dashboard doesn't merely count mentions. It connects the issue to customer context, highlights whether the pattern is spreading, and gives the team a reason to act.
A support signal may need frequent analysis because the team can still intervene during the customer relationship. A usage metric may refresh on a comparable cadence if it informs an account review. A revenue event may require immediate handling for a specific workflow, while the revenue report built from those events can remain scheduled for reconciliation.
Turn insight into an owned action
The value appears after detection:
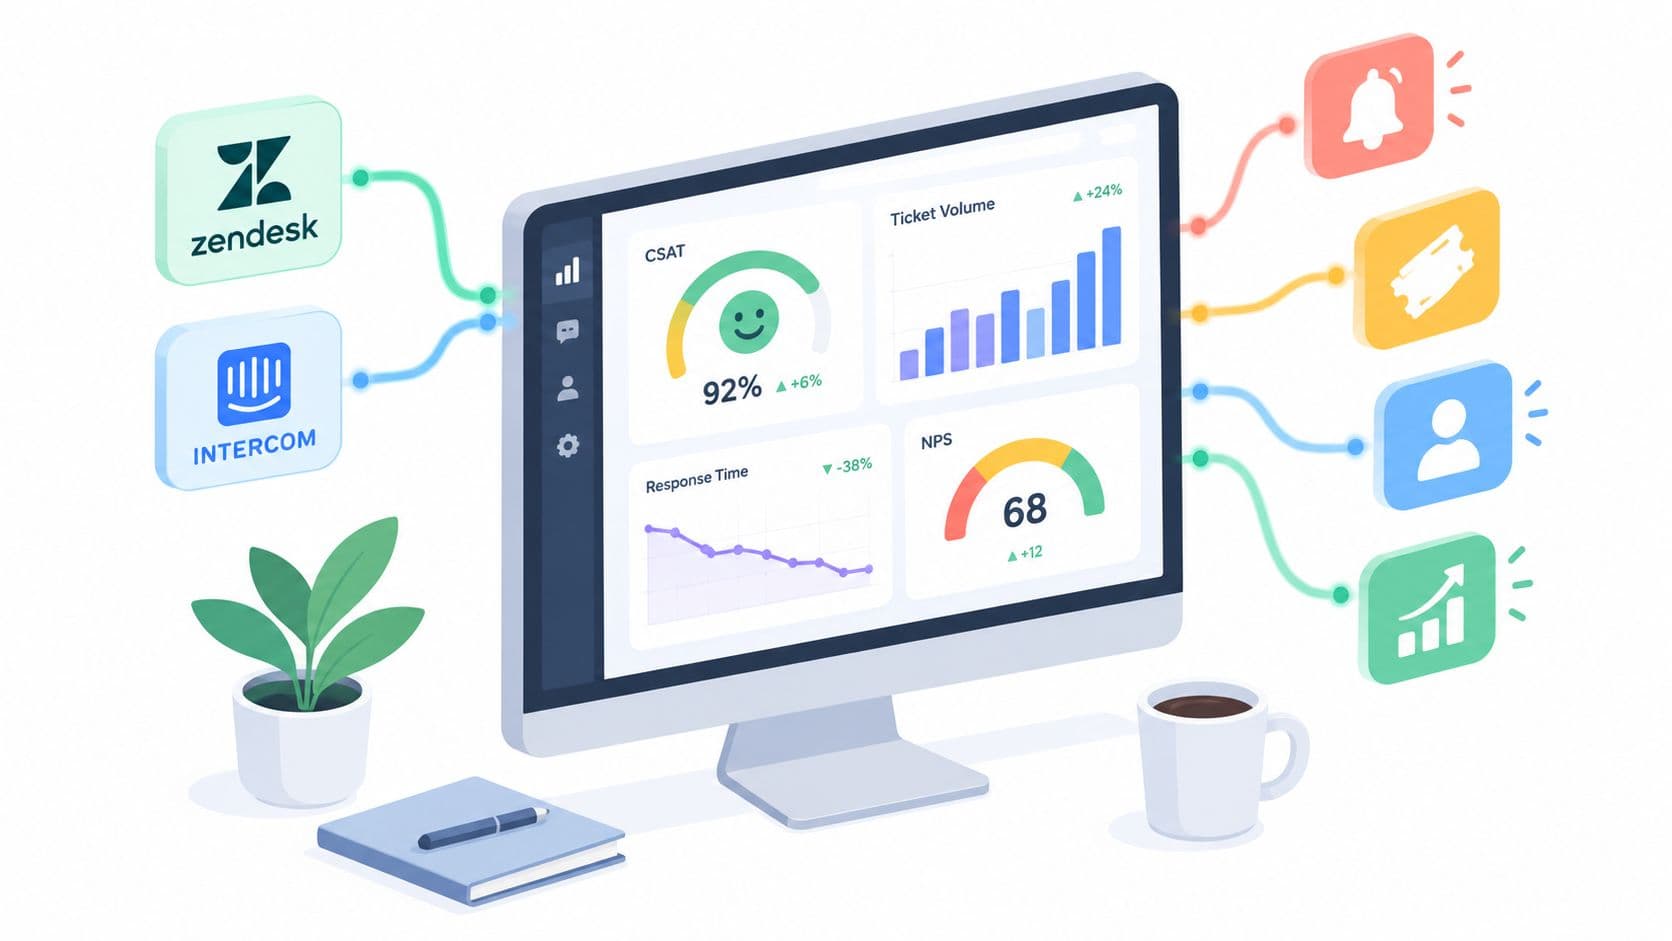
- Zendesk and Intercom can supply support conversations and customer context.
- Linear and Jira can receive issues after the team validates the pattern.
- GitHub can connect an engineering change to the customer problem it addresses.
- Account workflows can route a high-risk signal to customer success instead of sending an unreviewed automated message.
SigOS is one option for this kind of product intelligence workflow. It ingests support tickets, chat transcripts, sales calls, usage metrics, and real-time API streams, then analyzes patterns associated with churn risk, product issues, and expansion opportunities. Teams can connect the resulting insights to tools such as Zendesk, Intercom, Linear, Jira, and GitHub.
The important design choice is the freshness-to-action match. An alert that arrives while a team can still respond has operational value. An alert that arrives instantly but lacks account context, confidence, or ownership may create noise faster than people can resolve it.
For product managers, the best dashboard is not necessarily the one that changes most often. It's the one that surfaces a meaningful issue, explains why it matters, and makes the next action obvious.
Why Trust and Explainability Matter More Than Speed
Speed can't compensate for unreliable data. SAP reports that almost half of organizations identify poor data quality as their primary barrier to effective AI adoption, while more than one-third say data silos hinder real-time decision-making. Those problems affect alerts just as directly as they affect models.
An alert is useful only when a team can answer four questions: What changed? Which records produced the signal? What definition or rule was applied? Who owns the response if the alert is wrong?
Build evidence into every alert
A trustworthy real-time workflow should include:
- Confidence information: Show how strong the signal is and what evidence supports it.
- Correction workflows: Let owners amend classifications, mappings, or mistaken source records.
- Audit trails: Preserve the input, transformation, rule version, and downstream action.
- Late-event handling: Mark results that may change when delayed records arrive.
- Human review thresholds: Require review before an alert triggers customer outreach, roadmap changes, or revenue forecasts.
A Salesforce-reported survey found that 69% of data and analytics leaders use real-time monitoring as a governance practice. Monitoring can reveal failures, but it doesn't automatically create consistent definitions, lineage, or business context. Teams still need ownership and documentation around the signal.
The fastest alert in the system is not the most valuable alert. The valuable alert is fast enough, explainable enough, and reliable enough to support action.
Treat freshness as one part of quality, alongside completeness, consistency, lineage, and accountability. When teams design those controls together, real time data becomes a decision system rather than a speed demonstration.
SigOS helps SaaS teams continuously analyze support conversations, sales calls, usage metrics, and real-time signals to connect emerging patterns with churn, expansion, and product action. Visit SigOS to see how your team can match data freshness to the decisions that matter most.
Keep Reading
More insights from our blog

Ready to find your hidden revenue leaks?
Start analyzing your customer feedback and discover insights that drive revenue.
Start Free Trial →