Retention Value Formula: Maximize SaaS Growth in 2026
Master the retention value formula for SaaS. Calculate it from your data & convert retention metrics into actionable, revenue-driving decisions for 2026.

Every SaaS team eventually runs into the same argument.
A customer-facing team says a reliability issue is driving frustration and renewals are at risk. Product wants to know how much risk, exactly. Engineering says the fix will take real capacity away from a launch that sales has already started pitching. Nobody is wrong, but without a financial frame, the loudest opinion usually wins.
That's where the retention value formula stops being finance jargon and becomes a roadmap tool. When you can estimate the value of keeping a customer, you can compare a bug fix, an onboarding project, or a customer success investment against a shiny feature request on the same scoreboard. Gut instinct gets replaced by a more useful question: which choice protects or expands recurring revenue most durably?
The Hidden Cost of Your Product Roadmap
A roadmap usually looks rational from the inside. New feature work gets tied to pipeline. Platform work gets labeled as important but not urgent. Support-driven fixes sit in a queue because they don't look strategic enough.
Then churn shows up three months later.
I've seen teams debate a painful trade-off like this: ship a new workflow builder that could help close deals, or fix an account-level permissions issue that keeps creating support tickets for existing customers. The feature is easy to celebrate. The permissions fix is harder to sell in planning, even if it affects customers who already pay every month.
That's the hidden cost. Product teams often treat roadmap prioritization as if only new revenue is measurable. Existing revenue gets discussed in softer language like “customer sentiment,” “friction,” or “trust.” Those matter, but they're too vague to win hard prioritization calls on their own.
A better roadmap process forces both sides into the same model. If a bug fix protects more long-term value than a feature is likely to create, the fix should move up. If a customer success hire reduces avoidable churn in an important segment, that spend deserves the same scrutiny and support as a demand gen program.
For teams trying to build a more defensible planning process, a structured product roadmap development approach helps, but it gets much stronger when each roadmap item is tied to retained revenue, not just requested effort.
The expensive roadmap mistake isn't shipping the wrong feature once. It's repeatedly underpricing the value of keeping the customers you already won.
What Is Retention Value Really Measuring
Retention value measures the economic payoff of keeping a customer rather than losing them and trying to replace that revenue somewhere else. In practice, it answers a blunt question: what is this customer relationship worth if we preserve it?
A simple analogy helps. Think about a company's customer base the way you'd think about a car you plan to keep for years. A well-maintained car keeps delivering utility and holds more value over time. A neglected one becomes more expensive, less reliable, and easier to walk away from. Retention value is the business version of that maintenance logic. It turns “keep customers happy” into a number that can guide spending.
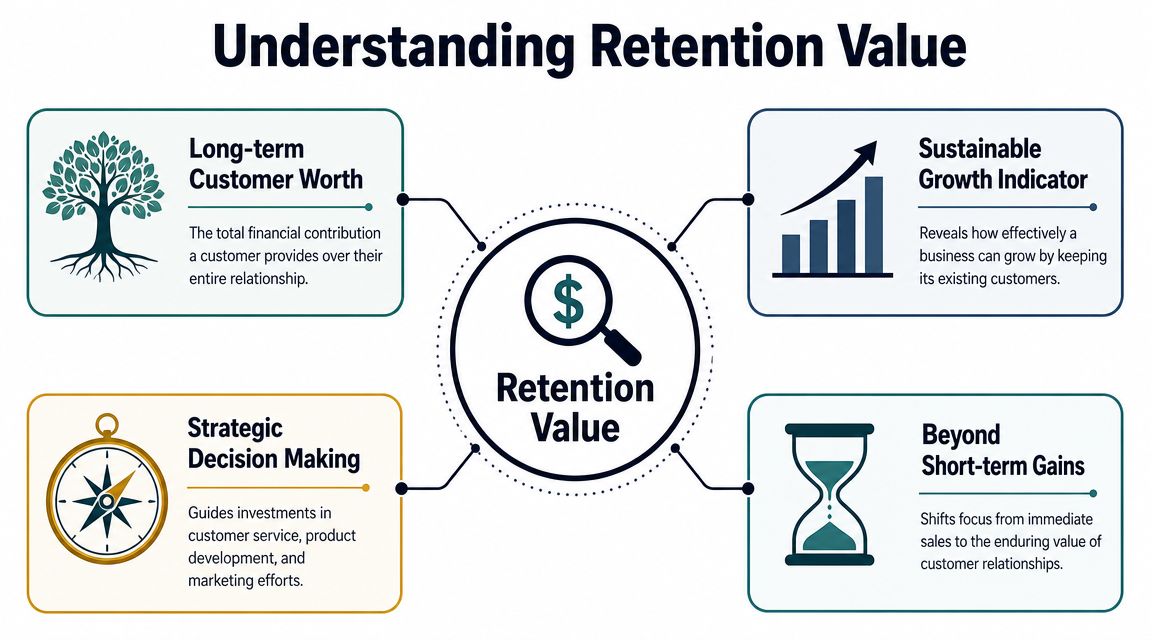
Why the idea matters financially
The reason retention value matters isn't new. The intellectual backbone came from the service-profit chain work of Heskett, Sasser, and Schlesinger. In a Harvard Business Review article, they argued that a 5% increase in customer retention could raise profits by 25% to 95% across industries, which turned retention into a financial lever instead of a vague relationship metric, as summarized in this discussion of the service-profit chain and retention value.
That framing changed how operators think. Retained customers often buy more over time, typically require less acquisition spend, and can create expansion or referral effects. In subscription businesses, those advantages stack month after month.
Retention value versus lifetime value
People often use retention value and customer lifetime value as if they're the same thing. They overlap, but they're not identical.
Customer lifetime value is the broad estimate of the revenue or profit a customer contributes over the relationship. Retention value is the more operational lens. It asks what that relationship is worth to preserve after accounting for the cost of the retention effort.
You can think about it this way:
| Metric | Main question | Typical use |
|---|---|---|
| Customer lifetime value | What is a customer worth over time? | Acquisition planning, segment economics |
| Retention value | What is it worth to keep this customer or cohort? | Product prioritization, support investment, renewal-risk decisions |
What teams usually miss
The formula matters less than the decision it informs.
If a customer asks for a feature, that request alone doesn't tell you whether to build it. If support reports repeated friction, that still doesn't tell you whether to pull engineers from a roadmap commitment. Retention value gives you a way to compare those decisions using the likely financial impact of keeping customers paying and expanding.
Practical rule: If a decision affects renewal odds, downgrade risk, or expansion potential, it belongs in a retention value model.
The Core Retention Value Formulas You Need
Most confusion starts when teams use one retention formula for every question. That's where bad decisions come from. The right formula depends on whether you're measuring customer counts, customer economics, or revenue behavior inside a cohort.
The main retention value formula
The most practical operating formula is:
Retention Value = (Average Revenue Per User × Customer Lifetime) − Retention Costs
This works because it converts retention from a sentiment problem into a unit-economics problem. Revenue per user tells you the value stream. Customer lifetime tells you how long that stream lasts. Retention costs tell you what you spend to preserve it.
The most important caveat is that the output is only as good as the inputs. If your ARPU mixes very different segments or your retention costs are buried across teams, the number can look precise while hiding the actual drivers.
For a stronger foundation on the lifetime side, it helps to align the model with your existing SaaS lifetime value calculations.
Don't confuse retention rate with retention value
A common mistake is using a single generic retention formula for everything. The correct calculation depends on what you're measuring. Customer retention rate uses customer counts [(ending − new) / beginning], while net dollar retention uses cohort revenue to capture expansion and contraction, as explained in this guide to retention rate methods.
That distinction matters more than is often realized.
If you keep most accounts but your largest customers downgrade, your logo retention can look healthy while your revenue story gets worse.
Which formula to use when
Use this decision rule:
- Logo retention fits when you care about how many customers stayed. This is useful for onboarding, support quality, and SMB businesses with relatively similar account values.
- Gross revenue retention fits when you want to isolate how much recurring revenue stayed before expansion muddies the picture.
- Net dollar retention fits when expansion, contraction, and churn all shape the business model. This is usually the right board-level metric in SaaS.
A short comparison makes it clearer:
| Metric | What it measures | Best use case |
|---|---|---|
| Logo retention | Customers retained by count | High-volume, lower-ACV SaaS |
| Gross revenue retention | Revenue retained without upsell | Pricing pressure, downgrade analysis |
| Net dollar retention | Revenue retained including expansion | Enterprise SaaS, account growth models |
If your company is tightening its reporting stack, a broader view of essential metrics for 2026 can help place retention value alongside NRR, churn, and expansion metrics instead of treating it as a standalone formula.
What actually works in practice
The formula that works is the one tied to the decision on the table.
If customer success wants more headcount to improve renewal coverage, cohort revenue is usually the right lens. If engineering is deciding whether to fix a widespread but low-severity bug in a self-serve product, logo retention may be more useful first. If finance wants to know whether service improvements create durable account growth, you'll eventually end up back at revenue retention.
That's why the retention value formula is less about memorizing one equation and more about choosing the right measurement layer.
Step-by-Step Worked Examples
Abstract formulas don't help much in a roadmap meeting. Worked examples do.
The first example is a single-customer decision. The second is a cohort decision. Both use the same logic product and customer success teams use when they need to justify action fast.
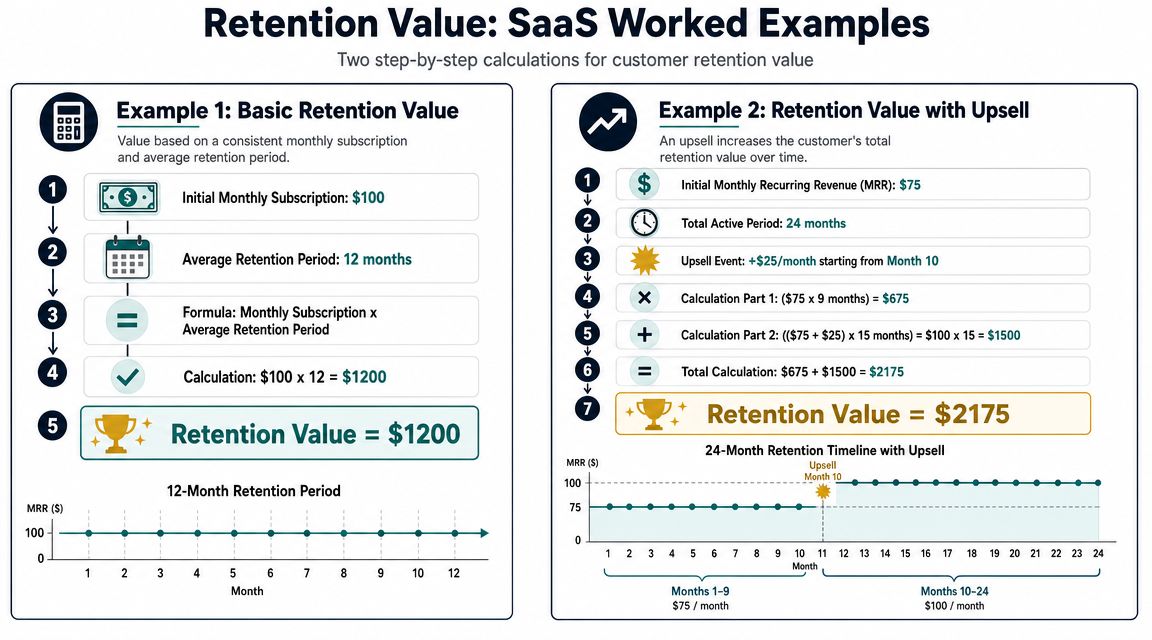
Example one with a single at-risk account
Start with a straightforward scenario. A customer pays $100 per month. Your current monthly churn assumption for similar customers is 5%, so expected customer lifetime is 1 / churn rate, or 20 months, based on this explanation of customer lifetime from churn.
That gives you:
**Unadjusted lifetime revenue = ****100 × 20 = about **2,000
Now suppose the team believes a specific product fix can materially reduce churn risk for accounts like this. If the same customer profile behaves more like a 2% monthly churn cohort after the fix, expected lifetime becomes 50 months.
That changes the math:
**Unadjusted lifetime revenue = ****100 × 50 = about **5,000
The useful insight isn't just that lifetime goes up. It's that a relatively small improvement in churn assumption changes the value of the account by a large amount before you even factor in expansion.
If you want to operationalize this analysis across support logs, renewal notes, and usage events, teams often script the first pass themselves. For analysts building that workflow, this guide to unlocking data potential with Python is a practical starting point for joining billing, product, and support data.
A video walkthrough can also help if you're explaining the logic to a cross-functional team:
Example two with a monthly cohort
Now zoom out.
Suppose you're looking at one cohort of customers who all started in the same month, and their average revenue per user is also 100 per month. If that cohort currently behaves like a 5% monthly churn group, the expected lifetime is again 20 months, so the cohort's unadjusted lifetime revenue per customer is about ****2,000.
If product and customer success propose an onboarding change that moves the cohort's future churn assumption to 2% monthly, expected lifetime rises to 50 months, and unadjusted lifetime revenue per customer rises to about $5,000.
How to use the worked math
The model is intentionally simple. That's a strength.
Use it to ask three practical questions:
- Which customer segment is affected: Enterprise accounts, SMB, trial-to-paid conversions, or customers on one plan?
- What changed the churn assumption: A bug fix, onboarding redesign, support intervention, pricing issue, or usage drop?
- What costs should be subtracted: Customer success time, engineering effort, tooling, or service credits tied to the retention motion?
The point isn't to pretend you know the future exactly. The point is to compare competing bets with the same economic logic.
Finding the Numbers in Your Existing Tools
Many teams don't have a retention value problem. They have a data plumbing problem.
The inputs already exist across billing, CRM, analytics, and support systems. The hard part is deciding which source is authoritative for each variable and making sure every team uses the same definitions.
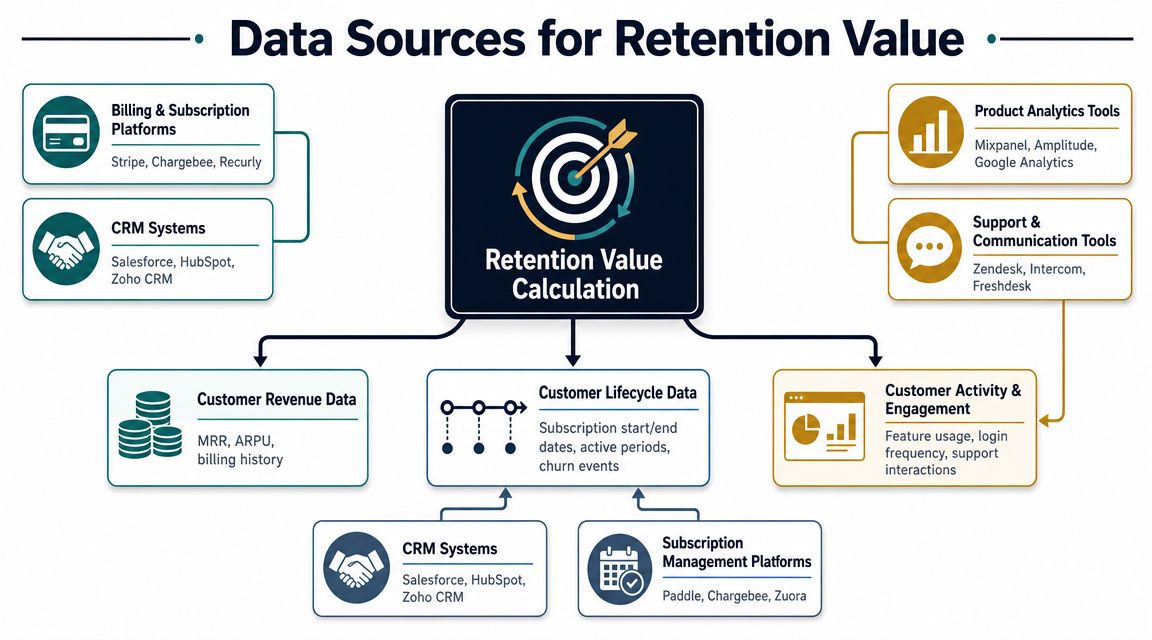
Where each input usually lives
Here's the cleanest mapping for a typical SaaS stack:
- ARPU and billing history usually come from Stripe, Chargebee, Recurly, Paddle, or Zuora. Finance may also keep the trusted MRR view in a warehouse model.
- Customer start dates, plan changes, and account ownership often live in Salesforce, HubSpot, or another CRM.
- Usage and engagement signals usually come from Mixpanel, Amplitude, or Google Analytics.
- Retention cost inputs are scattered. Customer success tools, support platforms like Zendesk and Intercom, finance systems, and internal payroll assumptions all contribute.
A practical source-of-truth model
If you're setting this up for the first time, don't start by building the full model. Start by assigning ownership.
| Input | Primary owner | Typical system |
|---|---|---|
| Revenue per account | Finance or RevOps | Billing platform, warehouse |
| Churn and active status | RevOps or CS Ops | CRM, subscription platform |
| Product engagement | Product analytics | Mixpanel, Amplitude |
| Support effort and issue frequency | Support ops | Zendesk, Intercom |
Teams that run this well agree on one business rule per field. For example, define exactly when a customer is counted as churned. Define whether paused subscriptions count as retained. Define whether ARPU is blended or segmented. Those choices matter more than fancy dashboards.
For operators trying to improve the reporting workflow itself, these AI tips for data operators are useful because they focus on cleaning, summarizing, and operationalizing messy business data rather than just visualizing it.
What usually breaks
Three things create most of the noise:
- Mismatched time periods. Monthly ARPU paired with annual retention assumptions produces distorted outputs.
- Mixed segments. Enterprise and self-serve customers in one model flatten the signal.
- Incomplete cost capture. Teams remember software costs and forget support time, engineering attention, and account management effort.
If the number feels unstable, that usually means the data model needs segmentation, not that the retention value formula is useless.
Using Retention Value to Drive Decisions
A retention value calculation is only worth doing if it changes what gets funded, fixed, or delayed.
The strongest teams use it in planning meetings because it gives supposedly “non-revenue” work a revenue frame. That matters when you're choosing between visible growth bets and less glamorous retention work.
Prioritizing a bug fix
A recurring bug rarely looks important when you count tickets alone. It becomes important when you attach the affected revenue.
If the issue clusters inside high-value accounts, product can estimate the retained value at risk, compare it against the engineering cost, and decide whether the fix belongs ahead of a roadmap item that only has speculative upside. Such circumstances sharpen product judgment. A feature request with excitement but no retention implication often loses to a reliability issue affecting renewal confidence.
Treat recurring defects as revenue exposures, not just quality issues.
Justifying customer success investment
Customer success headcount, onboarding programs, and support tooling often get held to a higher burden of proof than acquisition spend. That's backwards in subscription businesses.
When a team models how better coverage changes churned MRR and expansion behavior, they can judge whether the spend improves Net Revenue Retention, not just whether customers sound happier. That's the practical benchmark. As this overview of retention ratio and NRR logic notes, SaaS teams should connect retention spending to measurable revenue impact and verify that investments create durable expansion rather than just delaying contraction.
Defending refactoring and reliability work
Infrastructure and refactoring projects are notoriously hard to defend because the output isn't obvious to buyers. Finance hears “cleanup.” Product hears “velocity later.” Engineering hears “fewer incidents.”
Retention value lets you translate that work into economic language. If reliability problems correlate with churn risk, renewal delays, or contraction, then technical debt reduction isn't overhead. It's a retention lever. The key is to connect the work to a customer segment and a revenue outcome, not just a technical preference.
What works and what doesn't
What works:
- Tie each investment to a segment so the impact isn't diluted across the whole customer base.
- Use revenue metrics after the fact to see whether the intervention changed retention behavior.
- Re-rank roadmap items regularly because customer risk moves faster than quarterly planning cycles.
What doesn't:
- Arguing from anecdote alone because one angry customer call doesn't establish a pattern.
- Using blended averages for every decision because high-variance segments get hidden.
- Calling something retention work without measuring post-change revenue behavior because that turns the model back into opinion.
Automation and Common Pitfalls to Avoid
Manual retention analysis is useful, but it breaks down fast once the business gets more complex. Multiple segments, mixed contract types, seasonality, and inconsistent data definitions can make a clean spreadsheet look smarter than it really is.
One major mistake is chasing a universal benchmark. Context matters. Best-in-class net dollar retention might be 120%+ for enterprise SaaS but closer to 100% for high-volume SMB SaaS, which is why benchmark comparisons need business-model context, as noted in this discussion of retention benchmark variation.

Common mistakes that distort the number
The formula usually fails because of inputs and interpretation, not because the math is wrong.
- Ignoring segmentation. One blended retention number hides whether enterprise, mid-market, and SMB behave differently.
- Forgetting cohort effects. Newer customers and mature customers rarely retain the same way.
- Missing data quality issues. Bad account merges, duplicate IDs, and stale lifecycle fields can distort churn and revenue logic. Teams that struggle here usually need cleaner instrumentation and governance around data quality issues.
- Stopping at calculation. A retention value model without an action loop doesn't help anyone.
Where automation changes the game
Product intelligence tools offer significant utility. Instead of manually reviewing support tickets, churn notes, call transcripts, and usage events every month, teams can use systems that continuously detect patterns tied to churn risk and expansion potential.
One option is SigOS, which analyzes support conversations, sales calls, feedback, and usage data to surface issues associated with revenue risk and opportunity. In practice, that means the retention value formula becomes less of a periodic spreadsheet exercise and more of an operating system for prioritization. Teams can move from “what is our retention value?” to “which issue is destroying it right now?”
Automation doesn't replace judgment. It improves the quality and speed of the inputs so judgment can focus on trade-offs, not data scavenging.
The better operating model
The strongest setup is simple:
- Estimate retention value by segment.
- Tie product, support, and success work to the retained revenue at risk.
- Measure the effect using cohort revenue behavior after the intervention.
- Let automation surface new patterns before they become a quarterly churn surprise.
That's how the metric becomes useful. Not as a static finance artifact, but as a daily prioritization tool.
If you want to move beyond manual spreadsheets and connect customer feedback, product usage, and revenue impact in one place, SigOS is built for that workflow. It helps teams identify the issues most likely to affect churn and expansion, then brings those signals into roadmap and support decisions so retention value becomes actionable rather than theoretical.
Keep Reading
More insights from our blog


Ready to find your hidden revenue leaks?
Start analyzing your customer feedback and discover insights that drive revenue.
Start Free Trial →