Master Your Product Roadmap with a Return of Investment Template
Use our expert-designed return of investment template to quantify impact, justify priorities, and build a data-driven SaaS product roadmap that gets results.

A good return of investment template is essentially a spreadsheet or tool that pits the estimated costs of a project against its expected financial benefits. For those of us in product, it’s the best way to back up our roadmap decisions with cold, hard data instead of just our gut feelings. It helps ensure we're pouring resources into the initiatives that actually move the needle for the business.
Why an ROI Template Is Your Most Powerful Product Tool
Ever feel like you're constantly defending your roadmap from an onslaught of requests from sales, marketing, and support? It’s a tale as old as product management. Every team thinks their priorities are the most critical, and you're stuck in the middle of a tug-of-war for precious engineering time. This is exactly where a solid Return on Investment (ROI) template becomes your secret weapon.
A well-designed return of investment template fundamentally changes the conversation. It shifts subjective debates into objective, data-driven discussions. Instead of going with the loudest voice in the room or a senior leader's pet project, you can walk into a meeting with a clear, numbers-backed business case for every single thing on your list. It forces everyone to think critically about both the investment and the potential payoff.
From Vague Ideas to Concrete Business Cases
The real magic of an ROI framework is how it quantifies the impact of your team's work. It’s the bridge between a user complaining about something and a CFO seeing the financial upside of fixing it. All those abstract product goals suddenly become tangible, measurable outcomes.
Think about these everyday situations:
- Bug Fixes: That bug isn't just "annoying." Now, you can show that it's costing the company $5,000 a month in support tickets or contributing to a 2% increase in churn for a specific customer segment.
- Feature Requests: An enterprise client is pushing hard for a new feature. With an ROI analysis, you can compare the value of that one-off request against a smaller feature that could drive a 10% upsell rate across your entire SMB customer base.
- Technical Debt: Refactoring work is no longer just "internal cleanup." You can frame it as an investment that will boost developer velocity by 15%, saving tens of thousands in future development costs.
When you start putting a dollar value on product initiatives, you’re not just building a roadmap—you're building a financial plan for the product. This subtle shift is what gets you executive buy-in and proves your team's direct impact on the bottom line.
Aligning the Entire Organization
It's amazing how much easier alignment becomes when every decision is backed by a clear ROI calculation.
The sales team might be frustrated that their big feature request isn't at the top of the list. But when they can see that a "minor" bug fix is projected to save $100,000 in churned revenue—more than their feature is expected to generate in its first year—they get it. The marketing team understands why engineering is dedicated to a new onboarding flow when they see the data projecting a 5% lift in trial-to-paid conversion rates.
This approach creates a culture of shared ownership and accountability. The conversation moves away from "I want this" to "What's best for the business?" In the end, a great return of investment template doesn't just help you build a better product. It helps you build a smarter, more aligned organization, giving you the evidence you need to secure resources and build a roadmap that truly drives growth.
Building Your SaaS ROI Template From Scratch
Let's move past the theory and get our hands dirty. Building a solid return of investment template isn't about creating some ridiculously complex financial model. It’s about crafting a practical tool that translates your team's hard work into the language of business impact: dollars and cents.
A good template becomes your single source of truth for prioritization. It’s what turns those passionate "we should build this!" debates into clear, data-driven decisions.
It all starts with the classic ROI formula. Simple, but incredibly powerful.
ROI % = (Net Profit / Cost of Investment) x 100
This forces you to answer two fundamental questions: "What do we stand to gain?" and "What will this actually cost us?" Nailing the answers is the entire game. For SaaS teams, 'Net Profit' is rarely a single number—it’s a mix of new revenue, saved customers, and maybe even internal efficiencies. Likewise, the 'Cost' isn't just developer salaries; it's the total time investment from product, design, QA, and anyone else involved.
This simple flow is how a great template should work: it channels the chaos of team debates into clear data, which then fuels confident decisions.
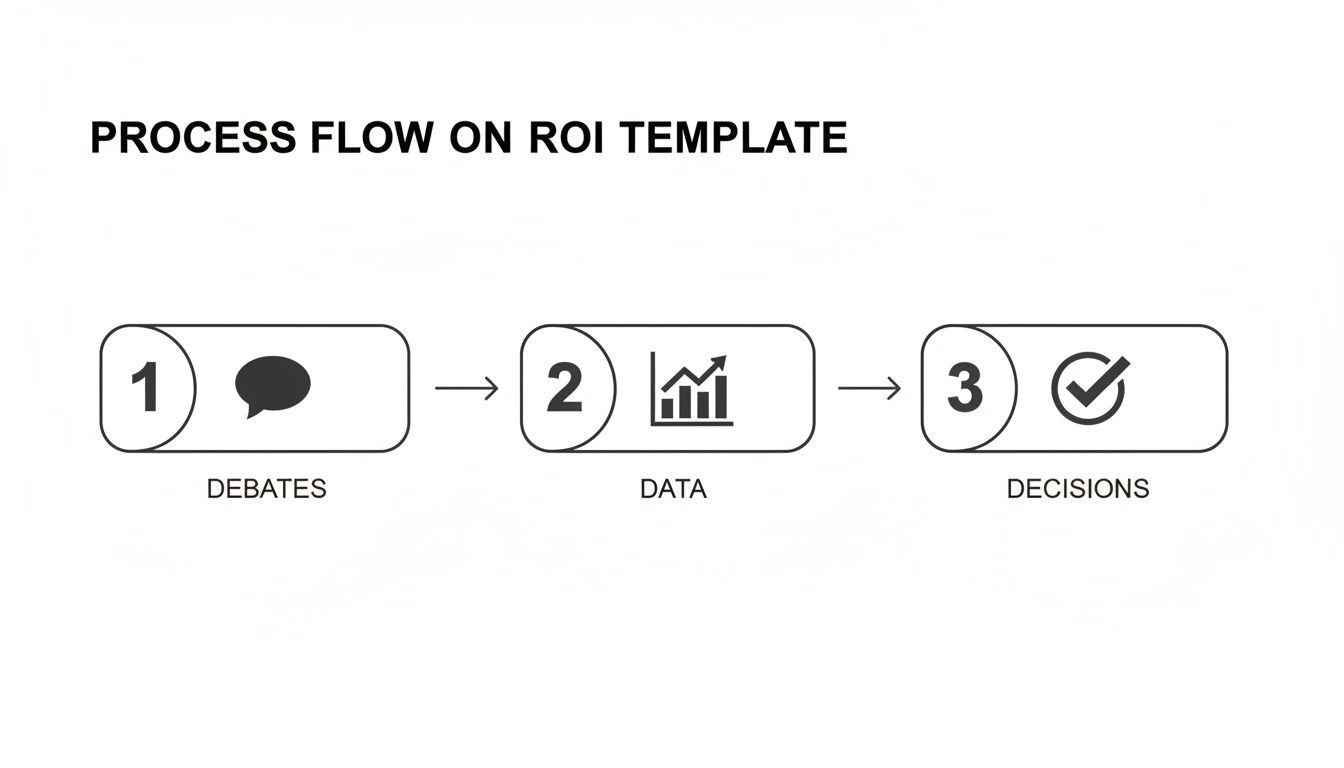
The template isn't just a calculator; it’s a structured process for getting from subjective opinions to objective, data-backed choices.
The Key Metrics for Your SaaS ROI Template
To bring the ROI formula to life for a software product, you have to plug in the right metrics. These are the building blocks that add credibility to both the "Return" and "Investment" sides of your calculation. You don't need a hundred of them, just the vital few that truly matter.
This table breaks down the essentials you'll need to build into your spreadsheet.
| Metric | Formula | Strategic Importance |
|---|---|---|
| Customer Lifetime Value (CLV) | (Average Revenue Per Account x Gross Margin %) / Churn Rate | Tells you the total value of a customer, making it clear why preventing churn is so profitable. |
| Churn Rate | (Customers Lost in Period / Customers at Start of Period) x 100 | This is a direct leak in your revenue bucket. Projects that lower this number have a direct, easy-to-calculate return. |
| Average Revenue Per User (ARPU) | Total MRR / Total Active Users | Crucial for measuring the impact of upsells or expansion features that move users into higher-paying tiers. |
| Development Costs | Fully-Loaded Team Cost Per Week x Project Duration in Weeks | This is the "Investment" part. It’s more than just salary—it’s the total cost to have your team work on something. |
Once you’ve got these inputs dialed in, your ROI calculations become far more nuanced and believable. If you want to go deeper on tracking the right numbers, our guide on a key performance indicator report template is a great place to start.
Structuring Your Spreadsheet for Maximum Impact
Your goal here isn't to build a rigid calculator. You need a flexible model that lets you compare different initiatives side-by-side, each with its own set of assumptions.
Here’s a proven way to structure your template:
- Initiative Inputs: Start with a section to name the project (e.g., "Fix Critical Login Bug," "Build New Salesforce Integration") and clearly state your core assumptions. What are we betting on?
- Cost Calculation: Dedicate a few rows to the investment. I like to break this down by role and time (e.g., 2 Engineers x 3 weeks, 1 Designer x 1 week) to get a realistic total cost.
- Return Scenarios: This is where the magic happens. Build out separate mini-models for different kinds of returns—one for churn reduction, another for new feature adoption, one for expansion revenue, and so on. This lets you apply the right logic to each project.
- The Bottom Line: End with a clean summary table. Show the total cost, total return, net profit, and the final ROI percentage for each initiative. This makes comparison dead simple.
If you’re building this from scratch, this walkthrough on crafting a return on investment calculator in Excel offers some great structural ideas. Trust me, having a well-organized spreadsheet makes all the difference when you’re trying to get buy-in. It shows you’ve done your homework and gives stakeholders a clear, logical path from your idea to its financial impact.
Calculating the Value of Churn Prevention
We all know customer churn is a business killer. But talking about its impact often feels vague. It’s one thing to say, "We need to improve retention," and another thing entirely to put a hard dollar amount on the initiatives that actually stop customers from leaving.
This is where a solid return of investment template becomes your best friend. It helps you turn churn prevention from a fuzzy concept into a concrete, revenue-generating strategy. By quantifying what you stand to lose, you can build a powerful case for investing in the fixes, features, and support improvements that keep customers paying you month after month.

A Practical Scenario: Putting the Template to Work
Let's get practical with a situation I’ve seen play out dozens of times. Your company has a nagging bug in its reporting module. It’s not crashing the system, but it's a constant headache for a key customer segment: your mid-market accounts.
Your support team keeps flagging that this bug is mentioned in 30% of cancellation surveys from this group. After a bit of digging, you confirm your suspicion: this single issue is directly responsible for 5% of your mid-market customers churning every year.
Here’s how you’d break that down in your ROI template.
Tallying Up the Lost Revenue
First things first, you need to figure out how much this bug is costing you. Let’s lay out the numbers:
- Total Mid-Market Accounts: 500
- Annual Churn Rate from this Bug: 5%
- Accounts Lost Per Year: 500 accounts * 0.05 = 25 accounts
- Average Annual Contract Value (ACV) for this Segment: $12,000
With that, you can calculate the direct revenue hit: 25 accounts * 12,000 ACV = 300,000 in lost annual recurring revenue (ARR). That’s your potential "Return"—the money you save by solving the problem.
Calculating the Investment (The "Cost")
Next up, what will it take to fix it? You sit down with the engineering lead to scope out the effort.
- Resources Needed: 2 Senior Engineers
- Estimated Time: 3 weeks (120 hours total per engineer)
- Fully-Loaded Hourly Cost Per Engineer: $125
- Total Investment Cost: 240 hours * 125/hour = 30,000
This isn't just an expense; it's a strategic investment to protect a huge chunk of predictable revenue.
You're no longer asking for a budget to "fix a bug." You're presenting a clear-cut opportunity to invest 30,000 to save ****300,000. The ROI speaks for itself.
Calculating the Final ROI
Now that you have both sides of the equation, the final calculation is easy.
Using the standard formula: ROI = (Net Profit / Investment Cost) x 100
- Net Profit (Return): 300,000 (retained revenue) - 30,000 (cost) = $270,000
- Investment Cost: $30,000
Plugging that in, the ROI for fixing this bug is: (****270,000 / ****30,000) x 100 = 900%.
A 900% ROI is an incredibly powerful number to bring to any roadmap or prioritization meeting. You’ve just turned an annoying support ticket into what could be the most profitable project your team tackles all quarter. Getting a handle on your numbers is crucial, and a deep dive into SaaS churn analysis can provide even more context for these calculations.
Focusing on retention like this is one of the most cost-effective growth strategies out there. We’ve seen this work wonders. For instance, after Canto, a digital asset management provider, centralized their customer feedback, their product team saw a 75% increase in focus time per week. This directly led to better delivery quality and improved customer retention.
By using a return of investment template, you draw a straight line from customer feedback to development work to real financial outcomes. If you want to go deeper, check out our guide on effective strategies for reducing churn rate. It’s a vital skill for any product manager who wants to justify their roadmap with hard data.
Estimating the ROI of New Features and Expansion
Every product team I've ever worked with faces the same tough choices. Do you chase the single, massive enterprise deal that hinges on one custom feature? Or do you build something that could drive incremental upsells across hundreds of smaller accounts?
This is where your return on investment template really starts to shine. It stops being a defensive tool for fixing problems and becomes your secret weapon for modeling and comparing growth opportunities. It's how you can finally compare apples and oranges on a level playing field, making sure your big bets are grounded in data, not just wishful thinking.
Scenario One: The Enterprise Whale
Let's walk through a classic dilemma. Your sales team is on the one-yard line with a prospect, ready to close a $150,000 annual contract. The catch? The deal is contingent on building a custom integration that isn't even on your roadmap.
This is a high-stakes, high-reward situation that can cause a lot of internal debate. Using your ROI template, you can cut through the noise and assess the trade-offs objectively.
- Investment (The Cost): First, you huddle with engineering. They estimate it'll take three developers four weeks to build the integration. After factoring in salaries, benefits, and overhead, the fully-loaded cost comes out to $60,000.
- Return (The Gain): The immediate gain is obvious: the 150,000 contract. But an experienced product manager knows the analysis can't stop there. Could this integration be productized and sold to other enterprise clients? Does it unlock a new market segment? Let's be conservative and say it helps you land two more deals of a similar size over the next 18 months. That's another ****300,000 in potential value.
Now, your total estimated return is $450,000.
ROI Calculation: ((450,000 - 60,000) / $60,000) x 100 = 650% ROI
Suddenly, that's a much more compelling number. The template forces you to think beyond the initial deal and see the bigger strategic picture.
Scenario Two: The Expansion Play
Now for a completely different kind of opportunity. Your customer success team keeps hearing the same thing from your mid-market customers: they want an advanced analytics module and are willing to pay for it. This would be a brand new add-on, creating a fresh upsell path.
This isn't about landing one big fish; it's about scaling revenue across your existing customer base.
- Investment (The Cost): This is a heavier lift. It's a cross-functional effort that will likely take a full team two months to design, build, and launch. The total estimated cost lands at $100,000.
- Return (The Gain): You have 1,000 mid-market customers. Based on surveys and direct conversations, you feel confident you can get a 20% adoption rate within the first year. The add-on is priced at 50 per month, which works out to 600 annually.
Here’s how the math breaks down:
- Upsold Accounts: 1,000 accounts * 20% adoption = 200 accounts
- New Annual Recurring Revenue (ARR): 200 accounts * 600/year = 120,000
ROI Calculation: ((120,000 - 100,000) / $100,000) x 100 = 20% ROI
A 20% ROI in the first year is respectable, but it looks tiny next to the 650% ROI from the enterprise feature. But hold on—this is recurring revenue that will likely compound as adoption grows year over year.
Comparing Apples and Oranges
With both scenarios modeled out, you can finally have a truly strategic conversation with your leadership team. The enterprise feature offers a huge, immediate cash injection. The expansion feature, on the other hand, builds a sustainable, long-term revenue stream.
So, which one is the "right" choice? It completely depends on your company's strategic goals right now. Are you chasing aggressive short-term growth targets, or are you focused on building a more predictable revenue engine for the long haul?
This kind of data-driven thinking is critical. For instance, broad B2B marketing channels might show a 5:1 ROI, but that number can change dramatically depending on the specific tactic. Data from GenesysGrowth.com shows that SEO-focused content delivers a staggering 748% ROI for B2B companies, proving just how much returns can vary.
In the end, the template doesn't make the decision for you. What it does is illuminate the trade-offs and quantify the potential outcomes. It empowers you to make a strategic bet backed by data, not just a gut feeling.
How to Present Your ROI Analysis and Get Buy-In
Running the numbers in your return of investment template is a fantastic start, but it’s only half the job. If those carefully calculated figures don’t actually convince anyone to take action, they’re just numbers sitting in a spreadsheet. The real magic happens when you turn that analysis into a compelling story that gets people excited and ready to sign off.

The trick is to know your audience. You have to shape your message to fit who's in the room. What gets a CFO nodding along is worlds away from what an engineering manager needs to hear to get on board.
Tailor Your Narrative for Maximum Impact
Think about it: you wouldn't use the same sales pitch on every customer. The same rule applies here. Each stakeholder group has its own set of priorities, concerns, and even its own language. To be persuasive, you need to speak directly to what they care about most.
Here’s a quick guide to framing your pitch:
- For the C-Suite (CEO, CFO, COO): Go straight to the bottom line. These leaders are focused on financial impact, strategic alignment, and staying ahead of the competition. Lead with metrics like projected ARR gain, churn reduction in dollars, and the total ROI percentage. Keep your pitch high-level, and make a clear, direct connection between your initiative and the company's biggest goals.
- For Sales and Marketing Leads: Talk in terms of market opportunities and competitive wins. Show them how this new feature will help close bigger deals, open up new market segments, or give them an edge over a key competitor. Use specific data points they'll understand, like "This could unlock a $250,000 pipeline" or "It finally closes the #1 feature gap we hear about from lost prospects."
- For Engineering and Development Leads: Your conversation here needs to be about resources, effort, and technical strategy. Be prepared to discuss the estimated effort in story points or weeks, how this project might reduce technical debt, and what the trade-offs are. They need to understand the how and the cost in terms of their team's time and capacity.
Build a Compelling Business Case
Your presentation can't just be a data dump. It needs to tell a persuasive story that anticipates questions and heads off objections before they're even voiced. A solid business case, built right from your template, is the most powerful tool you have for getting your product roadmap development initiatives approved and funded.
Visualizing your data is critical. Don't just flash the final ROI number on a slide. Show your work. A simple bar chart comparing the projected revenue gain against the investment cost can make the decision feel like a no-brainer. Even better, show two or three competing projects side-by-side with their respective ROI to make the best path forward obvious.
Your goal isn't just to share numbers—it's to build conviction. Walk them through your assumptions with confidence, explain how you landed on your cost and return estimates, and be ready to defend your prioritization with solid data.
This shift toward data-driven decisions is happening everywhere. Just look at the enterprise feedback management market—a space built on connecting customer needs to financial results. It was valued at USD 3.2 billion in 2025 and is expected to rocket to USD 16.7 billion by 2035. That explosive 17.7% CAGR proves how vital this connection is. You can learn more about this trend in the full enterprise feedback management market report.
The final piece of the puzzle is anticipating the tough questions. People will be skeptical of revenue projections or challenge your cost estimates—and they should be. By preparing thoughtful answers backed by the logic in your return of investment template, you prove you’ve done your homework. That builds trust and makes it much, much easier to get the buy-in you need.
Got Questions About Using an ROI Template?
Once you start weaving an ROI template into your team's workflow, questions are bound to surface. That’s a great sign. It means people are actually using it and thinking critically about how to connect their work to business value. Let's walk through some of the most common questions and sticking points I've seen product and growth teams run into.
How Do I Figure Out the "Cost" of Building a Software Feature?
This is a big one. The "cost" in your ROI calculation needs to be more than just developer salaries. To get a real picture of the investment, you need a "fully-loaded" cost—that is, every expense tied to getting the project out the door.
Think of it this way: what is the total cost to the business for this team to work on this project instead of anything else? To get that number, you'll need to account for:
- Direct Team Time: This is the obvious part—the hours your developers, PMs, designers, and QA engineers pour into the work. Don't forget to include time from other folks, like DevOps or security, if they're involved.
- Overhead Costs: You've got to account for benefits, office space, software, and other administrative expenses. A common shortcut is to apply a multiplier (like 1.3x or 1.5x) to the team's base salary cost.
- New Tools or Infrastructure: Does this project require a new software license? Will it spin up your cloud hosting costs? Those are direct costs and absolutely need to be included.
A practical approach is to figure out a blended hourly rate for your team or pod. For instance, if a project needs two engineers for four weeks (320 hours) and one PM for two weeks (80 hours), your baseline is 400 total hours of work. From there, I always recommend adding a contingency buffer of about 20%. Scope creep, unexpected bugs, and delays are part of the game; it's better to plan for them.
What if My Data for the ROI Calculation is a Bit… Fuzzy?
Welcome to the club. This is probably the number one concern people have, and it’s completely valid. The point of an ROI template isn't to achieve mathematical perfection. It's about building a consistent, defensible way to make decisions.
Frankly, it's far better to be directionally correct than precisely wrong.
When you don't have perfect, clean data, the secret is to use informed estimates and—this is the most important part—document every single one of your assumptions. Stakeholders are much more likely to trust your numbers when they can see the logic you used to get there.
An ROI analysis with clearly stated assumptions is a powerful decision-making tool. An ROI analysis with hidden or unclear assumptions is just a guess dressed up in a spreadsheet. Transparency is what builds trust.
Let's say you're trying to estimate the potential new revenue from a feature. You don't have to pull a number out of thin air. You can ground your estimate by looking at:
- Sales Conversations: What deal sizes are being discussed with prospects who are asking for this?
- Market Research: What are competitors charging for similar functionality?
- Existing User Data: How did a similar feature you launched last year perform? What was its adoption rate?
By basing your estimates on the best data you have (even if it’s not perfect), you shift the conversation from "I feel like we should do this" to "Here's what the evidence suggests." And as you launch and gather real-world data, you can go back and make your model even more accurate for next time.
Can I Use This for Something Like Technical Debt?
Absolutely. In fact, this is one of the most powerful ways to use an ROI framework. While fixing tech debt doesn't usually bring in new revenue, the "return" is massive when you frame it in terms of cost savings and risk avoidance. This is how you get it prioritized against shiny new features.
The "investment" part is easy: it's the developer time needed for the refactor or system upgrade.
The "return" is where you get creative. You can calculate it in a few ways:
- Increased Developer Velocity: How much faster can your team ship new features after the tech debt is resolved? You can translate that saved time directly into a dollar value for all future projects.
- Reduced Bug-Fixing Time: Tally up the hours your engineers spent fixing bugs in that rickety part of the codebase over the last six or twelve months. The return is the value of getting all that time back.
- Risk Mitigation: This one is huge. What's the potential cost of a major outage, data breach, or performance issue caused by that fragile code? The ROI here is the value of preventing a catastrophe that could cost you customers and revenue.
When you model these scenarios in your template, you show that paying down technical debt isn't just "housekeeping." It’s a strategic, high-return investment in your product's stability and your team's future speed.
Ready to stop debating and start quantifying? SigOS is the AI-driven platform that automatically analyzes your customer feedback—from support tickets to sales calls—and attaches a dollar value to every bug fix and feature request. See how our platform can populate your return of investment template with real, revenue-backed data. Learn more about SigOS.
Keep Reading
More insights from our blog


Ready to find your hidden revenue leaks?
Start analyzing your customer feedback and discover insights that drive revenue.
Start Free Trial →