Support Ticket Analysis: Uncover Revenue Opportunities
Unlock revenue opportunities with support ticket analysis. Explore AI techniques, key metrics, and workflows to turn customer feedback into profit.

Most support leaders are stuck in the same loop. The queue spikes after a release. Agents work harder. Product asks for “top issues.” Success asks which accounts are at risk. Finance asks whether any of this affects retention. Everyone gets a different spreadsheet, and nobody gets a confident answer.
That's the trap. Teams treat support as an execution function, so they measure speed, backlog, and satisfaction, then wonder why the same problems keep coming back. The queue looks operational, but the underlying signal is strategic. Buried in those tickets are the defects driving churn, the friction blocking expansion, and the feature gaps that sales keeps hearing in late-stage deals.
Good support ticket analysis changes the role of support data. It stops being a pile of complaints to triage and becomes a decision system for product, growth, and revenue teams. When that shift happens, a bug report is no longer just a bug report. It's evidence. A repeated complaint from a key segment is a roadmap input. A cluster of confused onboarding tickets is an adoption problem. A sudden sentiment drop in a high-value account is a renewal risk.
Your Goldmine of Hidden Revenue
A familiar scene plays out inside growing SaaS companies. The support lead is pushing for faster replies. The product manager is trying to separate one-off requests from real product issues. The head of customer success wants to know which unhappy accounts need intervention first. Meanwhile, engineering sees support as a stream of anecdotes, not a ranked list of business risks.
That disconnect gets expensive fast.
Most companies still can't connect ticket themes to revenue with much confidence. A 2025 SaaS Metrics Institute report found that only 12% of product teams can accurately map ticket topics to revenue impact, while 87% of CTOs demand that data for prioritization. That gap explains why so many roadmap decisions still come down to whoever tells the most convincing story in a planning meeting.
Why support queues mislead teams
A raw queue hides the true business picture. Ten tickets about password resets may be noisy but low-risk. Three tickets from a core customer segment about data exports failing may be far more important. If both sit in the same inbox, teams often overreact to volume and underreact to value.
That's why reactive support organizations stay reactive. They optimize for closure, not learning.
Practical rule: If your support reporting ends at ticket counts and response times, you're measuring workload, not customer risk.
The better framing
Support data is one of the only places where customers explain, in plain language, why they're blocked, annoyed, confused, or disappointed. Product analytics can show that users dropped off. Support tickets often show why they dropped off.
The missed opportunity isn't just operational efficiency. It's revenue intelligence. The queue tells you which problems hurt adoption, which customer segments struggle most, and which requests might lead to expansion. Teams that learn to read that signal stop asking “how many tickets did we close?” and start asking “which issues are costing us renewals or slowing growth?”
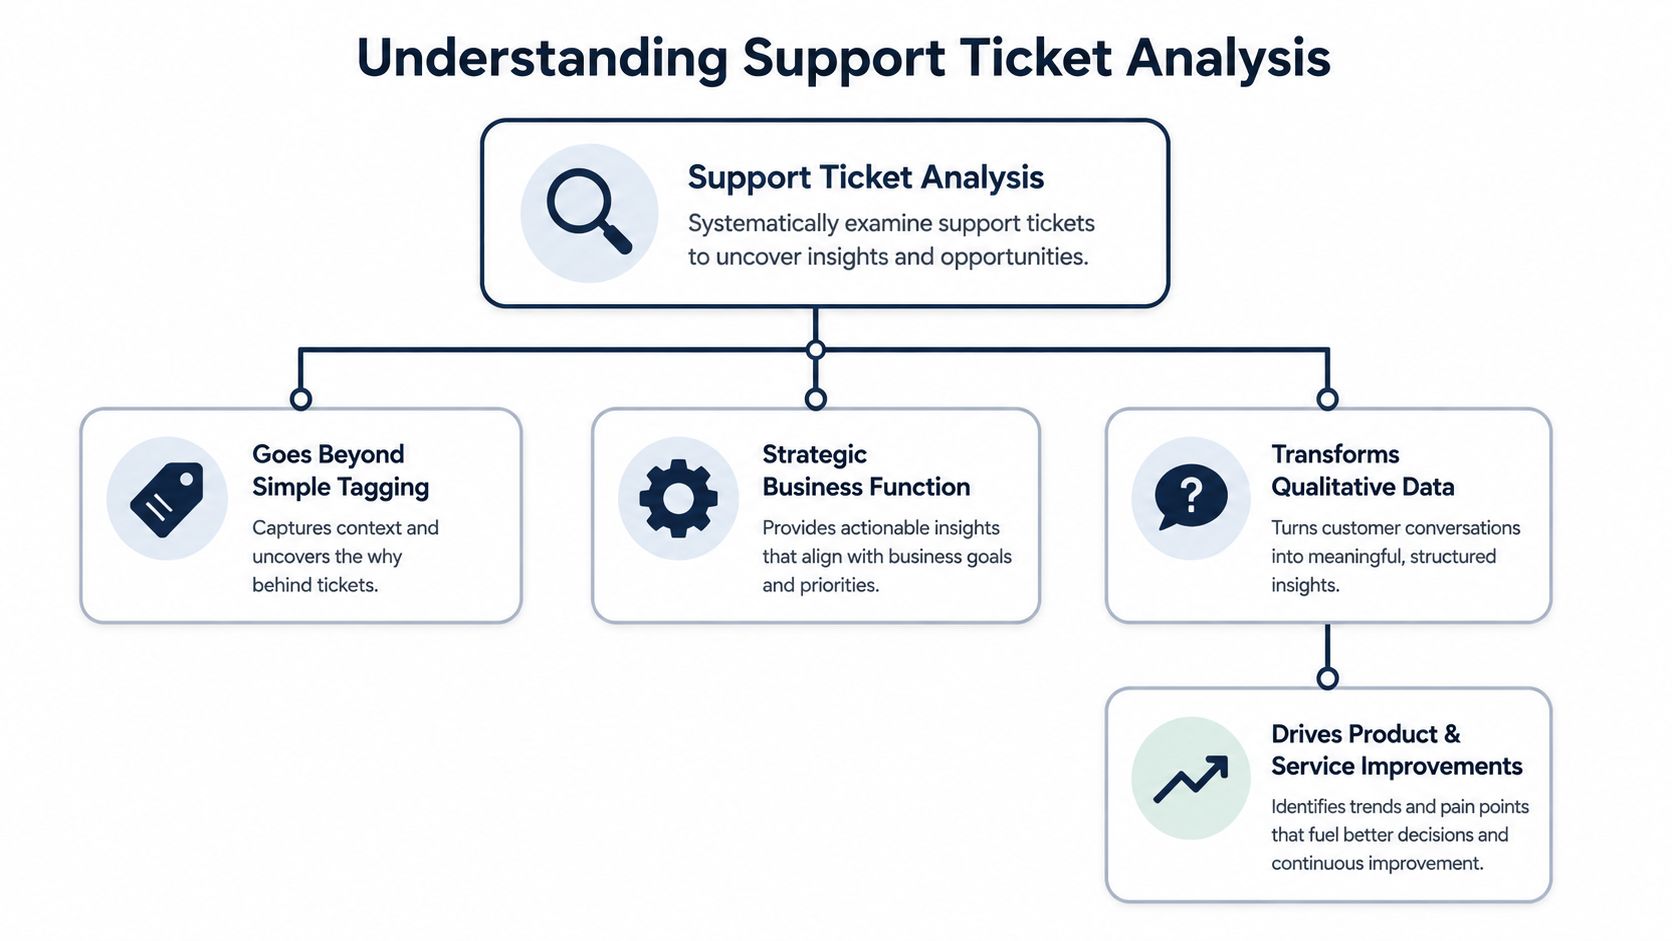
What Is Support Ticket Analysis Really
The common perception of support ticket analysis is that it means cleaner tags, better dashboards, and a weekly report on top ticket categories. That's too small.
Real support ticket analysis turns messy customer language into structured business intelligence. It connects what customers say with what they do, what they buy, and whether they stay. The point isn't to classify tickets faster. The point is to understand which patterns deserve action from product, success, and leadership.
The old model breaks early
Manual tagging works when volume is low and categories are obvious. It breaks when language gets messy, agents apply tags inconsistently, and issues overlap. “Billing issue” might be a failed workflow, missing permissions, poor onboarding, or a pricing objection surfacing through support.
That's why keyword logic performs so badly on complex queues. Unthread's support sentiment analysis benchmarks report that AI-driven support ticket sentiment analysis has transformed help desk accuracy to 94%, while traditional keyword-based searches reach only a 15% relevance rate for identifying true customer issues. In practice, keyword systems catch surface phrasing. They miss context.
A useful analogy is mining. Manual review and keywords are a sieve. They catch the visible chunks. Modern AI analysis is closer to geological mapping. It helps teams find the full vein, not just the obvious fragments on top.
The strategic definition that matters
Strong ticket analysis answers questions that a COO, CEO, or CPO cares about:
- Which issue clusters show rising churn risk
- Which customer segments experience the same friction repeatedly
- Which product areas generate requests tied to expansion conversations
- Which problems should engineering fix first because they affect revenue, not just volume
That's where support becomes a business function instead of a service function.
Teams evaluating tooling often look for platforms that go beyond queue reporting and expose trends, sentiment, and account-level patterns. A practical example is Halo AI for customer support insights, which illustrates the broader category shift from ticket handling toward support intelligence.
Support data is only “qualitative” until a team consistently translates it into priorities, risks, and decisions.
What good analysis produces
When support ticket analysis is done well, the output isn't another dashboard nobody checks. It's a ranked list of product issues, friction points, and customer signals that teams can act on quickly. Product gets cleaner prioritization. Success gets earlier warning signs. Leadership gets a line of sight from customer pain to business outcome.
That's the actual job.
The AI Techniques That Find the Signal
Modern support queues are too large and too inconsistent for manual review to work. Customers describe the same issue in different language. Some write two words. Others send a paragraph. Agents tag differently. Product names change. New issues appear without warning.
AI helps because it looks for meaning, not just matching words.
Start with language, not labels
The first layer is natural language processing, or NLP. In plain terms, that means software reads ticket text the way an analyst would, then converts it into a form a model can compare and group.
A customer might write “can't log in,” another says “SSO is failing,” and a third says “I'm locked out after reset.” A keyword system may split those apart. A semantic model can recognize that they're related.
The technical pipeline matters here. According to Produktly's glossary on support ticket analysis, the process involves tokenizing text, extracting semantic embeddings via models like BERT, and applying unsupervised clustering, which reaches an 85-90% concordance rate with manual human coding while processing 10,000+ tickets in sub-minute intervals and reducing operational latency by 99%.
That sounds technical, but the practical effect is simple. The machine can sort a huge queue by meaning much faster than people can.
What the pipeline looks like in practice
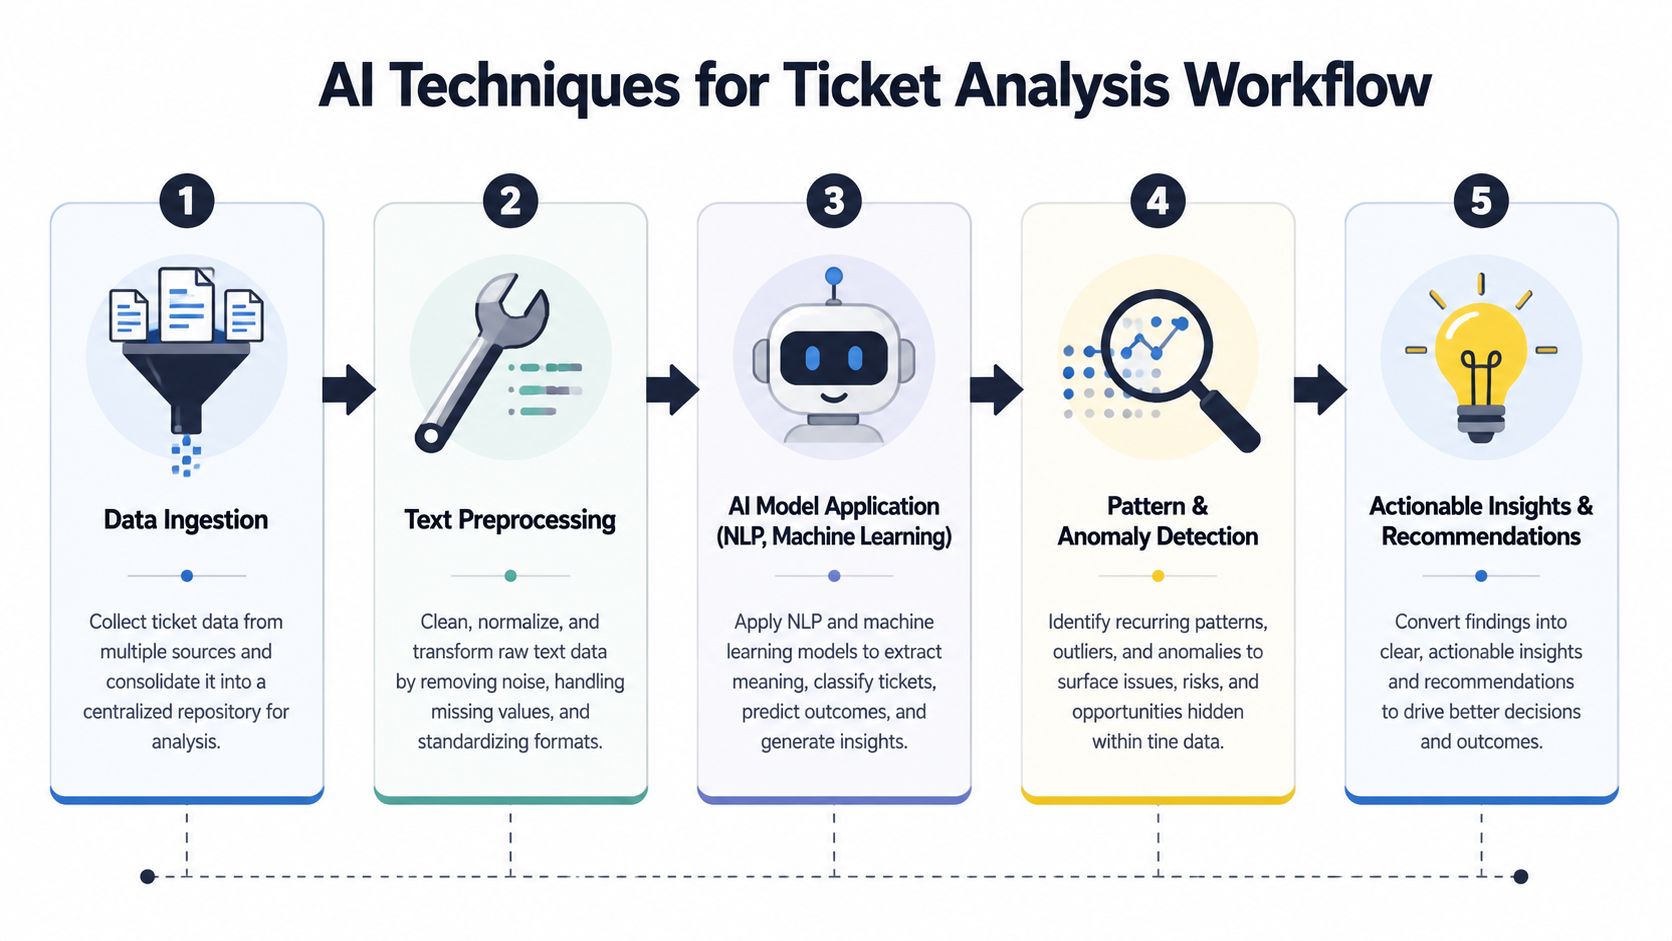
A useful way to think about it is as a sequence:
- Data ingestionTickets come in from Zendesk, Intercom, chat, email, and sometimes call transcripts.
- Text preprocessingThe system cleans the text, separates useful terms, and normalizes phrasing.
- Embedding and comparisonModels such as BERT represent each ticket by meaning, not just exact wording.
- Clustering and topic detectionSimilar tickets get grouped into themes like login friction, billing confusion, onboarding gaps, or export failures.
- Action and routingTeams can then send urgent themes to support, recurring defects to engineering, and account-specific risks to customer success.
Why clustering beats manual taxonomy
Manual taxonomy asks people to define categories before they know what the data contains. That's backwards. In fast-moving products, the important issue often isn't in your taxonomy yet.
Clustering works better because it lets the pattern emerge from the tickets themselves. That's especially useful after releases, pricing changes, onboarding redesigns, or enterprise launches, when customers describe new problems in language your team didn't anticipate.
A lot of CX teams are trying to understand this shift at the channel level too. For leaders working across email, calls, chat, and messaging, AI analysis for CX leaders is a useful reference point for how the same methods apply beyond a single help desk.
The win isn't automation for its own sake. The win is seeing the pattern early enough to fix it before it spreads.
Root cause detection is where value appears
Categorization alone doesn't justify the effort. Root cause detection does.
If a cluster grows around “reporting dashboard is wrong,” the underlying issue may be stale sync timing, not the dashboard itself. If a cluster forms around “can't invite teammates,” the underlying issue may be role permissions hidden in setup. Good analysis keeps drilling until product and engineering can act.
This is also where support data starts feeding retention work. Teams trying to connect support patterns to account health often combine ticket themes with product usage and sentiment. That's the same logic behind predicting customer churn from behavioral signals. The ticket tells you what the customer said. Behavior tells you whether the problem changed their engagement.
Metrics That Matter to Your CEO
The weekly support report says response times improved. The CEO still asks a different question: are we removing the issues that put renewals at risk and stall expansion?
That gap is where a lot of support reporting fails. Teams present service efficiency. Executives need financial exposure. They want to know which problems are concentrated in high-value accounts, which product decisions are creating repeat friction, and whether fixes are lowering churn risk in the quarters that follow.
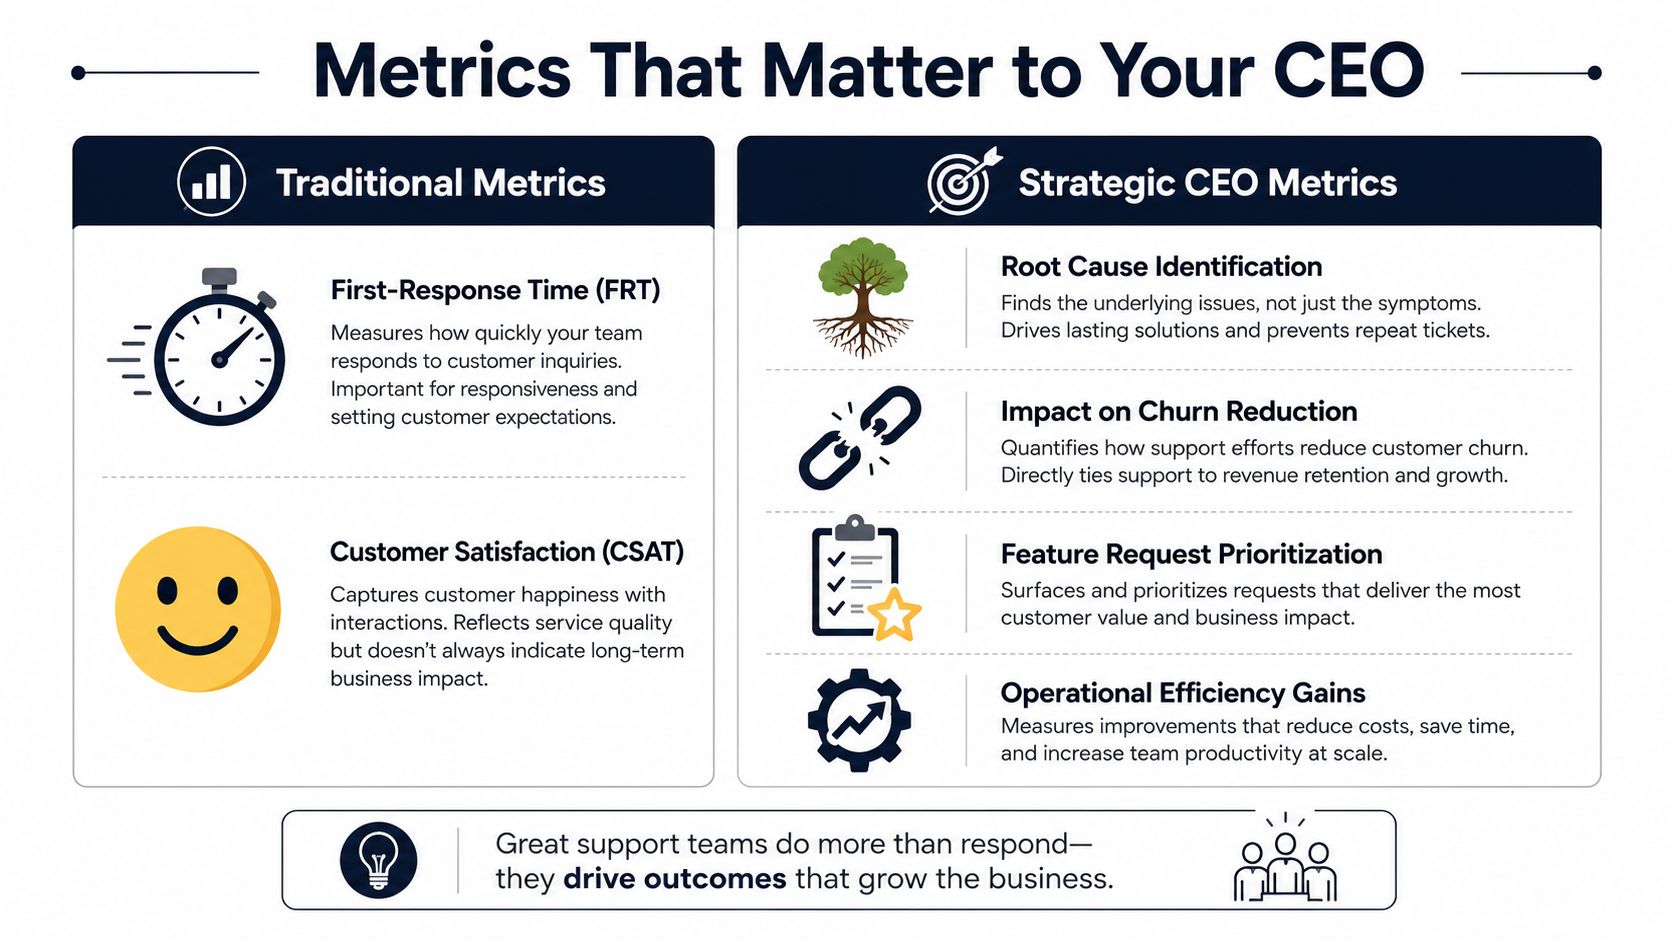
Keep the operational metrics, but demote them
First-response time, resolution time, CSAT, and first-contact resolution still matter. Support leaders need them to run staffing, quality, and queue health.
They just should not lead the executive conversation.
A faster response to a known product defect does not protect revenue by itself. If the same defect keeps surfacing in onboarding for enterprise accounts, support may look efficient while the company keeps absorbing preventable loss through delayed launches, weak adoption, and churn at renewal.
The metrics executives actually need
In practice, three categories change prioritization.
Revenue-linked issue frequency
Start with issue volume, then weight it by account value and revenue motion.
A billing complaint from a low-fit self-serve customer and the same complaint from a strategic account do not carry the same business impact. The executive view should show which themes appear inside renewal-risk accounts, expansion opportunities, and late-stage deals. That is how a bug report turns into a finance discussion.
Cohort-specific friction
Aggregate charts hide the problems that matter most.
Break ticket themes out by customer cohort, because the same issue means different things at different stages of the relationship:
| Segment view | Useful question |
|---|---|
| New customers | What friction is slowing activation |
| Mature accounts | What issues indicate adoption decay |
| Enterprise prospects | Which requests block late-stage deals |
| High-value renewals | Which recurring defects increase churn risk |
This view changes roadmap decisions fast. A narrow issue affecting a small set of high-value accounts can deserve higher priority than a noisy, low-impact theme that fills the queue.
Root-cause removal
Executives care about whether the company fixed the cause, not whether support processed the symptoms faster.
That means tracking recurring issue classes before and after a product, policy, or workflow change. The point is not ticket closure. The point is whether a known source of friction stops showing up for the same revenue-critical segment. Done well, this is one of the few support metrics that has a clear path to lower support cost and better retention at the same time. McKinsey has written about companies using advanced analytics and digital service improvements to shift demand away from avoidable contacts and reduce service volume over time, which is the economic outcome support leaders should be aiming for, not just quicker handling (McKinsey on customer care transformation).
A support function becomes strategic when it can show which recurring issue was removed, which accounts were protected, and what revenue risk came off the table.
What to put on the executive dashboard
A useful executive dashboard is short and pointed. It should answer five questions:
- Which issue clusters are growing
- Which customer segments are affected
- What product area owns the root cause
- What revenue motion is at risk, retention or expansion
- Whether the fix reduced recurring ticket volume afterward
Satisfaction metrics still belong in the picture. If you need a cleaner framework for service-side measurement, this guide on how to calculate CSAT, NPS, and CES is a practical complement. Those numbers help explain customer experience quality. They do not replace revenue-weighted issue analysis.
For teams formalizing this reporting structure, a simple starting point is to build product and support dashboards around metrics and reporting that connect activity to outcomes, rather than publishing a long list of isolated support KPIs.
Implementing a Modern Analysis Workflow
Most companies don't need another reporting project. They need a repeatable workflow that takes raw support conversations, extracts signal, and puts the result where decisions already happen.
That means fewer static decks and more live connections between support systems, product tools, and revenue context.
Start with complete data intake
Many teams fail at the first step because they analyze only the help desk. That misses the broader customer record. The most useful signals often sit across multiple systems:
- Help desk platforms such as Zendesk or Intercom
- Customer communication tools like shared inboxes, chat, and support Slack channels
- Sales and success conversations that reveal objections and adoption blockers
- Usage data that shows whether support issues lead to drop-off or recovery
If you only ingest tickets, you can find themes. If you combine tickets with customer behavior, you can rank those themes by likely business impact.
Choose build versus buy honestly
Teams often burn time. They assume the main question is technical sophistication. It usually isn't. It's maintenance burden.
Building in-house gives you control. It also gives you model tuning, taxonomy upkeep, integration work, QA, alert logic, dashboard design, and internal support for the system itself. That can make sense for teams with strong data engineering capacity and a clear reason to own the stack.
Using a platform trades flexibility for speed. You get faster implementation, prebuilt connectors, and less operational overhead, but you accept the product boundaries of the vendor.
A practical evaluation table helps:
| Decision area | Build in-house | Use a platform |
|---|---|---|
| Setup speed | Slower | Faster |
| Custom logic | Higher control | Defined by product capabilities |
| Maintenance | Internal burden | Vendor-managed |
| Integration effort | Usually heavier | Usually lighter |
| Model iteration | Fully owned | Limited to product settings |
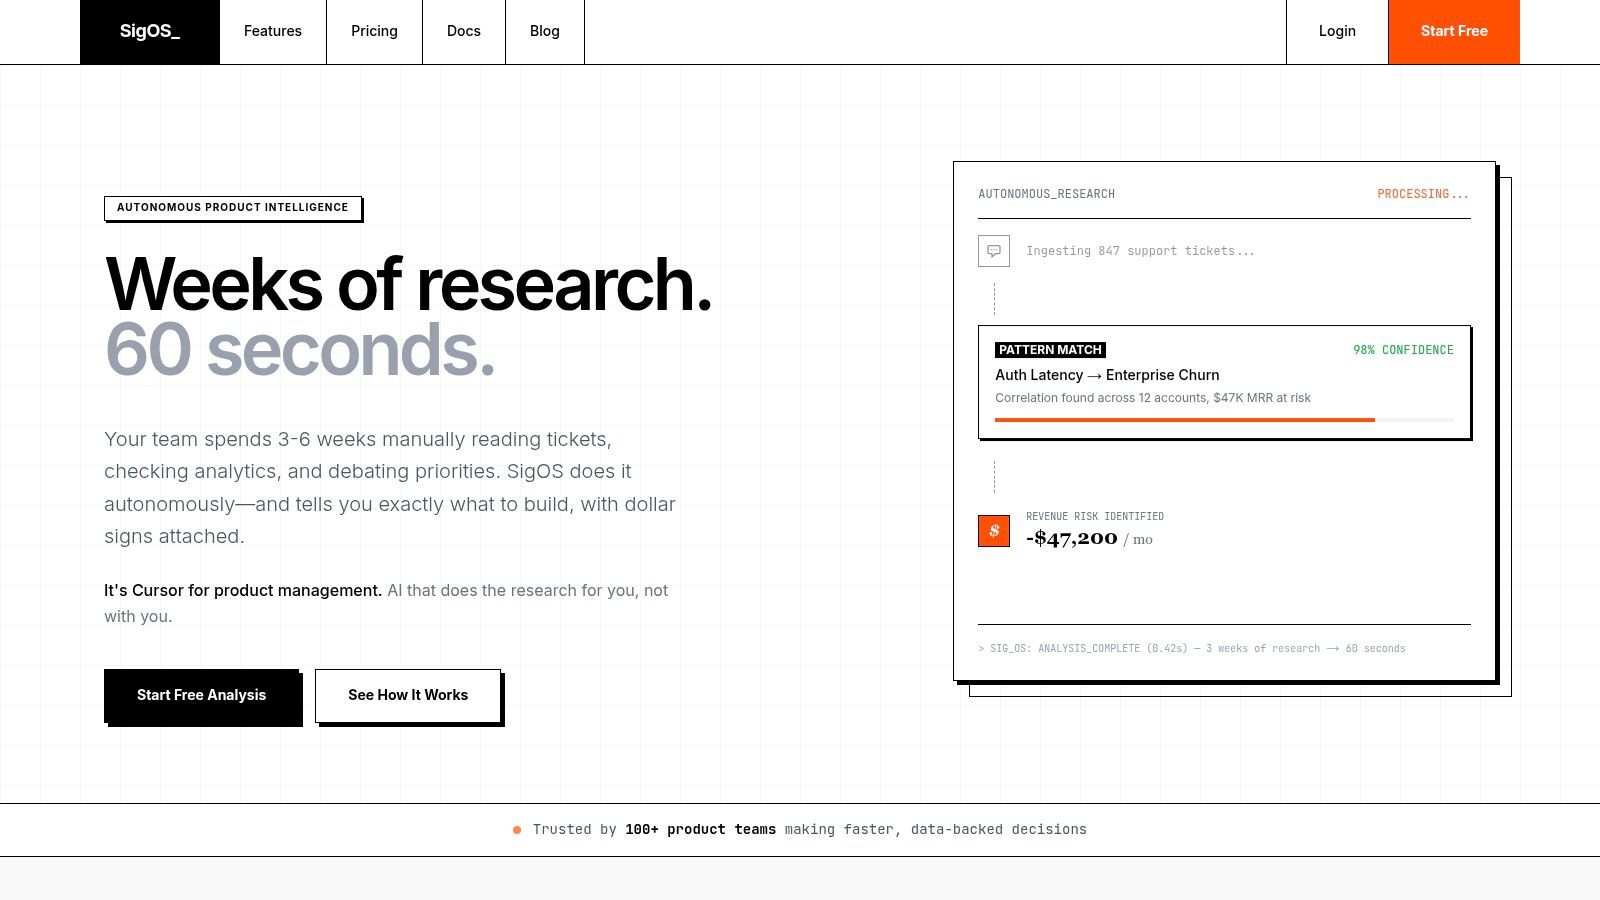
One option in that platform category is SigOS, which analyzes support tickets, chat transcripts, sales calls, and usage signals to surface patterns tied to churn, expansion, and revenue impact. The point isn't that every team should buy the same tool. The point is that the workflow should produce a ranked output that product can act on, not just a cleaner report.
Make the output operational
The workflow breaks if insights stay in a dashboard. Product teams work in Jira, Linear, GitHub, and planning docs. Revenue teams work in account reviews and renewal planning. Support leaders work in queue management.
So the analysis layer needs to push results into those systems with enough context to matter.
A useful issue payload includes:
- The patternWhat cluster is growing or recurring.
- The affected groupWhich segment, account tier, or product area shows the issue.
- The evidenceRepresentative ticket language, recent trend, and related usage behavior.
- The recommended ownerSupport, product, engineering, onboarding, or success.
- The business framingWhether the issue points more strongly to churn risk, blocked adoption, or expansion friction.
That's the difference between “many users are confused by export settings” and “export confusion is recurring in a valuable segment and needs a product fix.”
Put reviews on a real cadence
A working workflow needs human review, just not manual sorting.
Use recurring cross-functional reviews where support, product, success, and engineering look at:
- Emerging patterns that need fast triage
- Confirmed root causes already worth fixing
- Resolved themes to verify whether volume and sentiment improved
- Open strategic requests that may point to packaging or roadmap opportunities
For teams building the intake layer first, this guide to a customer feedback analysis tool is a useful reference because it focuses on consolidating noisy feedback into something a product team can use.
Later in the workflow, a short product walkthrough helps teams visualize what “insight to action” should look like in practice.
What good implementation feels like
A healthy system changes the conversation inside the company. Support stops arguing from anecdotes. Product stops treating tickets as random noise. Success stops escalating only the loudest customers. Engineering gets better issue definitions. Leadership sees where customer pain intersects with business risk.
That's when support ticket analysis becomes infrastructure, not a side project.
Avoiding Pitfalls and Prioritizing What to Fix
The biggest failure mode in support ticket analysis is false confidence. Teams add tags, build a few charts, and assume they now understand the customer. Usually they've just organized the noise.
The hard part isn't collecting tickets. It's separating loud from important.
A few angry customers can dominate internal attention, especially if they're vocal in shared Slack channels or copied executives. Meanwhile, a quieter pattern can spread across dozens of accounts with lower drama but higher business risk. That's why prioritization has to combine issue frequency with customer context and downstream behavior.
Manual tagging doesn't scale
Manual review still has a role in validation, QA, and edge cases. It should not be the primary analysis method in a high-volume environment.
The signal-to-noise problem is already widespread. Emerging data from the 2024 AI in Customer Support Survey shows that 78% of support leaders struggle with the signal-to-noise ratio in unstructured text. That finding matches what operators already know. Once ticket volume rises, human tagging becomes inconsistent, delayed, and too expensive to maintain.
If your process depends on one person tagging everything “the right way,” you don't have a scalable analysis system. You have a fragile workaround.
Prioritize by impact, not emotion
A simple prioritization model works better than often expected. Rank issue clusters on two axes:
| Axis | What to ask |
|---|---|
| Frequency | Is this recurring often enough to indicate a systemic issue |
| Business impact | Does it affect retention, expansion, onboarding, or high-value segments |
That framework prevents two common mistakes. First, over-prioritizing one-off complaints from influential customers without evidence of broader impact. Second, under-prioritizing widespread friction because each individual ticket looks minor.
Common mistakes that slow teams down
- Treating all tickets equally. A billing annoyance, onboarding blocker, and core workflow defect should not enter the same prioritization bucket.
- Separating support from usage data. Ticket text tells you what users say. Behavioral data shows whether the problem changes adoption or retention patterns.
- Letting insights die in dashboards. If findings don't create issues in Jira, Linear, or whatever planning system product uses, they rarely shape execution.
- Optimizing for closure alone. Fast resolution can hide repeated product failure. The ticket disappears. The cause remains.
The operating rule that holds up
Automate the reading. Keep humans focused on interpretation, trade-offs, and action. Then tie every meaningful pattern back to a business question: does this affect churn risk, expansion potential, or adoption in a segment we care about?
That's the standard. Not “is this interesting.” Not “did a senior person mention it.” Not “did support log a lot of these last week.”
Fix what matters to the business, and support ticket analysis stops being a reporting exercise. It becomes a prioritization engine.
If your team wants to move from reactive support reporting to revenue-linked product intelligence, SigOS helps connect support tickets, conversations, and usage signals so product and growth teams can see which issues are tied to churn risk, expansion opportunities, and real prioritization decisions.
Keep Reading
More insights from our blog


Ready to find your hidden revenue leaks?
Start analyzing your customer feedback and discover insights that drive revenue.
Start Free Trial →