Unlock Insights With a Unified Data Model
Learn how a unified data model transforms siloed data into revenue-driving insights. Covers architecture, implementation, & product intelligence.
Support says a bug is urgent because ticket volume spiked. Sales says a different request matters more because a strategic account won't expand without it. Product sees declining usage in one workflow, but growth sees healthy top-line conversion. Everyone has data. No one has the same answer.
That situation usually isn't a prioritization problem first. It's a modeling problem.
Organizations often store support data in Zendesk, chat history in Intercom, product events in Mixpanel or Segment, account details in a CRM, and engineering work in Jira or Linear. Each system describes the customer differently. Fields don't line up. Segment definitions drift. Revenue context sits in one place while behavioral evidence sits in another. Teams then build reports on top of those mismatches and wonder why every dashboard tells a different story.
A unified data model fixes that by giving the business one shared vocabulary for entities, relationships, and definitions. It turns scattered signals into something product, support, sales, and growth can trust. It makes business decisions less subjective. When the model is right, you can connect feedback to usage, usage to retention, and retention risk to revenue exposure without stitching together one-off analyses every week.
Introduction From Data Chaos to Business Clarity
A lot of teams reach for a new dashboard when the underlying issue sits deeper. The charts aren't wrong because the BI tool failed. They're wrong because each source system carries its own version of the customer, the account, the subscription, and the event.

Here's how that plays out in practice. Support groups tickets by plan name. Product groups usage by workspace size. Finance reports by contract hierarchy. Sales tracks opportunity risk by account owner notes. When the leadership team asks which issue matters most, every function brings a plausible answer backed by a different join path and a different definition.
That creates three expensive habits:
- Reactive prioritization: Teams ship the loudest fix, not the highest-impact one.
- Metric distrust: Product managers spend time validating numbers instead of acting on them.
- Lost context: Engineers see bug counts, but not whether those bugs cluster in accounts with expansion potential or churn risk.
Practical rule: If two teams can answer the same business question with different customer definitions, you don't have a reporting issue. You have a shared model issue.
A unified data model becomes the operating layer between raw data and business decisions. It defines what a customer is, what a subscription is, how plans roll up, how tickets connect to accounts, and how events map to features. Once those rules exist centrally, every downstream dashboard, analysis, and alert starts from the same semantic foundation.
Where the business value shows up first
Cross-functional clarity usually improves before anything else. Product can evaluate a bug not just by ticket volume but by the account segment affected. Growth can separate noisy feature requests from requests tied to adoption patterns. Support leaders can see which complaint themes show up in accounts that are also reducing engagement.
That shift matters because prioritization gets better when teams stop arguing over whose dataset is correct.
A unified data model won't remove judgment. It gives judgment a reliable base. That's the difference between debating anecdotes and comparing evidence that has already been standardized across the company.
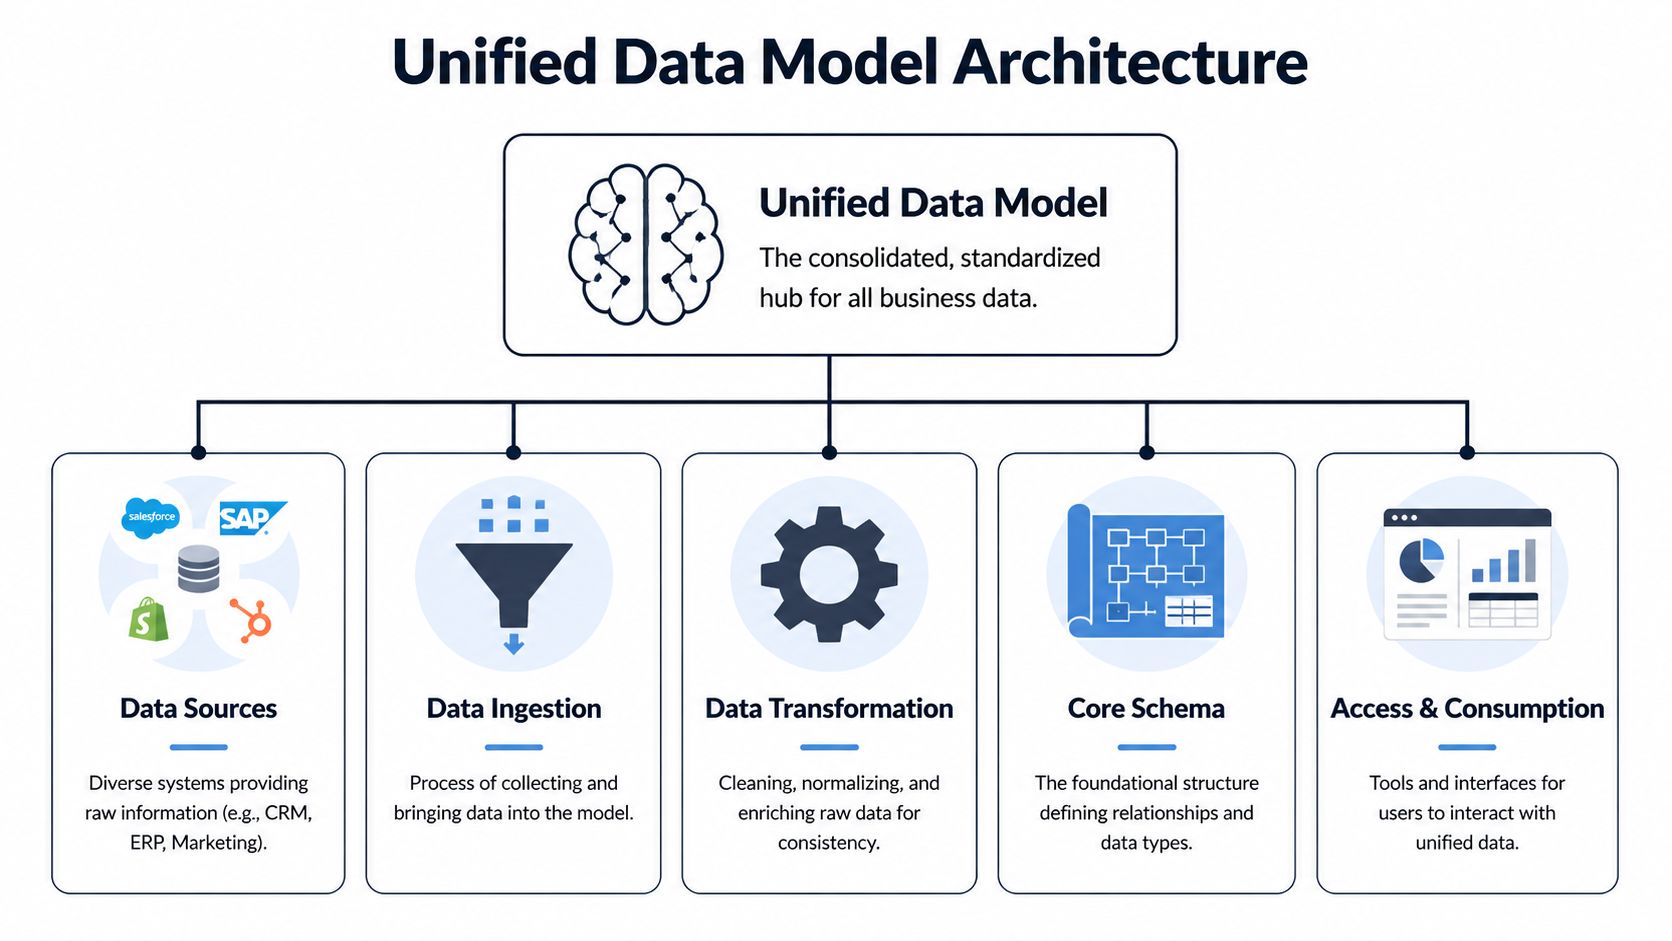
What Is a Unified Data Model Really
A unified data model is the shared structure that gives business data consistent meaning across systems. Think of it as a universal translator. Zendesk, Intercom, your product telemetry, your CRM, and your billing platform all speak different dialects. The model translates them into one language.

That distinction matters because teams often confuse the model with the warehouse. A warehouse stores data. A unified data model defines what the data means, how entities relate, and which definitions are authoritative. You can have a modern warehouse and still have chaos if every team models customers, plans, and lifecycle stages differently.
What it is and what it isn't
A warehouse answers, "Where does the data live?"
A unified data model answers, "What does this data represent, and how should everyone use it?"
Without that second layer, you get a pile of technically accessible records with no stable business semantics. Analysts can still query it, but every meaningful question requires re-deriving the business logic.
Microsoft's UDM work gives a concrete example. Its strategy standardizes shared dimensions such as PaidSeatSizeBucket, using consistent seat-count ranges like small: 1-10 seats, so every metric uses the same segmentation logic. Microsoft notes that inconsistent segment definitions previously drove KPI misalignment and inflated analysis costs by up to 30-50% in rework in siloed environments, as described in its post on standardizing dimensions in the Unified Data Model.
That example is more useful than a textbook definition because it shows what the model does. It doesn't just "organize data." It prevents five teams from creating five different seat-size buckets and then arguing about conversion, retention, or expansion outcomes based on incompatible segments.
The semantic layer people actually feel
A good unified data model usually includes a few things:
- Core entities: customer, user, subscription, workspace, ticket, event, opportunity
- Shared dimensions: country, industry, plan type, seat bucket, lifecycle stage
- Relationship rules: which user belongs to which account, which ticket maps to which subscription, which event belongs to which feature area
- Definition contracts: what counts as active usage, churn risk, expansion signal, or a qualified request
Teams feel the value when these definitions stop moving underneath them.
For a quick visual explainer, this overview is useful:
Why teams resist it at first
The pushback is predictable. A unified data model sounds slower than just shipping another pipeline. It introduces governance. It forces naming decisions. It exposes where systems disagree.
All of that is true.
A model only feels heavy when teams are used to paying the cost later in reconciliation, dashboard disputes, and custom logic.
The point isn't to create a perfect ontology. The point is to stop re-solving the same identity, classification, and joining problems every time someone asks a cross-functional question. When a company reaches that threshold, the unified data model stops being an abstract data concept and starts functioning like shared infrastructure for decision-making.
Unlock Product Intelligence and Revenue Growth
Most explanations of a unified data model stop at consistency. That's not where product and growth teams feel the value. They feel it when the model changes how they prioritize work.
Deliveroo is a useful example. Mixpanel describes how Deliveroo used its Unified Data Model to consolidate disjointed analytics into a single source of truth, which improved feature prioritization by grounding decisions in real user behavior. The result was faster decision-making because product managers could trust the metrics instead of second-guessing inconsistencies, as covered in Mixpanel's write-up on its Unified Data Model.
That pattern shows up in SaaS environments all the time. Once the data model aligns behavioral events, support friction, and account context, the conversation changes from "How loud is this issue?" to "What business outcome is this issue attached to?"
Revenue prioritization gets sharper
A backlog becomes easier to rank when feedback is tied to account characteristics and actual usage behavior.
A bug reported by a handful of customers may still deserve immediate attention if those customers share the same expansion profile, plan tier, or workflow dependence. The reverse is also true. A request with many votes may be low impact if it comes from lightly engaged accounts with little retention impact.
That doesn't mean every team needs a financial model for every ticket. It means the unified data model should make these questions answerable:
| Question | Why it matters |
|---|---|
| Which accounts report this issue? | Separates isolated noise from segment-level risk |
| What product behaviors changed before the complaint? | Distinguishes symptom from root cause |
| Which contract or plan attributes cluster around the issue? | Connects technical friction to commercial exposure |
| Has the same pattern appeared before churn or downgrade? | Turns backlog review into risk management |
This is also where adjacent tooling starts to matter. Teams using AI for business insights often discover that conversation data is valuable only when it can be tied back to product behavior and account context. A unified model is what makes that connection durable instead of ad hoc.
Churn signals become more reliable
Churn rarely announces itself in one place. It emerges as a pattern across support friction, lower engagement, failed onboarding steps, and account-level context.
When those signals sit in separate systems, teams overreact to the most visible one. Support may escalate a ticket cluster. Product may focus on a feature drop-off. Customer success may rely on call notes. A unified data model lets you evaluate them together.
That matters because customer risk often hides in combinations:
- Support friction with declining usage: not just complaints, but complaints from accounts that are also using the product less
- Feature confusion inside a strategic segment: not just low adoption, but low adoption among accounts that should be prime candidates for expansion
- Repeated workaround behavior: not just a bug report, but a behavior pattern that suggests customers are avoiding a workflow entirely
Operator's advice: Track issues in the context of entity relationships, not channel volume. Tickets alone tell you who's upset. A unified model helps show who is at risk.
If you're building toward self-serve analysis for PMs and growth leads, it's worth studying examples of self-serve analytics in product teams. The key lesson is that self-service only works when the underlying model is stable enough that non-technical users don't need to reinterpret every field.
Expansion signals get easier to spot
Expansion usually looks qualitative at first. A feature request from a larger account. A sales call mentioning a missing workflow. A cluster of usage from one team but not another.
Without a unified model, these signals remain scattered anecdotes. With one, teams can examine whether feature requests correlate with deeper activation, broader seat usage, or plan-fit patterns. That allows product and growth teams to treat feature demand as a business signal rather than a voting contest.
The important shift is this. A unified data model doesn't just help you report the past more neatly. It improves how teams decide what to build next by connecting product behavior, customer feedback, and commercial context into one decision surface.
Core Architecture and Schema Patterns
A unified data model earns its keep in the schema. If the structure is wrong, product and growth teams cannot trust the outputs that drive roadmap priority, expansion targeting, or churn review. I have seen teams ingest plenty of data and still argue over basics like what counts as an active account or which subscription should own a support issue. The model failed before the dashboard did.
The architecture does not need novelty. It needs clear entity boundaries, stable joins, and a schema that can absorb new systems without rewriting core business definitions. For visual examples of these decisions, see our guide to data architecture diagrams.
Base profiles, extensions, and dimensions
A practical pattern starts with three layers: base profiles, extensions, and dimensions.
- Base profiles store durable identity for the entity. For an account, that usually means account ID, parent-child relationship, billing owner, and the canonical subscription link.
- Extensions hold domain-specific attributes that change faster or apply only to one workflow. Product usage summaries, support severity history, lifecycle markers, and experiment cohorts fit here.
- Dimensions standardize shared reference values such as plan family, region, industry, seat range, or feature category.
This separation matters because product questions and revenue questions rarely change at the same pace. Account identity should stay stable for years. Usage states, support classifications, and campaign segments can change weekly. Mixing both into one flattened table creates brittle reporting and expensive cleanup.
In SigOS, this pattern is especially useful when teams want to connect feature adoption, ticket patterns, and commercial context in one model without letting each team redefine the customer differently. PMs can analyze activation by workspace or feature area. Growth leads can examine renewal risk or expansion readiness by account and plan. Both groups stay tied to the same core entity definitions.
Schema choice is a trade-off, not a doctrine
The usual debate is star schema versus snowflake schema. The better question is which layer serves which decision.
| Pattern | Best when | Main drawback |
|---|---|---|
| Star schema | PMs, marketers, and BI users need simple query paths and fast reporting | Shared reference data gets duplicated more easily |
| Snowflake schema | Central teams need tighter control of dimensions reused across multiple domains | Queries are harder for non-specialists to read and maintain |
| Hybrid approach | You need governed core entities plus analyst-friendly marts for specific use cases | Requires active stewardship to keep marts aligned with the core |
For most product intelligence programs, the hybrid model works best. Keep the canonical layer normalized enough to preserve relationship accuracy. Publish simpler marts for churn analysis, onboarding performance, revenue prioritization, and support escalation review.
That design also helps teams reduce infrastructure costs because fewer teams build duplicate pipelines, duplicate business logic, and duplicate fixes for the same entity problems.
Patterns that hold up under real use
The strongest schema patterns are usually the least flashy.
What works well:
- Start with a small set of business entities. Account, user, workspace, subscription, event, ticket, and opportunity are often enough to support the first wave of product and revenue analysis.
- Keep canonical logic separate from reporting shortcuts. A temporary dashboard calculation should not become the company definition of activation or churn risk.
- Govern dimensions centrally. Plan tier, segment, geography, and lifecycle stage should mean the same thing in product, support, and GTM analysis.
- Design for relationship history. If an account changes plan, owner, or parent organization, keep that history explicit so teams can analyze cause and effect instead of overwriting context.
What breaks down:
- One giant table that tries to answer every question at once
- Source-shaped modeling where Salesforce, Zendesk, or Amplitude field names dictate the business schema
- Unowned field growth where every team adds attributes without naming rules, lineage, or relationship standards
A good unified model makes business decisions easier to defend. If SigOS shows that churn risk is rising in accounts with declining workspace adoption and repeated support friction in one feature area, the schema should let a PM and a growth lead reach that conclusion from the same model, not from competing spreadsheets. That is the standard to design for.
Integrating Disparate Data Streams Strategically
The model is only useful if real systems can map into it without constant manual repair. However, many initiatives stall at this stage. The conceptual schema looks good, but the source data is messy, incomplete, and inconsistent across tools.
That isn't a reason to avoid a unified data model. It's the reason to build one carefully.

Start with entity mapping, not ingestion volume
Teams often begin by pulling in everything from Zendesk, Intercom, Salesforce, Jira, GitHub, Segment, Amplitude, and billing data. That creates a large raw lake quickly, but not a usable model.
A better sequence is narrower:
- Pick the business entities first. Customer, ticket, feature area, workspace, subscription.
- Map source records to those entities. A Zendesk organization might align to account. An Intercom conversation might map to both user and account. A product event may require identity stitching before it belongs anywhere reliable.
- Define relationship confidence. Some joins are exact. Others are inferred. Don't hide the difference.
That approach keeps ingestion from becoming a data hoarding exercise.
Normalize unstructured and structured inputs together
The hard part isn't bringing in event logs. It's making free-text feedback useful beside them.
A support ticket may contain a bug report, sentiment, urgency, workflow references, and a hidden clue about account risk. A sales call note may mention procurement, security concerns, missing permissions, or a blocked rollout. If the model can't represent those as structured, queryable entities, they stay trapped as narrative.
Brinqa's UDM offers a strong example of why schema enforcement matters here. Its platform links related records such as findings and remediation requests, and Brinqa says that schema enforcement reduces integration errors by 70% in multi-tool environments where inconsistent source formats can otherwise cause 25-30% analysis inaccuracies, according to its UDM reference documentation.
The lesson applies outside security tooling. If Jira issue types, GitHub labels, support categories, and CRM notes all describe the same product problem differently, the model has to normalize them into a shared issue taxonomy and relationship graph.
A practical integration pattern
One workable pattern looks like this:
| Source system | Raw input | Normalized output in the model |
|---|---|---|
| Zendesk | ticket text, tags, requester, org | ticket entity, issue type, sentiment, linked account |
| Intercom | chat transcript, conversation topic | conversation entity, topic classification, linked user |
| Product telemetry | events, sessions, feature usage | event and feature usage entities tied to workspace and account |
| CRM | account notes, opportunities, call summaries | opportunity and account context linked to product and support signals |
| Jira or GitHub | issue status, labels, owner | engineering work item linked to issue cluster and source evidence |
The goal isn't to preserve each tool's worldview. It's to preserve the business meaning while removing the tool-specific noise.
Security and integrity are part of integration
Cross-functional models often combine support, behavioral, and revenue-adjacent data. That raises the stakes on access control and lineage.
A few rules help:
- Limit field access by role. Not every consumer needs conversation transcripts or account notes.
- Track source lineage. Teams should be able to see whether a field came from the CRM, ticketing, telemetry, or a derived classification.
- Version mapping logic. Identity stitching and taxonomy rules change. The model needs a record of when and how.
The strategic point is simple. Integration isn't successful when all data lands in one place. It's successful when different data streams can describe the same customer, issue, and outcome without contradicting one another.
Your Implementation Roadmap and Governance Plan
Most unified data model projects fail for organizational reasons before they fail technically. Teams either over-scope the first release or under-invest in governance and training. The architecture may be sound, but the operating plan isn't.
That problem is especially visible in constrained environments. The healthcare literature highlights a broader gap here: while patient-level UDS submissions began in 2023, documentation on how resource-constrained organizations overcome budget, staffing, and training barriers for implementation remains sparse, as noted in the CMS document on UDS reporting and implementation context. The same adoption friction appears in smaller SaaS teams with limited data engineering bandwidth.
Phase one focuses on questions, not platforms
Start by choosing the business decisions the model must improve.
Good first questions tend to be cross-functional:
- Which product issues correlate with churn risk?
- Which feature requests appear in accounts with expansion potential?
- Which support patterns show up before adoption drops?
Then define the first entities required to answer them. These are typically a tight set such as customer, user, subscription, ticket, and event. Avoid adding every possible entity up front.
A practical discovery checklist:
- Name the decision owner. Someone must own the business question, not just the pipeline.
- Define canonical entities. Agree on what account, workspace, subscription, and active user mean.
- Set quality thresholds. Decide what level of identity match or taxonomy confidence is acceptable for launch.
Phase two proves value with a pilot
A pilot should involve only the minimum systems needed to produce a decision someone will use. Zendesk plus product telemetry is often enough. CRM data can come next if the first use case requires revenue context.
This is also the right moment to establish operating rules using proven enterprise application integration best practices. The useful principle isn't complexity for its own sake. It's making ownership, interfaces, retries, and security expectations explicit before scale amplifies confusion.
Governance note: A pilot isn't a shortcut around governance. It's where governance becomes small enough to implement well.
During the pilot, watch for three failure modes:
| Failure mode | What it looks like | Fix |
|---|---|---|
| Schema drift | Source teams keep adding one-off fields with unclear meaning | Require field ownership and naming standards |
| Silent quality issues | Joins look plausible but link the wrong entities | Add validation checks and review mismatches weekly |
| No operational consumer | The model exists, but nobody changes decisions because of it | Tie pilot outputs to a real backlog or account review process |
Phase three scales through ownership and controls
Once the model supports one live decision loop, expand by domain. Add sales context. Add engineering issue status. Add lifecycle milestones. But don't centralize every decision in one team.
A sustainable governance model usually includes:
- Data owners by entity: one owner for customer, another for ticket taxonomy, another for subscription logic
- Schema change review: lightweight, but mandatory for new shared fields and dimensions
- Access policy by data class: especially when support conversations and revenue context live together
- Quality monitoring: freshness, null handling, taxonomy drift, and identity resolution exceptions
If quality problems are already hurting trust, teams should address those basics before adding more intelligence layers. Resources on common data quality issues in analytics systems are useful because they keep the conversation grounded in operations, not theory.
The implementation mindset should be steady, not heroic. A unified data model is a product. It needs scope control, ownership, release discipline, and user feedback just like any customer-facing system.
Conclusion From Data Chaos to Revenue Clarity
Monday morning, the growth team wants to know which accounts are most likely to expand, support is escalating a spike in complaints, and product is deciding what goes into the next sprint. If each team is working from a different customer record and a different definition of account health, the loudest issue usually wins. Revenue priorities drift because nobody can trace the full path from customer friction to commercial impact.
A unified data model fixes that operating problem by giving every team the same business context. A support ticket is no longer just a ticket. It is tied to an account, contract value, product usage pattern, renewal timing, and recent sales activity. Once those relationships are in place, teams can rank work based on churn risk, expansion potential, and customer concentration instead of volume alone.
That is the practical payoff.
The technical design still matters. Bad identity resolution can misstate account risk. Loose subscription logic can overcount revenue exposure. Over-modeled schemas can slow adoption because teams stop trusting what they cannot explain. In practice, the best models are the ones that answer a few high-value questions clearly and keep enough discipline to scale.
A strong unified data model gives cross-functional teams a shared way to answer questions like:
- Which product issues are affecting high-value accounts?
- Which support patterns show early signs of churn?
- Which feature requests are linked to expansion opportunities?
- Which usage changes should trigger account review now, not next quarter?
Those answers change planning behavior. Product can justify roadmap trade-offs in revenue terms. Growth can prioritize retention plays using actual product and support signals. Sales can walk into renewals with a cleaner view of adoption risk and unmet needs.
That is also why adoption is usually won in one decision loop at a time. Start with a recurring decision that already carries cost, such as prioritizing defects tied to renewals or flagging account segments with both declining usage and rising support volume. Prove that the model improves that decision. Then extend the same entities and logic into adjacent workflows.
This is the gap many high-level articles miss. A unified data model is not just a data foundation project. It is a way to make revenue decisions with less guesswork.
If your team needs one working view across support tickets, chat transcripts, sales calls, and usage data, SigOS helps product and growth teams connect those signals to churn risk, expansion opportunity, and revenue impact.
Keep Reading
More insights from our blog


Ready to find your hidden revenue leaks?
Start analyzing your customer feedback and discover insights that drive revenue.
Start Free Trial →