Your Guide to User Behavior Analytics for SaaS Growth
Unlock SaaS growth with our complete guide to user behavior analytics. Learn how to transform data into insights that predict churn and drive real revenue.

So, what exactly is user behavior analytics (UBA)? It’s the art and science of watching how people actually use your product. We're talking about translating every click, scroll, and keystroke into a story that reveals their true motivations, frustrations, and needs. This moves us past simple metrics like pageviews to uncover the why behind their actions.
Why User Behavior Analytics Is Essential for SaaS Growth

Imagine you could listen in on the silent conversation every customer is having with your software. That's the real power of user behavior analytics. It’s like a decoder for the unspoken language of user actions, showing you precisely what they value, where they get stuck, and when they’re about to give up and leave.
For any SaaS business, this kind of insight isn't just a nice-to-have anymore; it's the bedrock of sustainable growth. Without it, product decisions are often based on guesswork, hunches, or simply the loudest opinion in the room. UBA cuts through the noise with hard evidence, giving your teams the confidence to make smart, data-driven calls.
Think of it this way: Traditional analytics might tell you what happened, like "20% of new users dropped off during onboarding." User behavior analytics tells you why it happened, revealing that "they all got stuck on the team invitation step because the button was hard to find."
This fundamental shift from "what" to "why" is what transforms raw data from a simple report into a genuine strategic asset. It helps teams prioritize the right fixes, design features people will actually use, and personalize the user experience in ways that directly grow the business.
Moving Beyond Surface-Level Metrics
Many teams get caught up tracking vanity metrics like daily active users or average session time. While these numbers have their place, they don't tell the whole story. A user could be logged in all day but getting absolutely nothing done—a classic sign of friction, not engagement. User behavior analytics helps you dig much deeper by focusing on meaningful interactions and outcomes.
The practical benefits of this approach are huge:
- Reduced Churn: By spotting the early warning signs of frustration or disengagement, you can step in with proactive support and save at-risk accounts before they walk away.
- Increased Retention: You can finally understand what makes your best customers so successful and then build that "golden path" into the product for everyone else, boosting long-term loyalty.
- Higher Feature Adoption: Pinpoint which features deliver that "aha!" moment and guide users toward them, making your product stickier and more valuable.
- New Revenue Opportunities: Discover which users are consistently hitting their usage limits or poking around premium features—these are clear signals that they're ready for an upgrade.
A Market Driven by Necessity
The rapid adoption of user behavior analytics isn't just a passing trend; it’s a direct response to a critical business need. The global behavior analytics market, valued at USD 1.5 billion in 2025, is on track to hit USD 7.63 billion by 2034. That explosive growth, driven by a compound annual growth rate of 17.81%, shows just how essential these insights have become for both security and customer experience. You can find more market data from sources like Fortune Business Insights.
Ultimately, UBA provides the clear vision needed to tie your product roadmap directly to customer value. It’s how you stop building features no one asked for and start creating a product that your users can't imagine living without.
Decoding User Actions: The Data and Methods That Matter
To get to the bottom of user behavior, you have to think like a data detective. It's all about gathering clues from different places to piece together the complete story of how people interact with your product. Effective user behavior analytics isn't about looking at one type of data; it's about blending them together to turn raw actions into real-world insights.
It really starts with two sides of the same coin:
- Quantitative Data: This is your "what" and "how many." Think hard numbers: clicks, session times, page views, and how often a feature gets used. This data gives you the big picture and shows you the scale of what's happening.
- Qualitative Data: This is the "why" behind the numbers. It’s the human context you find in support tickets, live chat logs, notes from sales calls, and survey responses.
The magic happens when you combine them. Your quantitative data might scream that 70% of users are abandoning their cart during checkout. That's a huge problem, but it doesn't tell you why. Then you dig into your support tickets—the qualitative data—and discover three people mentioned a broken promo code field this week. Suddenly, you have a clear problem and a direct path to a fix.
Core Methods for Analyzing User Behavior
Once you have the data, you need the right analytical tools to make sense of it all. Think of these methods as different lenses, each designed to bring a specific part of the user experience into focus. They help you move from a messy pile of data to a clear narrative about your users.
This visual from Report Prime does a good job of showing how all the different pieces of user behavior analytics—from the data you collect to how you deploy your tools—fit together.
What the chart really drives home is that whether you’re on-premise or in the cloud, the end goal is always the same: turning data into meaningful security and operational insights.
To help you get started, we've broken down the four fundamental methods for analyzing user behavior. Each method answers a different, but equally important, business question.
Key User Behavior Analytics Methods Explained
| Analytical Method | What It Is | Key Business Question Answered |
|---|---|---|
| Event Tracking | Logging specific, meaningful user actions (e.g., clicks, form submissions) as discrete "events." | "What are my users actually doing inside the product?" |
| Session Replay | Recording and playing back a user's entire session, including mouse movements, scrolls, and clicks. | "Why are my users struggling with this particular feature or workflow?" |
| Clustering | Using machine learning to automatically group users into segments based on their shared behaviors. | "Who are my power users, my at-risk users, and my specialists?" |
| Anomaly Detection | Establishing a baseline of "normal" behavior and automatically flagging significant deviations from it. | "What sudden changes in user behavior signal a risk or an opportunity?" |
Now, let's take a closer look at what each of these methods looks like in practice.
Ground-Level Insights: Events and Sessions
Event Tracking This is the foundation of everything. Event tracking is like leaving a trail of digital breadcrumbs for every user. You log specific, meaningful actions they take, such as ‘Clicked_Upgrade_Button’, ‘Completed_Onboarding_Tutorial’, or ‘Invited_New_User’. These events are the building blocks of all user behavior analytics.
By meticulously tracking these actions, you can start answering some of your most burning questions:
- Which features do our most loyal customers use every day?
- Where are new users getting stuck and giving up during onboarding?
- What sequence of events typically leads to a conversion?
Session Replay If event tracking gives you the breadcrumbs, session replay provides a full video recording of the user's journey. This technique captures an entire session—every mouse movement, click, scroll, and text input—and lets you watch it exactly as it happened.
Session replays are incredibly powerful for empathy-building. Watching a user struggle in real-time to find a button or fill out a form provides an undeniable, visceral understanding of product friction that a simple metric never could.
It’s the perfect tool for diagnosing a bug a customer reported, figuring out why people are dropping off a signup form, or just seeing how users are really interacting with a new feature you just shipped.
Big-Picture Patterns: Advanced Techniques
Beyond looking at one user at a time, advanced methods help you see the forest for the trees. These techniques often use machine learning to uncover patterns across your entire user base that would be impossible to spot manually.
Clustering Clustering is a powerful technique that automatically groups users into segments based on what they do, not who you think they are. Instead of creating personas based on guesswork, a clustering algorithm might identify distinct behavioral groups on its own, like:
- Power Users: Folks with high login frequency who use a wide range of features.
- At-Risk Accounts: Teams whose usage is declining and who are running into more errors.
- Specialists: Users who ignore most of the product but go incredibly deep on one specific feature.
Grouping users this way is a powerful concept. To go further, check out our guide on what cohort analysis is and how you can use it to track these segments over time.
Anomaly Detection Think of anomaly detection as an automated early-warning system. It learns what "normal" behavior looks like for an account and then immediately alerts you when something changes. When it comes to user behavior, small deviations can signal big problems, which is why understanding metrics like bounce rate is crucial for spotting immediate disengagement.
Anomalies aren't always bad news. A sudden spike in a team's feature usage might mean they’re ready for an upgrade. On the flip side, an abrupt drop in logins is a massive red flag for churn. This method is all about helping you find risks and opportunities before they become obvious.
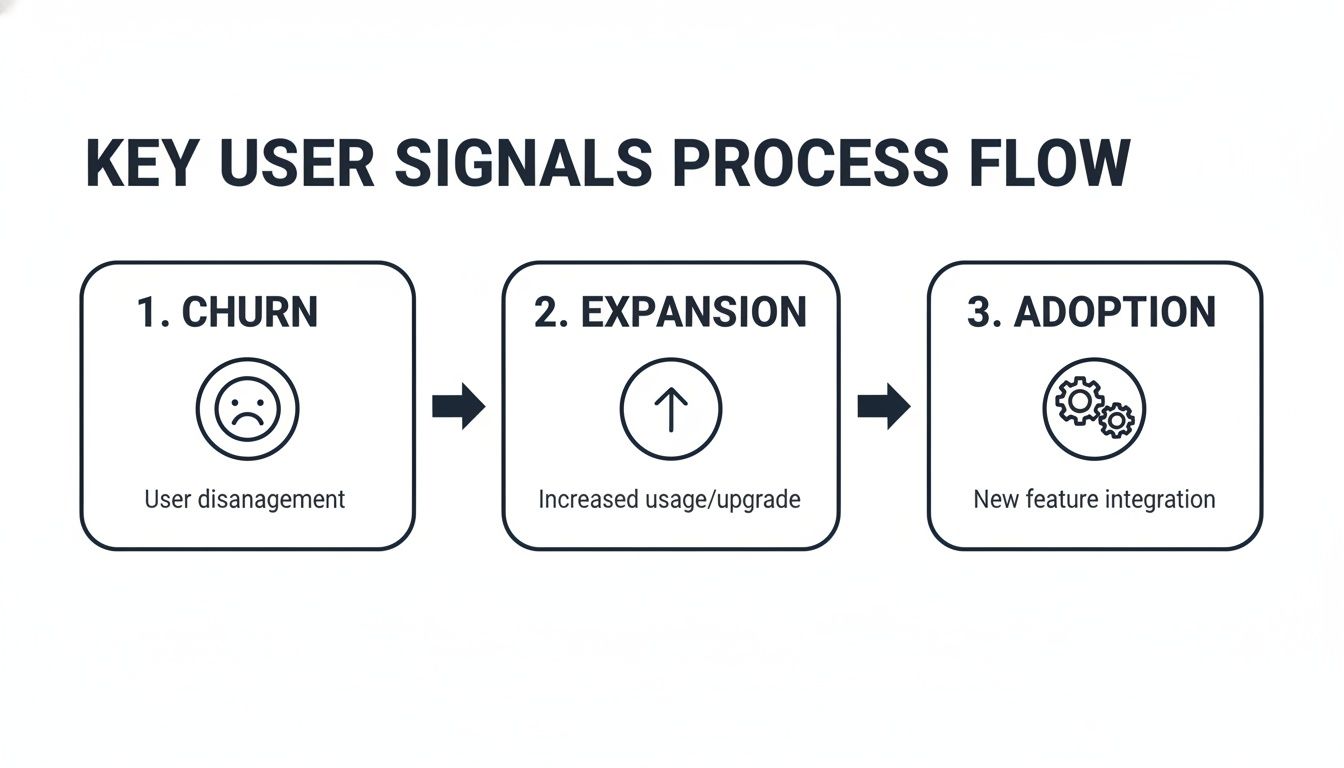
Identifying Key Signals That Predict Churn and Expansion
Once you’ve started collecting user data, the real work begins. Having a mountain of data is one thing; knowing what to look for is another entirely. The goal is to find the specific signals that predict major business outcomes, giving you an early warning system for risks and opportunities long before they ever hit your monthly revenue reports.
Think of yourself as a doctor for your product. You're not just taking a patient's temperature. You’re listening to their breathing, checking reflexes, and noticing all the subtle signs that point toward either great health or a brewing problem. User behavior signals tell you the true story of your customer's health in the exact same way.
Reading the Tea Leaves of User Churn
No one decides to cancel their subscription overnight. The decision to leave is almost always the last step in a long journey of disengagement and frustration. Pinpointing these churn predictors is one of the most powerful things you can do with user behavior analytics, as it gives you a chance to step in before it's too late.
So, what does this actually look like? Key predictors often include:
- A sudden drop in logins: An account that used to log in daily but now only shows up once a week is a huge red flag.
- Abandoning key workflows: When users stop leaning on the core features that once made your product essential, it means they no longer see its value.
- A spike in support tickets: A sudden flood of complaints, bug reports, or "how-to" questions from one account often signals rising frustration.
- Decreased feature usage: A power user who suddenly stops using advanced features might be quietly re-evaluating whether they need your solution at all.
By focusing on these leading indicators instead of lagging ones like non-renewal notices, you shift from a reactive to a proactive retention strategy. It's the difference between patching a sinking ship and spotting the small leak before it becomes a big problem. Learn more about how to build these early warning systems in our comprehensive guide to predictive churn modeling.
Uncovering Hidden Opportunities for Expansion
On the flip side, user behavior doesn't just warn you about churn—it also shines a spotlight on your happiest, most engaged customers. These expansion signals are pure gold, pointing you directly to upsell and cross-sell opportunities that are far easier to close than brand-new business.
You’re looking for customers who are actively showing you they’ve outgrown their current plan. Common expansion signals are:
- Consistently hitting usage limits: Teams that frequently bump up against API call limits, storage caps, or seat licenses are all but asking for an upgrade.
- Exploring premium features: When users on a standard plan start clicking into pages or tooltips for premium-only features, that’s a direct sign of interest.
- High user-to-seat ratio: If a ten-seat license has ten daily active users, you can bet the team is getting maximum value and will likely need to add more seats soon.
Acting on these signals completely changes the sales conversation. Instead of making cold calls, your team can reach out with a solution to a problem they know the customer is already facing.
Measuring True Feature Adoption
Finally, it’s not enough to know if a feature is being used. You have to understand how deeply it’s woven into a user's work. Superficial clicks are just vanity metrics. Real feature adoption is about a user getting tangible value, and user behavior analytics helps you see the difference.
For instance, do users just click the "Export Report" button once and forget about it, or are they building it into a weekly workflow? Do they set up a new project and abandon it, or do they invite team members and start assigning tasks? These deeper engagement patterns are what show you which features are truly indispensable.
This intense focus on behavior is fast becoming a core skill for modern product and growth teams. It’s why the user behavior analytics market is projected to swell from USD 1.14 billion in 2025 to USD 1.83 billion by 2032, hitting USD 1.22 billion in 2026 alone. This growth proves the immediate payoff for teams that stop guessing and start watching what their customers actually do. To dive deeper into market trends, check out the latest research on the UBA market.
Your Practical Roadmap to Implementing User Behavior Analytics
So, you're sold on the idea of user behavior analytics. The real question is, where do you even begin? It’s easy to feel overwhelmed, but the key is to treat this as a phased journey, not a massive, one-time project. You can start small, get some quick wins, and build momentum from there.
Think of it like building a house. You don't start by picking out furniture; you pour a solid foundation first. This four-stage roadmap is your blueprint, guiding you from laying the groundwork all the way to creating a system that actively drives your business forward.
Stage 1: Instrumentation and Data Collection
First things first: you can't analyze what you don't track. This initial phase, often called instrumentation, is all about deciding which user actions truly matter and then setting up the tools to capture them. The biggest mistake you can make here is trying to track everything. Don't.
Instead, start with a handful of core events that are clear signals of value and engagement. Good starting points include:
- User login frequency: The simplest pulse check for an active user.
- Completion of key workflows: Did they actually create that project or send that invoice?
- Feature adoption milestones: When a user tries a "sticky" feature for the first time.
- Team invitations: A powerful sign that your product is becoming essential to a company's workflow.
The goal here is to establish a clean, reliable stream of event data. This is the raw material for everything that follows.
Stage 2: Building Centralized Data Pipelines
Once your event data is flowing, the next step is to break down the walls between your different systems. Your product usage data is valuable, but its real power is unlocked when you combine it with information from elsewhere. This stage is all about creating a single, unified view of each customer.
Right now, you might be trying to solve a puzzle with half the pieces missing. That’s what it's like when your product analytics are isolated from your CRM or support desk. The goal is to build data pipelines that bring all of it into one place.
By connecting data from your product, your CRM (like Salesforce), and your support system (like Zendesk), you can start answering the really interesting questions. For instance, "Do customers who submit a lot of support tickets use the product less?" or "Are accounts in the finance industry adopting our new features faster?" This unified view is the bedrock of any serious analytics effort.
Stage 3: Developing Predictive Models
With a clean, centralized dataset, you can finally shift from looking backward to looking forward. This is where you move beyond simple reporting on what happened and start building models that predict what will happen next.
This is where the magic really starts. You're no longer just looking at historical trends on a dashboard; you're using machine learning to find the subtle patterns that precede a major business outcome.
These models can learn the specific sequence of actions that indicates a customer is about to cancel, or the behaviors that signal an account is ready for an upsell.
Stage 4: Operationalizing Your Insights
This is the final, and most critical, stage: turning all that data into action. An insight that just sits on a dashboard is worthless. To make it count, you need to operationalize your findings by embedding them directly into the daily workflows of your product, sales, and success teams.
You do this through automated alerts and integrations that trigger real-world responses.
- Real-Time Alerts: You can set up notifications in tools like Slack or Microsoft Teams that fire when something important happens. For example, an alert can be triggered when a high-value account’s usage suddenly drops by 50% for three days straight.
- Automated Workflows: Connect your analytics platform to project management tools like Jira. When your system identifies a bug affecting a growing number of customers, it can automatically generate a high-priority ticket—complete with an estimated revenue impact score.
After your analytics pinpoint the key signals that predict churn, using customer retention software becomes the logical next step to act on those warnings and prevent attrition. This closes the loop, transforming your user behavior analytics program from a simple reporting function into a proactive engine that drives revenue across the entire business.
Real-World Use Cases That Drive SaaS Revenue

The theory behind user behavior analytics is great, but what really matters is how it performs in the wild. When you get down to it, the true test is the impact on your bottom line. We've seen firsthand how SaaS teams turn these insights into a tangible return on investment, moving from abstract data points to real-world revenue.
Take a B2B SaaS company that was bleeding new customers for no apparent reason. By digging into their support tickets and watching corresponding session replays, they found the culprit: a nasty bug in their payment workflow. It only affected certain browsers, and it was costing them an estimated $50,000 in monthly revenue.
With literal video proof of customers getting stuck and abandoning their carts, the internal debate was over. The engineering team prioritized the fix, rolled it out in a week, and the revenue leak was plugged. That’s the power of user behavior analytics—it gives you irrefutable evidence to solve expensive problems, fast.
Find Expansion Opportunities and Lighten the Support Load
But it's not all about plugging leaks. User behavior data is also your best tool for spotting growth opportunities. At another company, the growth team noticed a pattern with one of their enterprise clients. The client was constantly hitting their API limits and their users were all over the documentation for premium-tier features.
This wasn't guesswork; it was a clear signal that the customer was outgrowing their current plan. The growth team used this intel to craft a proactive, tailored proposal that directly addressed the client's scaling pains. They closed a six-figure expansion deal that, without those behavioral clues, they might never have known was on the table.
By analyzing how customers interact with your product, you transform your growth strategy from passive waiting to proactive engagement. You meet customers where they are, with exactly what they need, at the moment they need it most.
Beyond growing revenue, these insights can also have a massive impact on your team's efficiency. A customer support team, for instance, was getting buried under a mountain of repetitive tickets. By analyzing the user journeys that led people to contact support, they pinpointed three specific points of friction in the UI that were causing constant confusion.
They added some simple in-app guidance and tooltips right where users were getting stuck. The results were immediate and impressive:
- Ticket volume dropped by 30% in just two months.
- Customer satisfaction scores for onboarding saw a significant lift.
- The support team was freed up to focus on more complex, high-value customer issues.
The Exploding Market for Behavioral Data
These stories aren't isolated incidents. They represent a major shift in how businesses operate. The demand for understanding what users do—and why—is skyrocketing. Valued at USD 8.96 billion in 2026, the behavior analytics market is projected to hit USD 23 billion by 2030, growing at a blistering compound annual growth rate of 26.6%. You can dive deeper into the numbers in this report on how behavioral analytics is shaping global business trends.
Each of these examples brings the methods we've discussed to life, showing the real business impact of turning clicks, scrolls, and hovers into a strategic advantage. This is about more than just collecting data; it's about making smarter decisions to protect your revenue and build a product people can't live without.
How AI-Powered Analytics Augments Your Team
Building a full-blown user behavior analytics program can feel overwhelming. The sheer amount of data is one thing, but making sense of it all is another challenge entirely. This is where a modern, AI-powered platform comes in, acting as a powerful force multiplier for your team—not a replacement.
Think of it as a tireless analyst working for you 24/7. This isn't just about crunching numbers; it's about connecting dots you simply don't have the time to see. These systems can automatically pull in and make sense of data from dozens of different places, like your product usage logs, support tickets in Zendesk, chat conversations from Intercom, and even notes from sales calls.
Finding the Signal in the Noise
At its core, an AI platform’s job is to find the valuable “signal” buried in the “noise” of everyday user activity. It’s constantly sifting through all that incoming data, looking for patterns that actually line up with important business outcomes.
Instead of your team spending hours or days digging for clues, the AI surfaces the most critical insights for you. This automated analysis offers some serious advantages:
- Predictive Churn Alerts: The system can spot the subtle changes in behavior that signal an account is at risk of churning, giving you a heads-up long before they go silent.
- Expansion Opportunity Highlighting: It can flag accounts that are perfectly positioned for an upgrade by noticing when they bump up against usage limits or start exploring premium features.
- Revenue Impact Scoring: By connecting user friction points directly to real accounts, it can actually put a dollar value on a bug or a missing feature, making it much easier to prioritize your work.
This shifts your analytics from a reactive tool for pulling reports into a proactive engine focused on revenue. An AI platform can serve up a daily dashboard that essentially says, “These five issues are actively costing you money right now, and these three opportunities could help you close new deals.”
From Qualitative Feedback to a Prioritized Roadmap
One of the biggest struggles for any product team is turning all that qualitative customer feedback into a coherent development roadmap. An AI-driven system like SigOS closes this gap by translating unstructured feedback into quantifiable, prioritized tasks. You can learn more about how AI is revolutionizing product development in our detailed guide.
The platform automatically groups similar pieces of feedback and links them to specific user actions and account values. Suddenly, you have a clear, data-backed picture of what you should build next.
It creates a direct line between what your customers are saying, what they're actually doing, and what it all means for your bottom line. This helps your product, growth, and customer success teams finally get on the same page, aligning around a shared strategy that’s laser-focused on revenue.
Frequently Asked Questions About User Behavior Analytics
As teams start exploring user behavior analytics, a few common questions always seem to pop up. Let's tackle them head-on so you can get started with confidence.
How Is User Behavior Analytics Different From Google Analytics?
This is a great question. Think of it this way: Google Analytics is fantastic for understanding how people find your website—it excels at tracking traffic sources, page views, and marketing funnels.
User behavior analytics, on the other hand, zooms in on what people do once they're inside your product. It’s all about the actions logged-in users take with your features. You're not just seeing that someone landed on a page; you're seeing exactly how they engage, where they get stuck, and which features they love. It’s the difference between tracking visitors to your store versus understanding how shoppers interact with each aisle.
Is It Difficult To Implement User Behavior Analytics?
It’s nowhere near as daunting as it might sound. The perception is that you need a huge engineering effort, but that’s not the case anymore. You don't have to track every single click from day one.
The best approach is to start small. Identify just a handful of critical user actions—like a user signing up, completing onboarding, or using a core feature for the first time—and track those first. You can get meaningful insights within weeks, not months, and then build from there.
Many modern platforms are designed for a quick setup, allowing even small teams to get the ball rolling without a massive upfront investment.
What About User Privacy and GDPR Compliance?
This is non-negotiable, and any serious platform treats it that way. Legitimate user behavior analytics tools are built from the ground up with privacy regulations like GDPR and CCPA in mind.
They should offer essential features like data anonymization, clear data retention policies, and straightforward ways to manage or delete user data when requested. When you're evaluating a tool, make sure it’s transparent about its data handling practices. Your users' trust is your most valuable asset, and your analytics platform must help you protect it.
Ready to transform qualitative feedback into a prioritized, revenue-focused roadmap? SigOS uses AI to find the signal in your user data, highlighting issues costing you money and opportunities that drive expansion. Discover how SigOS can augment your team.
Keep Reading
More insights from our blog


Ready to find your hidden revenue leaks?
Start analyzing your customer feedback and discover insights that drive revenue.
Start Free Trial →